3:30 p.m. New York time
Half an hour before the closing bell. The S&P 500 futures rose sharply during session, reaching the 4050s as the closing bell approached. The upward correction that began on February 22 is almost complete.
This morning I listed three possible targets as the endpoint of the correction, wave 4{-12} marking each possibility ln the chart with a large question mark. Two of the possibilities were eliminated by today’s rise, the 38.2% Fibonacci retracement level and the peak of the 4th wave within the preceding 3rd wave, which was wave 4{-13}. In honor of their being surpassed, I’ve changed their color to sickly green.
Remaining is 4098.25, the ending the proceeding 1st wave of the downtrend, wave 1{-12}, on February 16. This possible target differs from the other two. Under the rules of Elliott wave analysis, a 4th wave cannot exceed the endpoint of the preceding 1st wave.
If the price hits 2098.25 and reverses, then the upward correction ends at that point, and the final wave of the larger downtrend, wave 5{-12}, will have begun.
If the price exceeds 2098.25, then by the book, the labeling no longer reflects the reality of the chart — the map doesn’t match the territory — and the analysis will have to be redone.
Maybe. The S&P 500 and products derived from it are a complex ecosystem. The index trades only during the sessions, in increments of one cent. The futures trade 24 hours a day, takes Saturdays off, and then resumes trading Sunday evenings (New York time). The trading increment is 25 cents.
Given the large disparity between the increments by which each product moves, it’s easy to imagine the futures going over that absolute ceiling, while the index stays below it. The end of wave 1{-12} for the index, the ceiling for the upward correction, is 4049.14, set on February 17.
If there’s a disparity between the two trading vehicles, then each case is unique and must be judged based on what happens after the ceiling is hit. I tend to give greater weight to the index, since it has the smaller increment. But we’ll see.
9:35 a.m. New York time
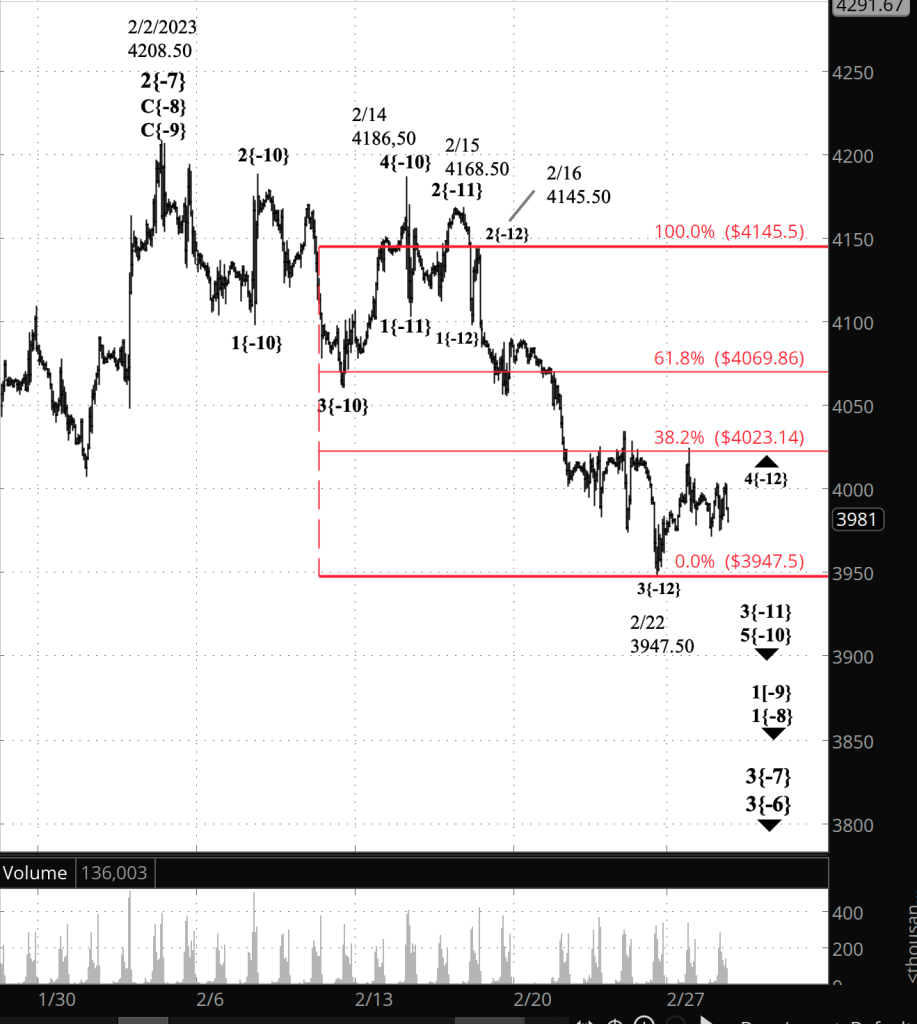
What’s happening now? The S&P 500 E-mini futures rose overnight, reaching 4011 so far.
What does it mean? The continued rise lends credence to the principal analysis since later February: The upward correction that began on February 22 is underway and is in its final wave. The correction is the 4th wave of a downtrend that began on February 15.
How high can it go?
- At the most, 4098.25, the end of the preceding 1st wave of the downtrend.
- Possibly in the vicinity of 4023.14, the 38.2% Fibonacci retracement level.
- Typically, no higher than 4034.25, the peak of the 4th wave within the preceding 3rd wave of the downtrend that began February 15. This level would be a small overshoot of the 38.2% Fib retracement, and I think this is the strongest possibllity.
See the humongous question marks on the chart.
What are the alternatives? None at present. For much of the week there has been a possibility that the upward correction had ended on February 27 at 4024.75 and that subsequent decline was the early stages of the downtrend that will follow the upward correction. The rise from yesterday’s low, 3925, makes that alternative vanishingly unlikely.
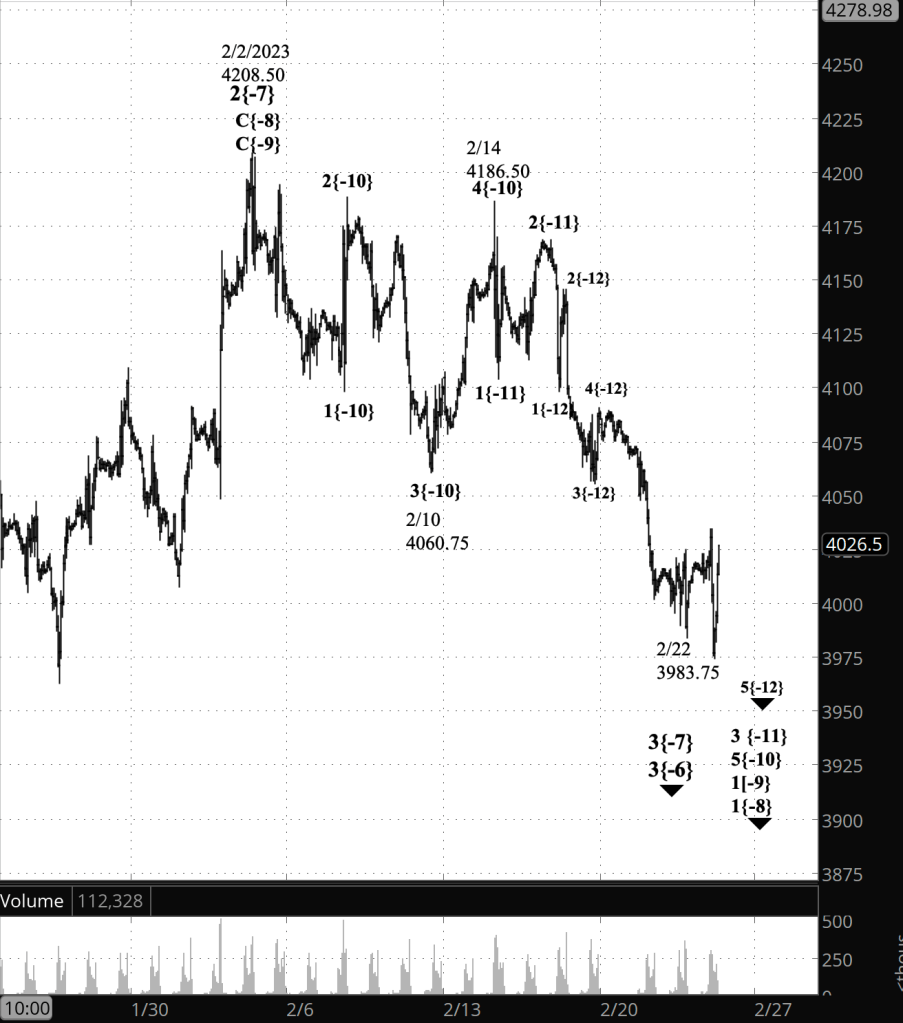
Reading the chart. Elliott wave analysis views the chart as a complex structure of smaller waves nested within larger waves, which in turn are nested within still larger waves. My labeling system assigns numbers to the subwaves of trending waves, and letters to the subwaves of corrections. Each number or letter is followed by a subscript, in curly brackets, showing the waves position within the complex structure, called its “degree” in Elliott wave parlance. The smaller the number, the lower the degree. On this chart we’re dealing with relatively small waves, so the degree numbers are negative.
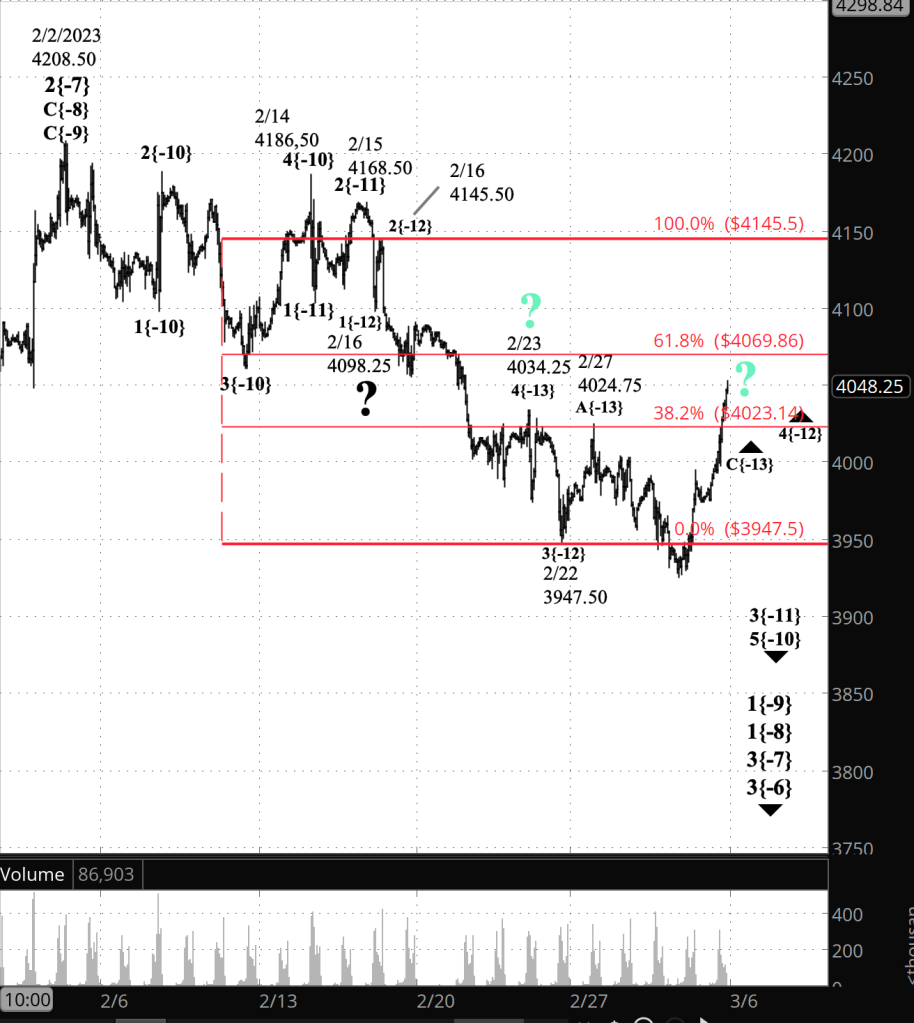
[S&P 500 E-mini futures at 3:30 p.m., hourly bars, with volume]
What does Elliott wave theory say? These are the waves that are I’m keeping a close eye on.
Principal analysis:
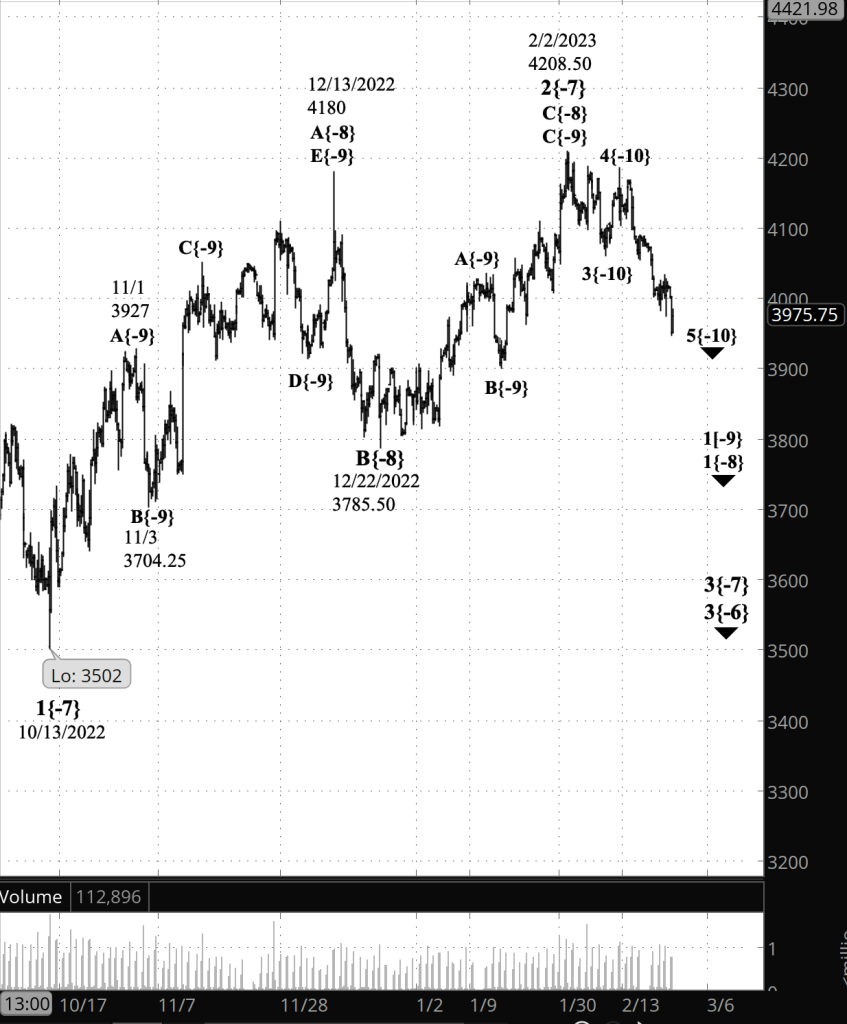
- The downward correction that began on February 2, wave 3{-7}, continues.
- It is in the first of five subwaves, wave 1{-8}.
- Within wave 1{-8}, wave 1{-9} is underway and is in the final subwave within a five-wave structure, downtrending wave 5{-10}.
- Wave 5{-10}, in turn, is in its middle wave, 3{-11}.
- Wave 3{-11}’s middle wave, wave 3{-12}, ended on February 22, and the next-to-the-last wave, an upward correction, wave 4{-12}, is now underway.
- Internally, wave 4{-12} is in its final wave of three, C{-13}.
- The end of wave C{-13} will be the end of the correction, wave 4{-12}, which will be followed by wave 5{-12}, which will mark the end of wave 3{-11}, a subwave of downtrending wave 5{-10}.
- The end of wave 5{-12} will also be the end of wave 3{-11}, a subwave of downtrending wave 5{-10}.
- When wave 5{-10} is complete, it will also mark the end of wave 1{-9} and the beginning of a low-degree upward correction, wave 2{-9}.
- Wave 3{-7} is still taking its tentative first steps and will develop into a powerful downtrend that will carry the price below 3502, the starting point of the preceding upward correction, wave 2{-7}, and most likely significantly below that level.
How high can it go: Here’s the Elliott wave nomenclature for the possible endpoints of wave 4{-12}.
- At the most, 4098.25, the end of wave 1{-12} within wave 3{-11} within wave 5{-10}.
- Possibly in the vicinity of 4023.14, the 38.2% Fibonacci retracement level.
- Typically, no higher than 4034.25, the peak of the wave 4{-13} within wave 3{-12} within wave 3{-11}.
We Are Here.
These are the waves currently in progress under my principal analysis. Each line on the list shows the wave number, with the subscript in curly brackets, the traditional degree name, the starting date, the starting price of the S&P 500 E-mini futures, and the direction of the wave.
- S&P 500 Index:
- 5{+3} Supercycle, 7/8/1932, 4.40 (up)
- 5{+2} Cycle, 12/9/1974, 60.96 (up)
- 5{+1} Primary, 3/6/2009, 666.79 (up)
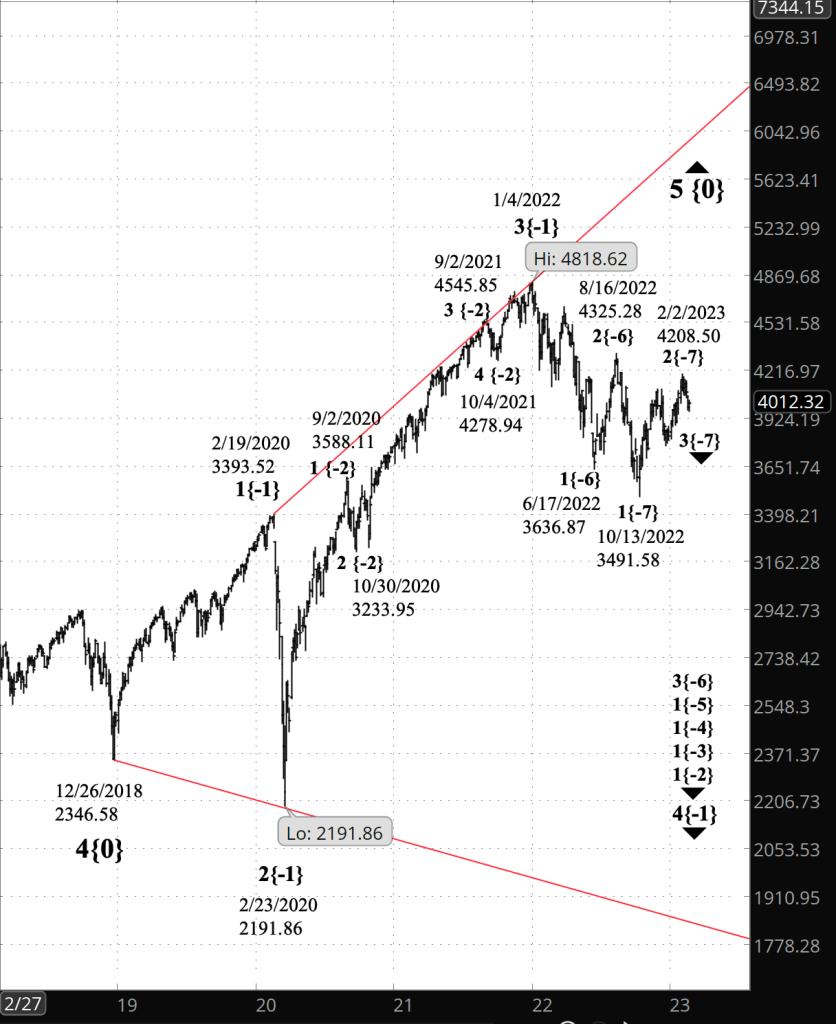
- 5{0} Intermediate, 12/26/2018, 2346.58 (up)
- S&P 500 Futures and index:
- 4{-1} Minor, 1/4/2022, 4808.25 (down) (futures), 4818.62 (down) (index)
- S&P 500 Futures:
- 1{-2} Minute, 1/4/2022, 4808.25 (down)
- 1{-3} Minuette, 1/4/2022, 4808.25 (down)
- 1{-4} Subminuette, 1/4/2022, 4808.25 (down)
- 1{-5} Micro, 1/4/2022, 4808.25 (down)
- 3{-6} Submicro, 8/16/2022, 4327.50 (down)
- 3{-7} Minuscule, 2/2/2023, 4208.50 (down)
Learning and other resources. Elliott wave analysis provides context, not prophecy. As the 20th century semanticist Alfred Korzybski put it in his book Science and Sanity (1933), “The map is not the territory … The only usefulness of a map depends on similarity of structure between the empirical world and the map.” And I would add, in the ever-changing markets, we can judge that similarity of structure only after the fact.
See the menu page Analytical Methods for a rundown on where to go for information on Elliott wave analysis.
By Tim Bovee, Portland, Oregon, March 3, 2023
Disclaimer
Tim Bovee, Private Trader tracks the analysis and trades of a private trader for his own accounts. Nothing in this blog constitutes a recommendation to buy or sell stocks, options or any other financial instrument. The only purpose of this blog is to provide education and entertainment.
No trader is ever 100 percent successful in his or her trades. Trading in the stock and option markets is risky and uncertain. Each trader must make trading decisions for his or her own account, and take responsibility for the consequences.
License
All content on Tim Bovee, Private Trader by Timothy K. Bovee is licensed under a Creative Commons Attribution-ShareAlike 4.0 International License.
Based on a work at www.timbovee.com.


You must be logged in to post a comment.