3:30 p.m. New York time
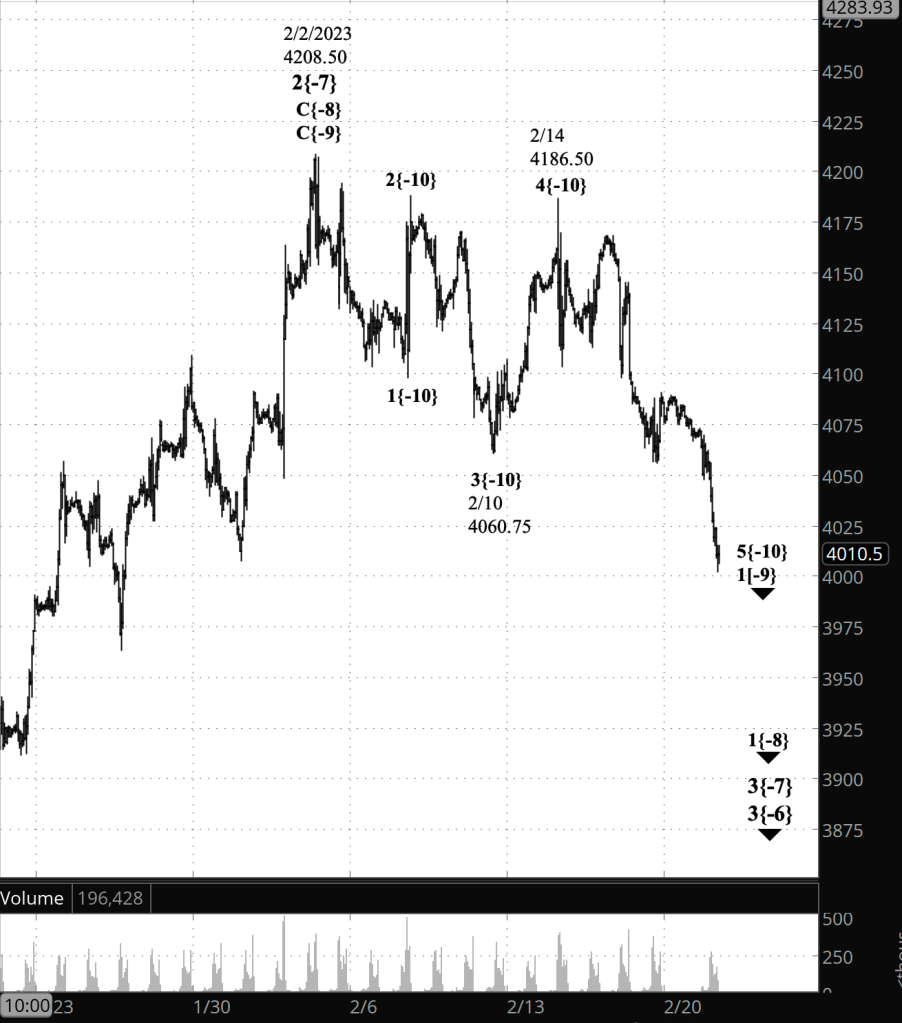
Half an hour before the closing bell. The S&P 500 futures continued to fall during the session, reaching a low so far of 3986.25. This morning’s analysis is unchanged. I’ve updated the chart.
3:15 p.m. New York time
COIN earnings play exit. I’ve exited my short bear fall vertical options spread for 24% of maximum potential profit and have updated the trade analysis with full results.
1:15 p.m. New York time
NVDA earnings play entry. I’ve entered a bear call vertical spread on NVDA, timed to coincide with the company’s earnings announcement, using options that trade for the last time on March 17, and have posted an analysis of the trade.
9:35 a.m. New York time
What’s happening now? The S&P 500 E-mini futures traded narrowly overnight, near the session close, 4007.75, before breaking free from the range in the early morning hours, falling to 3995.50, and then bouncing up into the 4020s.
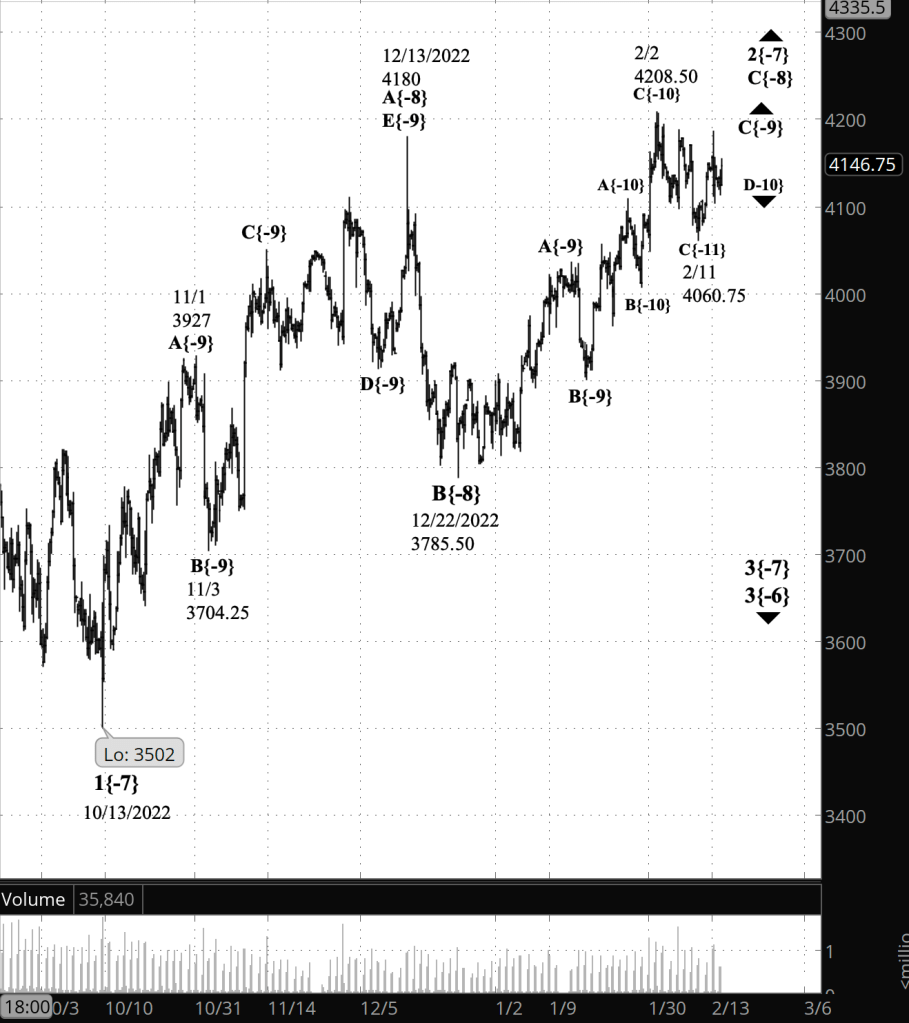
What does it mean? The downtrend that began on February 2 is in its first leg and still has some distance to go before that initial wave, the first of five, is complete. Working our way down the chain of subwaves, two levels smaller are also in their initial wave, the third level down is in its final wave, the fourth level in its middle wave and the fifth level lower is in its final wave.
Moving back up to the largest wave within the downtrend: When it is complete, it will be followed by an upward correction that will take back a significant portion of the decline since February 2 while remaining below that date’s peak, 4208.50. The downtrend ultimately will move below 3502, the end point of the preceding upward correction, and almost certainly signifiantly below that level.
What are the alternatives? There are two:
Alternative #1: It remains possible that the present movement is a subwave of the upward correction that began on October 13, which, under this scenario, is still not complete. A reversal and rise above 4208.50 would confirm thiws analysis.
Alternative #2: Early in a directional movement, determining the place of a subwave in the fractal hierarchy of waves — smaller waves within larger waves that in turn are the subwaves of still larger waves — is at best an experienced guess, at worse a throw of the dice. All of the subwaves I’ve labeled on the chart cold be one or two degrees higher, or one degree lower. There’s no way to know for sure. This doesn’t effect the analysis; however, it can speed things up or slow them down.
Chart note. The fractal nature of stock movements requires a complex labeling system. The chart mark-up, showing the Elliott wave analysis, works like this: Each wave has a designation — a number or letter — that shows its position within the larger structure that contains it. And each wave designation is followed by a subscript, in curly brackets, to indicate the wave’s place, its degree, within the complete fractal structure of the price movements.

[S&P 500 E-mini futures at 3:30 p.m., hourly bars, with volume]
What does Elliott wave theory say? Here are the waves that my analyses are based on.
Principal analysis:
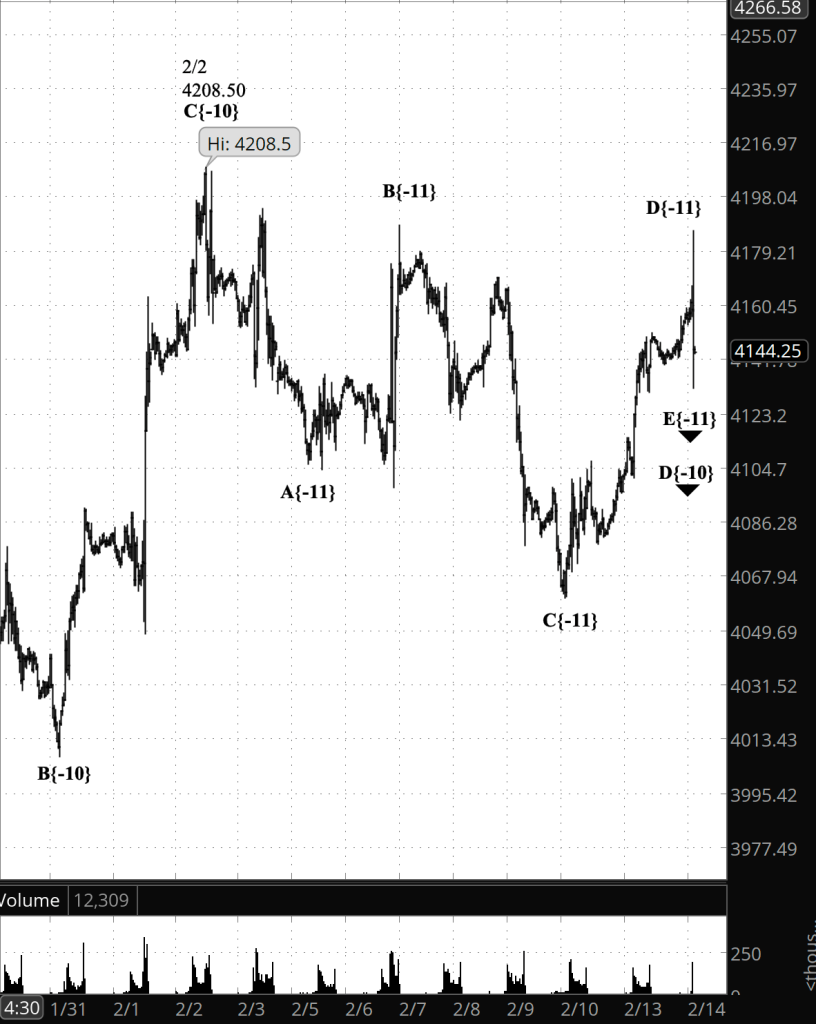
- The downward correction that began on February 2, wave 3{-7}, continues.
- It is in the first of five subwaves, wave 1{-8}.
- Within wave 1{-8}, wave 1{-9} is underway and is in the final subwave within a five-wave structure, downtrending wave 5{-10}.
- Wave 5{-10}, in turn, is in its middle wave, 3{-11}, which is in its final wave, 5{-12}.
- When wave 5{-10} is complete, it will also mark the end of wave 1{-9} and the beginning of a low-degree upward correction, wave 2{-9}.
- Wave 3{-7} is still taking its tentative first steps and will develop into a powerful downtrend that will carry the price below 3502, the starting point of the preceding upward correction, wave 2{-7}, and most likely significantly below that level.
Alternative analysis #1:
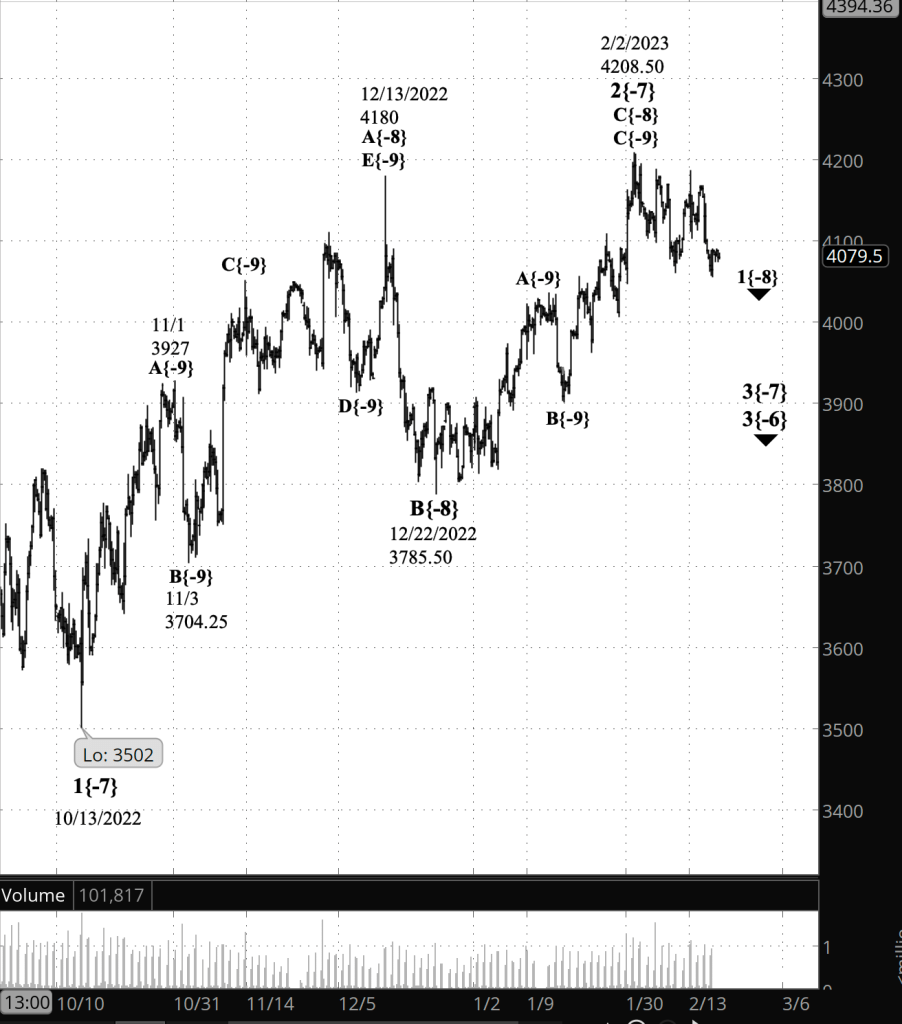
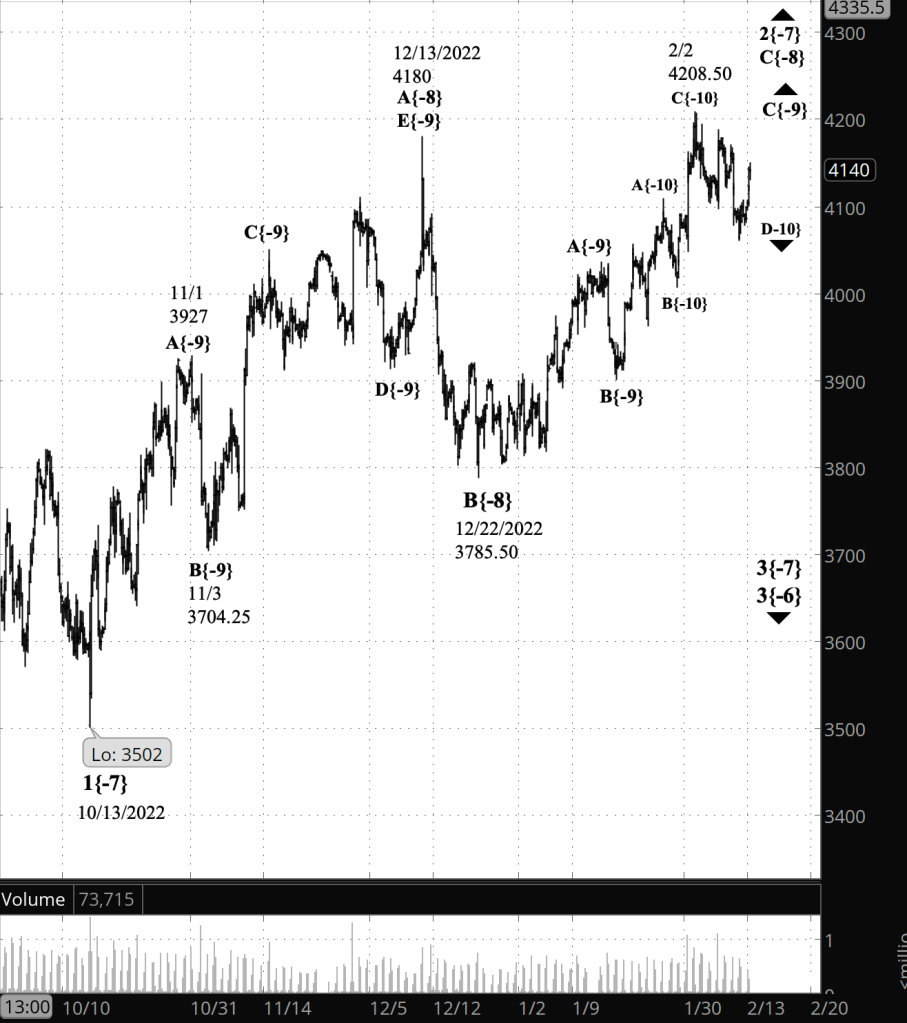
- The upward correction that began on October 13, 2022, wave 2{-7}, is still underway.
- It is in the third of three parts, upward wave C{-8}.
- C{-8} in turn is in its third and final subwave, rising wave C{-9}.
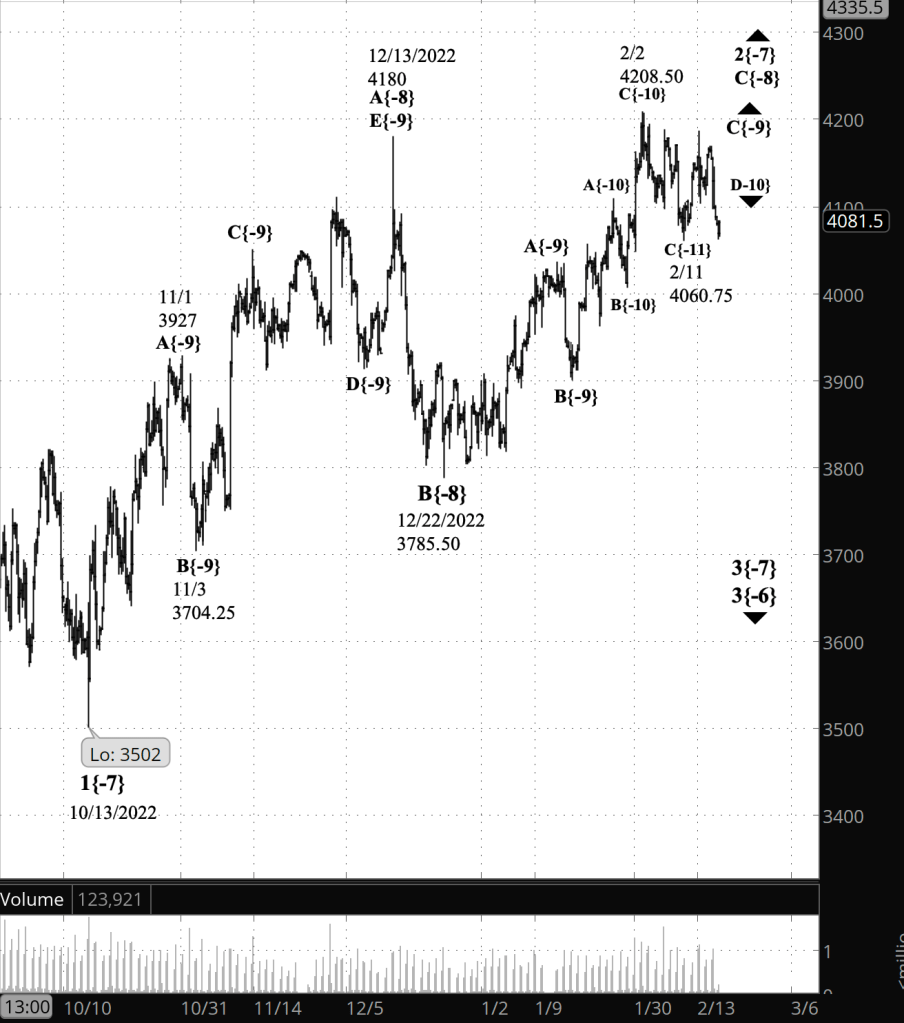
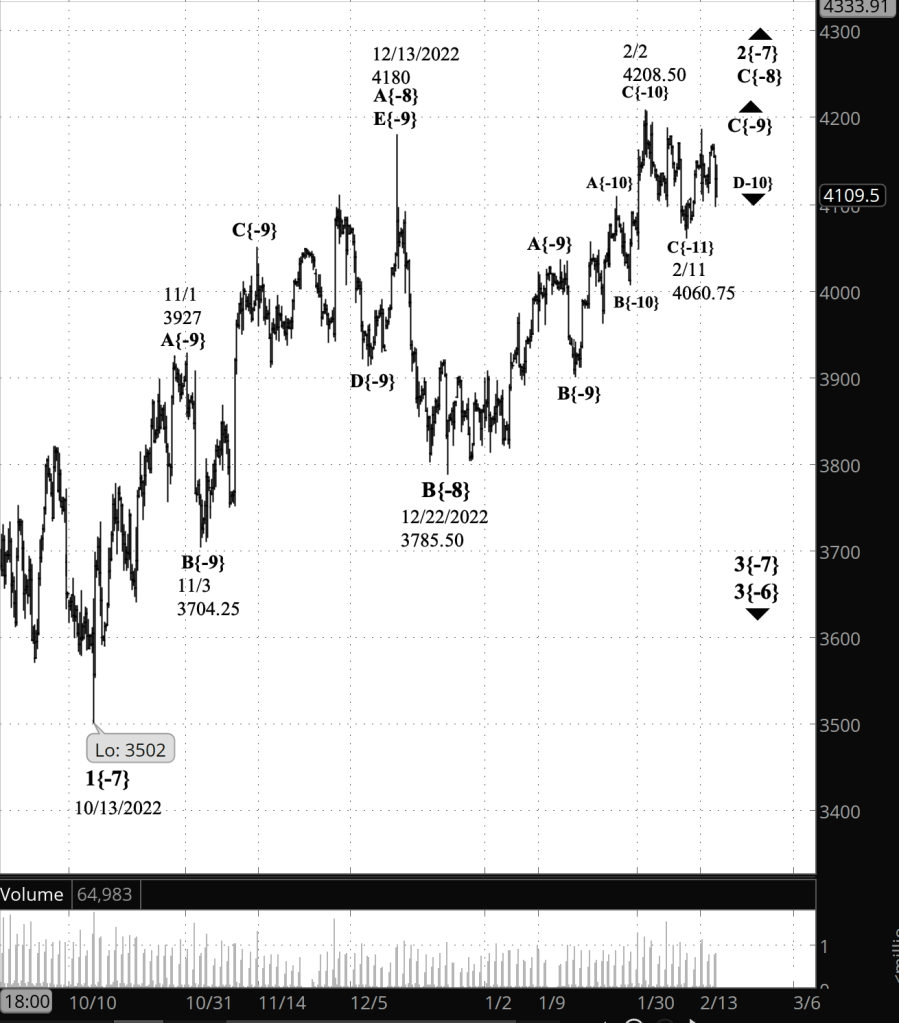
- Wave C{-9} has five subwaves and is in the fourth, declining wave D{-10}.
- Wave D{10} will be followed by rising wave E{-10},
- A wave in wave E{-10}’s position normally will exceed the endpoint of the prior upward wave, 4208.50, which is wave C{-10}. That peak was attained on February 2.
- The end of the wave E{-10} will also be the end of waves C{-9}, C{-8} and of the upward correction, wave 2{-7}.
- Wave 3{-7} will follow, a powerful downtrend that will carry the price below the starting point of the correction, 3502, and most likely significantly below that level.
Alternative analysis #2:
The degrees of the waves my analysis have a degree (no pun intended) of uncertainty. What I’ve labeled as wave 1{-8} could in fact be wave 1{-9}, with another wave 1{-8} inserted in between and pushing everything smaller down a degree. Or the wave 1{-9} on my chart could in fact be 1{-8}, raising everything up by a degee.
Confirmation signals.
The principal analysis will be confirmed if the present decline, wave 3{-7} and its subwaves move below 3502.
Alternative analysis #1 will be confirmed if the present decline, wave D{-10}, moves above 4208.50.
Situations such as those described in alternative analysis #2 are generally confirmed by a price movement that breaks the Elliott wave analysis rules somehow. Since the chart is always right, this means performing a new analysis that almost always results in changes in the degree of each wave.
Bigger structures:
- This is all happening within wave 3{-6}, which began on August 16, 2022.
- Wave 3{-6} is encompassed by a series of larger waves, the smaller within the larger, stretching up five degrees to wave 4{-1}, which began on January 4, 2022.
- Wave 4{-1} is the next-to-the-last wave within a large expanding Diagonal Triangle, wave 5{0}, that began on December 26, 2018
We Are Here.
These are the waves currently in progress under my principal analysis. Each line on the list shows the wave number, with the subscript in curly brackets, the traditional degree name, the starting date, the starting price of the S&P 500 E-mini futures, and the direction of the wave.
- S&P 500 Index:
- 5{+3} Supercycle, 7/8/1932, 4.40 (up)
- 5{+2} Cycle, 12/9/1974, 60.96 (up)
- 5{+1} Primary, 3/6/2009, 666.79 (up)
- 5{0} Intermediate, 12/26/2018, 2346.58 (up)
- S&P 500 Futures and index:
- 4{-1} Minor, 1/4/2022, 4808.25 (down) (futures), 4818.62 (down) (index)
- S&P 500 Futures:
- 1{-2} Minute, 1/4/2022, 4808.25 (down)
- 1{-3} Minuette, 1/4/2022, 4808.25 (down)
- 1{-4} Subminuette, 1/4/2022, 4808.25 (down)
- 1{-5} Micro, 1/4/2022, 4808.25 (down)
- 3{-6} Submicro, 8/16/2022, 4327.50 (down)
- 3{-7} Minuscule, 2/2/2023, 4208.50 (down)
Learning and other resources. Elliott wave analysis provides context, not prophecy. As the 20th century semanticist Alfred Korzybski put it in his book Science and Sanity (1933), “The map is not the territory … The only usefulness of a map depends on similarity of structure between the empirical world and the map.” And I would add, in the ever-changing markets, we can judge that similarity of structure only after the fact.
See the menu page Analytical Methods for a rundown on where to go for information on Elliott wave analysis.
By Tim Bovee, Portland, Oregon, February 22, 2023
Disclaimer
Tim Bovee, Private Trader tracks the analysis and trades of a private trader for his own accounts. Nothing in this blog constitutes a recommendation to buy or sell stocks, options or any other financial instrument. The only purpose of this blog is to provide education and entertainment.
No trader is ever 100 percent successful in his or her trades. Trading in the stock and option markets is risky and uncertain. Each trader must make trading decisions for his or her own account, and take responsibility for the consequences.
License
All content on Tim Bovee, Private Trader by Timothy K. Bovee is licensed under a Creative Commons Attribution-ShareAlike 4.0 International License.
Based on a work at www.timbovee.com.


You must be logged in to post a comment.