Trader’s Notebook

3:30 p.m. New York time

Half an hour before the closing bell. During the session so far the S&P 500 futures have traded from the 3950s up to the 4010s. No change in this morning’s analysis. There’s an equal chance that either the upward correction, wave 2{-9], that began on December 19, 2022 is underway, or that the correction ended at the overnight high, 4019.75, and a downtrend, wave 3{-9}, has begun. I’ve updated the chart.

9:35 a.m. New York time

What’s happening now? The S&P 500 E-mini futures whipsawed across 65 points after inflation figures for November were released before the opening bell. Beginning from 4008, the price jumped to 4019.75, fell within two minutes to 3954, and then rose over the next hour into the 4020s.

What does it mean? The 4019.75 high set a new peak for upward correction that began on December 19, 2022. And like any new peak of the last week, it could either be a stopping point as the correction continues to rise…

What are the alternatives? … or it could be the end of the upward correction, which subsequent movements below that level being the early phases of a downtrend that will carry the price significantly lower.

Chart note. Neither analysis, the principal nor the alternative, has an edge. Each has an equal likelihood of accurately mapping the terrain shown on the chart. I’ve chosen for the present to stick with the scenario that see the uptrend as still being underway.

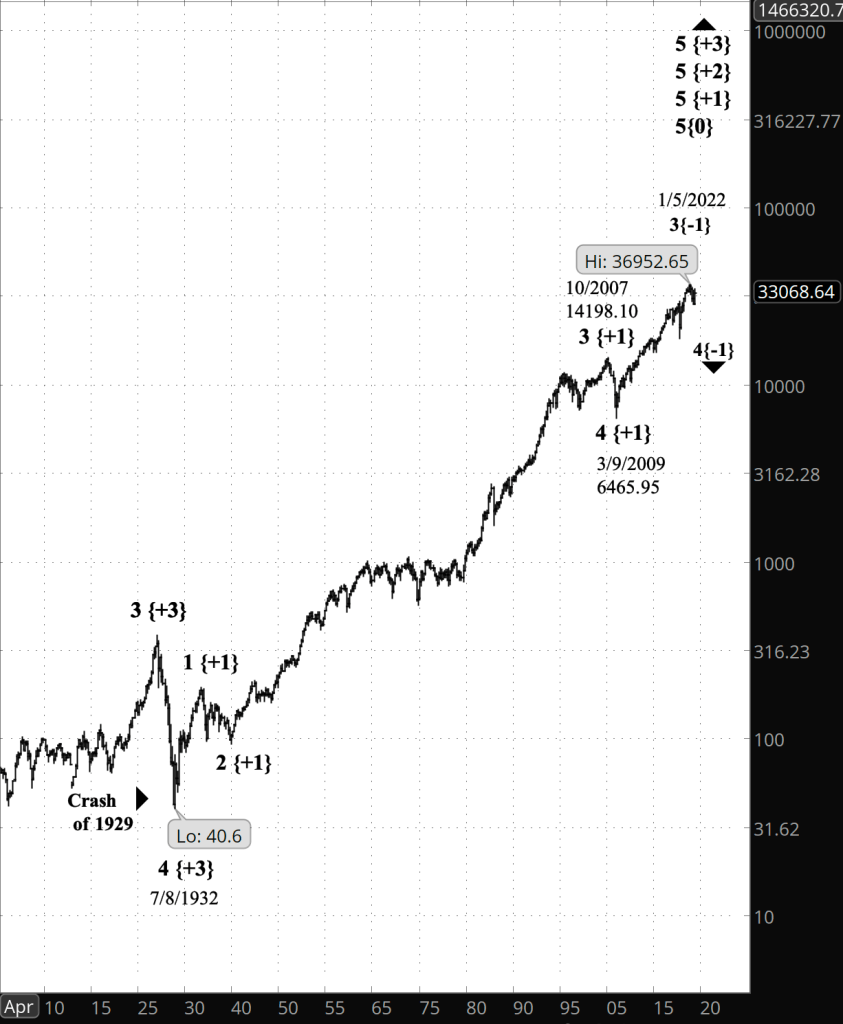
In Elliott wave theory, directional movements on stock charts — called “waves” — form a fractal structure, with smaller waves forming the building blocks of larger waves, which in turn form the building blocks of still larger waves. And all of those waves, whatever their size, form the same patterns and follow the same rules.

On the chart, I label the subwaves of trending waves with numbers and of corrective waves with letters. Each label has a subscript, in curly brackets, showing where the wave fits in the fractal structure, its relationship to other waves on the chart. That relationship is called its “degree”. The present chart shows waves of fairly small degree, and so the subscripts are negative.

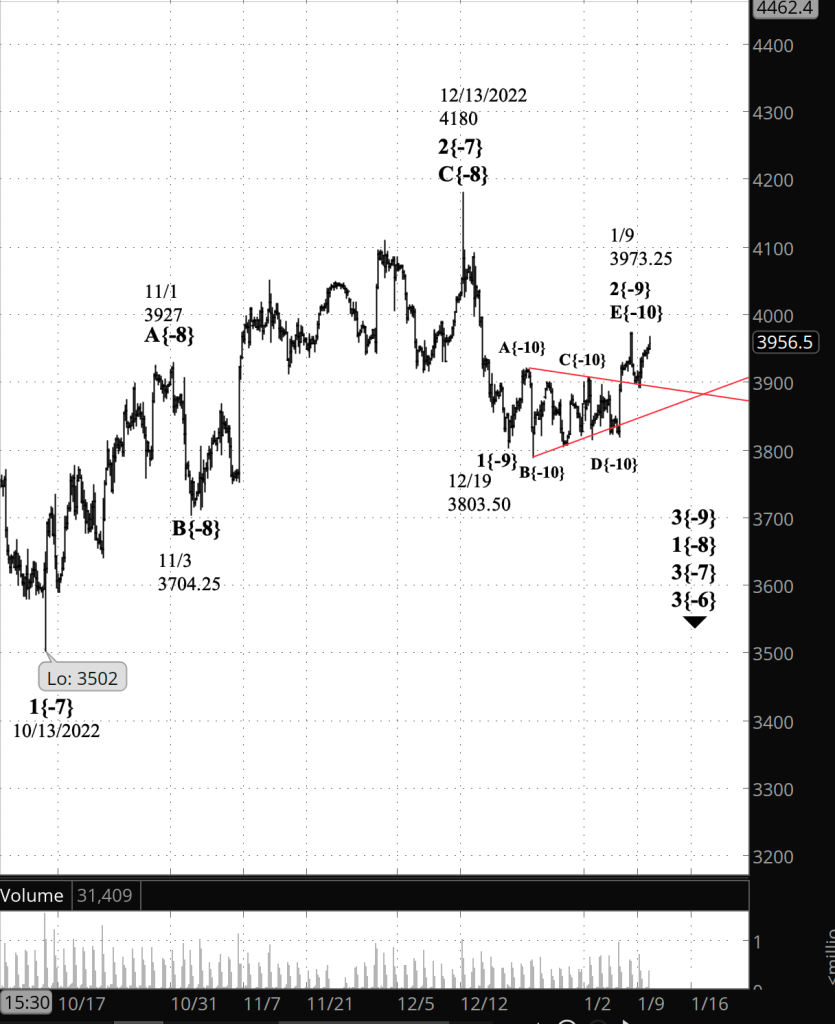
[S&P 500 E-mini futures at 3:30 p.m., 4-hour bars, with volume]

What does Elliott wave theory say? Under the principal analysis, these are the waves that I’m watching:

  • An upward correction, wave 2{-9}, has been underway since December 19, 2022.
  • The correction has taken the form of a Horizontal Triangle.
  • The Triangle is now in its fifth and final segment, wave E{-10}, which has shot above the upper boundary of the Triangle.
  • When complete, wave 2{-9} will be followed by a downtrend, wave 3{-9}.

Under the alternative analysis, the wave plays out this way:

  • A downtrend that began today is underway, It is wave 3{-9}.
  • Internally, wave 3{-9} is in its initial segment, wave 1{-9}.
  • That initial segment will be followed by an upward correction, wave 2{-9}

Both alternatives are structures within larger downtrends. From smaller to larger, they are:

  • Waves 1{-8} and 3{-8}, both of which began on December 1, 2022 from 4110.
  • Wave 3{-6}, which began on August 16, 2022 from 4327.50
  • And wave 1{-5}, which began on January 4, 2022, from 4808.25 — the starting point of a decline and I expect to last well into 2023 and perhaps longer.

We Are Here.

These are the waves currently in progress under my principal analysis. Each line on the list shows the wave number, with the subscript in curly brackets, the traditional degree name, the starting date, the starting price of the S&P 500 E-mini futures, and the direction of the wave.

  • S&P 500 Index:
  • 5{+3} Supercycle, 7/8/1932, 4.40 (up)
  • 5{+2} Cycle, 12/9/1974, 60.96 (up)
  • 5{+1} Primary, 3/6/2009, 666.79 (up)
  • 5{0} Intermediate, 12/26/2018, 2346.58 (up)
  • 4{-1} Minor, 1/4/2022 4818.62 (down)
  • 1{-2} Minute, 1/4/2022 4818.62 (down)
  • S&P 500 Futures and index:
  • 1{-3} Minuette, 1/4/2022, 4808.25 (down) (futures), 4818.62 (down) (index)
  • S&P 500 Futures:
  • 1{-4} Subminuette, 1/4/2022, 4808.25 (down)
  • 1{-5} Micro, 1/4/2022, 4808.25 (down)
  • 3{-6} Submicro, 8/16/2022, 4327.50 (down)
  • 3{-7} Minuscule, 12/1/2022, 4110 (down)
  • 1{-8} Subminuscule, 12/1/2022, 4110 (down)

Learning and other resources. Elliott wave analysis provides context, not prophecy. As the 20th century semanticist Alfred Korzybski put it in his book Science and Sanity (1933), “The map is not the territory … The only usefulness of a map depends on similarity of structure between the empirical world and the map.” And I would add, in the ever-changing markets, we can judge that similarity of structure only after the fact.

See the menu page Analytical Methods for a rundown on where to go for information on Elliott wave analysis.

By Tim Bovee, Portland, Oregon, January 12, 2023

Disclaimer

Tim Bovee, Private Trader tracks the analysis and trades of a private trader for his own accounts. Nothing in this blog constitutes a recommendation to buy or sell stocks, options or any other financial instrument. The only purpose of this blog is to provide education and entertainment.

No trader is ever 100 percent successful in his or her trades. Trading in the stock and option markets is risky and uncertain. Each trader must make trading decisions for his or her own account, and take responsibility for the consequences.

License
Creative Commons License

All content on Tim Bovee, Private Trader by Timothy K. Bovee is licensed under a Creative Commons Attribution-ShareAlike 4.0 International License.

Based on a work at www.timbovee.com.

Trader’s Notebook

3:30 p.m. New York time

Half an hour before the closing bell. The S&P 500 futures continued to push higher during the session, reaching into the 3980s. The upward correction that began on December 19, 2022 continues. The analysis posted at 1:25 p.m. is unchanged. I’ve updated the upper chart.

1:25 p.m. New York time

Alternative analysis rules! The S&P 500 futures moved above the January 9 high, invalidating the principal analysis and replacing it with the alternative analysis that I discussed this morning.

The upward correction that began on December 19, 2022 is still underway. In Elliott wave terminology, that correction is wave 2{-9}, and internally, it is in its final segment, wave E{-10}.

When wave 2{-9} is complete, it will be followed by a downward correction, wave 3{-9}, that will carry the price significantly lower.

Chart note: The upper chart shows the revised principal analysis.

[S&P 500 E-mini futures at 3:30 p.m., 210-minute bars, with volume]

10:50 a.m. New York time

I overslept. The markets open at 6:30 a.m. my local time, and I didn’t awaken as early as usual. Like the White Rabbit in the Disney cartoon version of Lewis Carroll’s Alice in Wonderland, I’m rushing around waving a pocket watch and saying, “I’m late! I’m late! I’m very, very late!” Here’s the complete analysis.

What’s happening now? The S&P 500 E-mini futures rose slightly in overnight trading, returning to the 3960s.

What does it mean? The movement remained below the January 9 high, 3973.25, and so is consistent with the principal analysis; The downtrend that began from that high is underway, having begun from that high.

What are the alternatives? A move above that January 9 high would mean that the downtrend has not yet begun and the upward correction that began on December 19 continues.

Under the alternative, the January 9 high was the end of the first part of the final segment within the upward correction that began on December 19. A downward movement will follow, and then a rise. Only then will the downtrend begin.

Chart note: The chart below shows the analysis prior to the price moving above the January 9 high. It is outdated, but I’ve retained it for comparison with the new principal analysis, shown on the chart above.

[Outdated analysis: S&P 500 E-mini futures at 10:50 a.m., 210-minute bars, with volume]

What does Elliott wave theory say? Under the principal analysis,

  • A downtrend, wave 3{-9} is underway. It began on January 9.
  • It is presently in an upward correction, wave 2{-10}.
  • As a 3rd wave, it will typically show a lot of energy as it reaches its middle subwave, 3{-10}, which will carry the price substantially lower.
  • Wave 3{-9} is segment of wave 1{-8}, which in turn is a subwave of wave 3{-7}. Both began on December 1.

Under the alternative analysis,

  • An upward correction, wave 2{-9}, is underway. It began on December 19.
  • It is presently in its final segment, rising wave E{-10}.
  • The end of wave E{-10} will also be the end of the upward correction, wave 2{-9}.
  • It will also mark the start of a downtrend, wave 3{-9}

We Are Here.

These are the waves currently in progress under my principal analysis. Each line on the list shows the wave number, with the subscript in curly brackets, the traditional degree name, the starting date, the starting price of the S&P 500 E-mini futures, and the direction of the wave.

  • S&P 500 Index:
  • 5{+3} Supercycle, 7/8/1932, 4.40 (up)
  • 5{+2} Cycle, 12/9/1974, 60.96 (up)
  • 5{+1} Primary, 3/6/2009, 666.79 (up)
  • 5{0} Intermediate, 12/26/2018, 2346.58 (up)
  • 4{-1} Minor, 1/4/2022 4818.62 (down)
  • 1{-2} Minute, 1/4/2022 4818.62 (down)
  • S&P 500 Futures and index:
  • 1{-3} Minuette, 1/4/2022, 4808.25 (down) (futures), 4818.62 (down) (index)
  • S&P 500 Futures:
  • 1{-4} Subminuette, 1/4/2022, 4808.25 (down)
  • 1{-5} Micro, 1/4/2022, 4808.25 (down)
  • 3{-6} Submicro, 8/16/2022, 4327.50 (down)
  • 3{-7} Minuscule, 12/1/2022, 4110 (down)
  • 1{-8} Subminuscule, 12/1/2022, 4110 (down)

Learning and other resources. Elliott wave analysis provides context, not prophecy. As the 20th century semanticist Alfred Korzybski put it in his book Science and Sanity (1933), “The map is not the territory … The only usefulness of a map depends on similarity of structure between the empirical world and the map.” And I would add, in the ever-changing markets, we can judge that similarity of structure only after the fact.

See the menu page Analytical Methods for a rundown on where to go for information on Elliott wave analysis.

By Tim Bovee, Portland, Oregon, January 11, 2023

Disclaimer

Tim Bovee, Private Trader tracks the analysis and trades of a private trader for his own accounts. Nothing in this blog constitutes a recommendation to buy or sell stocks, options or any other financial instrument. The only purpose of this blog is to provide education and entertainment.

No trader is ever 100 percent successful in his or her trades. Trading in the stock and option markets is risky and uncertain. Each trader must make trading decisions for his or her own account, and take responsibility for the consequences.

License
Creative Commons License

All content on Tim Bovee, Private Trader by Timothy K. Bovee is licensed under a Creative Commons Attribution-ShareAlike 4.0 International License.

Based on a work at www.timbovee.com.

Trader’s Notebook

3:30 p.m. New York time

Half an hour before the closing bell. The S&P 500 futures have risen back into the 3930s, above the upper boundary of the Horizontal Triangle that ended at yesterday’s high, 3973.25. The present decline and rise is consistent with the early stages of a downtrend, the scenario outlined in the principal analysis. I’ve updated the chart.

9:35 a.m. New York time

What’s happening now? The S&P 500 E-mini futures fell from yesterday’s high, returning to the 3890s and the upper boundary of the Horizontal Triangle that began on December 19, 2022. At the opening bell the price rose slight, reaching into the 3920s.

What does it mean? The decline strengthens the case that the January 9 high, 3973.25, marked the end of the Triangle and of the upward correction. Under this scenario, a powerful downtrend has begun.

What are the alternatives? It’s still possible that the price will reverse upward and the correction will continue. The price overshot the upper boundary of the Triangle — a not unusual occurrence –and the alternatives cover the possibility that the overshoot has not yet ended. These two alternative analyses have been part of the analytical picture since last week — January 5 — when the overshoot began.

  • The final segment within the upward correction may have completed only its first internal segment and may have another decline and then a final rise to complete before reaching its end. Given the price channel boundary overshoot, it doesn’t seem to be the most likely interpretation..
  • It’s not unusual for the final part of a Triangle to overshoot a price-channel boundary. It overshot further overnight and may overshoot even further before it is done.

Chart notes. I’ve labeled the chart to conform to the still tentative principal analysis — showing that the downtrend has begun. That in no way lessens the possibility that the upward correction has not yet ended.

The chart uses subscripts, in curly brackets, to denote the relative size of each wave (directional movement0 compared to others, a quality called a wave’s degree.

The Horizontal Triangle is marked on the chart in red.

[S&P 500 E-mini futures at 3:30 p.m., 180-minute bars, with volume]

What does Elliott wave theory say? Under the principal analysis…

  • The upward correction, wave 2{-9}, ended on January 9. It took the form of a Horizontal Triangle, with five subwaves.
  • A downtrend, wave 3{-9}, has begun. Third waves tend to be the most powerful waves on the chart. They move fast and furious.

Under the alternative analyses…

  • Wave 2{-9} is still underway.
  • Internally, it is tracing out wave E{-10}, the final wave of the Horizontal Triangle, which overshot the Triangle’s upper boundary.

Looking at the chart more broadly…

  • This is all happening within wave 1{-8}, the first wave within a downtrend, wave 3{-7}, that began on December 13, 2022.
  • Its parent wave, downtrending wave 3{-6}, began on August 16, 2022, and is a subwave of wave 1{-5}, a larger downtrend that began on January 4, 2022.

Note that wave 1{-5} is only the first wave of a larger downtrend, wave 1{-4}, which also began on January 4 of last year. That first wave has lasted for a year, and there are four more subwaves to go, including an energetic third wave, suggesting that the decline that began a year ago won’t be ending anytime soon.

We Are Here.

These are the waves currently in progress under my principal analysis. Each line on the list shows the wave number, with the subscript in curly brackets, the traditional degree name, the starting date, the starting price of the S&P 500 E-mini futures, and the direction of the wave.

  • S&P 500 Index:
  • 5{+3} Supercycle, 7/8/1932, 4.40 (up)
  • 5{+2} Cycle, 12/9/1974, 60.96 (up)
  • 5{+1} Primary, 3/6/2009, 666.79 (up)
  • 5{0} Intermediate, 12/26/2018, 2346.58 (up)
  • 4{-1} Minor, 1/4/2022 4818.62 (down)
  • 1{-2} Minute, 1/4/2022 4818.62 (down)
  • S&P 500 Futures and index:
  • 1{-3} Minuette, 1/4/2022, 4808.25 (down) (futures), 4818.62 (down) (index)
  • S&P 500 Futures:
  • 1{-4} Subminuette, 1/4/2022, 4808.25 (down)
  • 1{-5} Micro, 1/4/2022, 4808.25 (down)
  • 3{-6} Submicro, 8/16/2022, 4327.50 (down)
  • 3{-7} Minuscule, 12/1/2022, 4110 (down)
  • 1{-8} Subminuscule, 12/1/2022, 4110 (down)

Learning and other resources. Elliott wave analysis provides context, not prophecy. As the 20th century semanticist Alfred Korzybski put it in his book Science and Sanity (1933), “The map is not the territory … The only usefulness of a map depends on similarity of structure between the empirical world and the map.” And I would add, in the ever-changing markets, we can judge that similarity of structure only after the fact.

See the menu page Analytical Methods for a rundown on where to go for information on Elliott wave analysis.

By Tim Bovee, Portland, Oregon, January 10, 2023

Disclaimer

Tim Bovee, Private Trader tracks the analysis and trades of a private trader for his own accounts. Nothing in this blog constitutes a recommendation to buy or sell stocks, options or any other financial instrument. The only purpose of this blog is to provide education and entertainment.

No trader is ever 100 percent successful in his or her trades. Trading in the stock and option markets is risky and uncertain. Each trader must make trading decisions for his or her own account, and take responsibility for the consequences.

License
Creative Commons License

All content on Tim Bovee, Private Trader by Timothy K. Bovee is licensed under a Creative Commons Attribution-ShareAlike 4.0 International License.

Based on a work at www.timbovee.com.

Trader’s Notebook

3:30 p.m. New York time

Half an hour before the closing bell. The S&P 500 futures reached a session high of of 3973.25, tested close to that level again 35 minutes later, and then fell back into the 3910s. Was this the top of the upward correction? No way to tell. What we can know is that the upward correction is near its end, having satisfied all of the requirements of the form it has taken. No change in the analysis. I’ve updated the chart.

9:35 a.m. New York time

What’s happening now? The S&P 500 E-mini futures rose after trading resumed Sunday evening, reaching into the 3940s at the opening bell.

What does it mean? A Horizontal Triangle — the last segment of an upward correction that began on December 19, 2022 — is in its final leg and has overshot its upper boundary. When that final leg is complete, an energetic downtrend will follow.

What are the alternatives? There are two.

  • Where will it end? At this point, any higher high within that final leg could mark the end of the Triangle. Trying to call the end point is the upward version of what traders have long called “bottom fishing”.
  • The final segment within the upward correction may have completed only it’s first internal segment and may have another decline and then a final rise to complete before reaching its end. Given the price channel boundary overshoot, it doesn’t seem to be the most likely interpretation..
  • It’s not unusual for the final part of a Triangle to overshoot a price-channel boundary. It overshot further overnight and may overshoot even further before it is done.

Chart note. I’ve marked the Horizontal Triangle on the chart in red.

[S&P 500 E-mini futures at 3:30 p.m., 180-minute bars, with volume]

What does Elliott wave theory say? The accountant who developed Elliott wave theory in the 1930s, R.N. Elliott, labeled subwaves within trending waves using numbers and letters within corrective waves.

A key finding from his work is that stock price movements form a fractal structure — each wave containing subwaves and in turn being contained by larger waves. And all of those waves, in their complex beauty, produce the same patterns and follow the same rules.

I denote the place of a wave within the fractal hierarchy — what Elliott called its “degree” — by using a subscript, set off by curly brackets. The small the subscript number, the smaller the degree. The waves I’m tracking closely now are of a fairly low degree and so are negative numbers. Degree {0} is downtrend that began on January 4, 2022.

Here are the waves I’m keeping close watch on.

  • The upward correction that began on December 19 is wave 2{-9}.
  • The final leg of the Horizontal Triangle that is the form taken by wave 2{-9} is wave E{-10}.
  • When wave E{-10} is complete, wave 2{-9} will also be complete, and will be followed by wave 3{-9}, a downtrend that like all 3rd waves will have a great deal of power.
  • Wave 2{-9} is a subwave of wave 1{-8}, which in turn is the first subwave of wave 3{-7}, a downtrend that began December 13, 2022, from 4180.

We Are Here.

These are the waves currently in progress under my principal analysis. Each line on the list shows the wave number, with the subscript in curly brackets, the traditional degree name, the starting date, the starting price of the S&P 500 E-mini futures, and the direction of the wave.

  • S&P 500 Index:
  • 5{+3} Supercycle, 7/8/1932, 4.40 (up)
  • 5{+2} Cycle, 12/9/1974, 60.96 (up)
  • 5{+1} Primary, 3/6/2009, 666.79 (up)
  • 5{0} Intermediate, 12/26/2018, 2346.58 (up)
  • 4{-1} Minor, 1/4/2022 4818.62 (down)
  • 1{-2} Minute, 1/4/2022 4818.62 (down)
  • S&P 500 Futures and index:
  • 1{-3} Minuette, 1/4/2022, 4808.25 (down) (futures), 4818.62 (down) (index)
  • S&P 500 Futures:
  • 1{-4} Subminuette, 1/4/2022, 4808.25 (down)
  • 1{-5} Micro, 1/4/2022, 4808.25 (down)
  • 3{-6} Submicro, 8/16/2022, 4327.50 (down)
  • 3{-7} Minuscule, 12/1/2022, 4110 (down)
  • 1{-8} Subminuscule, 12/1/2022, 4110 (down)

Learning and other resources. Elliott wave analysis provides context, not prophecy. As the 20th century semanticist Alfred Korzybski put it in his book Science and Sanity (1933), “The map is not the territory … The only usefulness of a map depends on similarity of structure between the empirical world and the map.” And I would add, in the ever-changing markets, we can judge that similarity of structure only after the fact.

See the menu page Analytical Methods for a rundown on where to go for information on Elliott wave analysis.

By Tim Bovee, Portland, Oregon, January 9, 2023

Disclaimer

Tim Bovee, Private Trader tracks the analysis and trades of a private trader for his own accounts. Nothing in this blog constitutes a recommendation to buy or sell stocks, options or any other financial instrument. The only purpose of this blog is to provide education and entertainment.

No trader is ever 100 percent successful in his or her trades. Trading in the stock and option markets is risky and uncertain. Each trader must make trading decisions for his or her own account, and take responsibility for the consequences.

License
Creative Commons License

All content on Tim Bovee, Private Trader by Timothy K. Bovee is licensed under a Creative Commons Attribution-ShareAlike 4.0 International License.

Based on a work at www.timbovee.com.

Trader’s Notebook

3:30 p.m. New York time

Half an hour before the closing bell. The S&P 500 futures shot above the upper boundary of the Horizontal Triangle that began on December 19, 2022, fulfilling all of the structural requirements of that pattern and possibly completing the upward correction that began on that date.

Endpoints are often ambiguous in Elliott wave analysis. It is always possible for a directional movement to have a bit more push in it before reaching the end. I’ve marked the chart as though the rise, wave 2{-9}, were over and a downtrend, wave 3{-9} had begun, but I may have to take it back when trading resumes on Monday.

The alternatives;

  • Wave E{-10}, the final segment within the upward correction, wave 2{-9}, may have completed only it’s first subwave and may have another decline and then a final rise to complete before reaching its end. Given the price channel boundary overshoot, it doesn’t seem to be the most likely interpretation..
  • It’s not unusual for a final wave to overshoot a price-channel boundary, as has already happened with wave E{-10}. It may overshoot even further before it is done.

As I wrote this morning — and it bears repeating — “The biggest question mark is where will the upward correction end. I’ve found that looking for endpoints is a dive into a pool of ambiguity.” What the economist Karl Marx said about capitalism applies doubly to the end game on a chart: “All that is solid melts into air…”

9:35 a.m. New York time

What’s happening now? The S&P 500 E-mini futures shot up from the 3830s to the 3870s in a single minute when the employment numbers were released an hour before the opening bell. It then immediately dropped back to the 3840s and 3850s.

What does it mean? The explosive rise in response to the jobs number is fairly meaningless. The retreat halted at the lower boundary of a price channel marking an upward correction that began on December 19, 2022, meaning that the correction is still underway. The correction is taking the form of a Horizontal Triangle and will be followed by an energetic downtrend.

What are the alternatives? The biggest question mark is where will the upward correction end. I’ve found that looking for endpoints is a dive into a pool of ambiguity.

Chart note. The boundaries of the Triangle are marked in the chart in red. Price movements on the chart are fractal in nature, meaning bigger wave contain smaller waves and are contained by still bigger waves, all following the same patterns. The relative level of each wave — its degree — is given in a subscript, within curly brackets. The smaller the number, the smaller the degree. We’re tracking fairly small waves at present, and so the subscripts are all negative. Degree 0 is a downtrend that began on January 4, 2022, a degree that the developer of Elliott wave analysis, R.N. Elliott, called an Intermediate Wave.

[S&P 500 E-mini futures at 3:30 p.m., 210-minute bars, with volume]

What does Elliott wave theory say? The waves important to the analysis, small to large.

  • Wave 4{-10} is the next to the last wave within the Triangle.
  • The Triangle is the form taken by wave 2[-9}, an upward correction that began on December 19, 2022.
  • Wave 2{-9} is part of a downtrend, wave 1{-8}, which is the first wave within a larger downtrend, wave 3{-7}, which began on December 13, 2022.
  • The wave encompassing all of that is wave 3{-6}, a downtrend that began on August 16, 2022.
  • Above that degree is a series of 1st waves of increasing size, from 1{-5} up to 1{-2}, all having begun on January 4, 2022.
  • They are subwaves of wave 4{-1}, the downward next-to-the-last wave within an expanding Diagonal Triangle, wave 5{0}, the intermediate wave referred to in the chart note. Wave 5{0} began on December 27, 2018.

Big picture:

  • Wave 4{-1} may well end near the lower price channel boundary of the Diagonal Triangle, wave 5{0}. That boundary presently is around 1850 and moving lower each day.
  • It will be followed by rising wave 5{-1}, which will return to the upper boundary, presently in the 5870s and rising further every day.
  • The parent wave 5{0} is the final wave of an uptrend that began in 2009, wave 5{+1}.
  • Wave 5{+1}, when complete, will also be the end of waves 5{+2} and 5{+3}.
  • Wave 5{+3} began in 1932 at the end of the 1929 market crash that kicked off the Great Depression. That massive 5th wave will be followed by an equally massive downward movement of generational proportions.

A grim picture. But it will take us quite a long time to get there to the next generational crash. And in the meantime, there is money to be made by trading the uptrends and correction within those larger movements.

We Are Here.

These are the waves currently in progress under my principal analysis. Each line on the list shows the wave number, with the subscript in curly brackets, the traditional degree name, the starting date, the starting price of the S&P 500 E-mini futures, and the direction of the wave.

  • S&P 500 Index:
  • 5{+3} Supercycle, 7/8/1932, 4.40 (up)
  • 5{+2} Cycle, 12/9/1974, 60.96 (up)
  • 5{+1} Primary, 3/6/2009, 666.79 (up)
  • 5{0} Intermediate, 12/26/2018, 2346.58 (up)
  • 4{-1} Minor, 1/4/2022 4818.62 (down)
  • 1{-2} Minute, 1/4/2022 4818.62 (down)
  • S&P 500 Futures and index:
  • 1{-3} Minuette, 1/4/2022, 4808.25 (down) (futures), 4818.62 (down) (index)
  • S&P 500 Futures:
  • 1{-4} Subminuette, 1/4/2022, 4808.25 (down)
  • 1{-5} Micro, 1/4/2022, 4808.25 (down)
  • 3{-6} Submicro, 8/16/2022, 4327.50 (down)
  • 3{-7} Minuscule, 12/1/2022, 4110 (down)
  • 1{-8} Subminuscule, 12/1/2022, 4110 (down)

Learning and other resources. Elliott wave analysis provides context, not prophecy. As the 20th century semanticist Alfred Korzybski put it in his book Science and Sanity (1933), “The map is not the territory … The only usefulness of a map depends on similarity of structure between the empirical world and the map.” And I would add, in the ever-changing markets, we can judge that similarity of structure only after the fact.

See the menu page Analytical Methods for a rundown on where to go for information on Elliott wave analysis.

By Tim Bovee, Portland, Oregon, January 6, 2023

Disclaimer

Tim Bovee, Private Trader tracks the analysis and trades of a private trader for his own accounts. Nothing in this blog constitutes a recommendation to buy or sell stocks, options or any other financial instrument. The only purpose of this blog is to provide education and entertainment.

No trader is ever 100 percent successful in his or her trades. Trading in the stock and option markets is risky and uncertain. Each trader must make trading decisions for his or her own account, and take responsibility for the consequences.

License
Creative Commons License

All content on Tim Bovee, Private Trader by Timothy K. Bovee is licensed under a Creative Commons Attribution-ShareAlike 4.0 International License.

Based on a work at www.timbovee.com.

Trader’s Notebook

3:30 p.m. New York time

Half an hour before the closing bell. The S&P 500 futures hit the lower price boundary and reversed. If I count the waves within the upward correction that began on December 19, 2022, then that touch would end the 4th wave, with the wave having hit the lower boundary twice. I don’t have a lot of confidence that such a count is correct. Could be, though. I’ve updated the chart.

9:35 a.m. New York time

What’s happening now? The S&P 500 E-mini futures fell from its overnight high, 3885.50, into the 3830s.

What does it mean? The upward correction that began on December 19, 2022 continues and is taking the form of a Horizontal Triangle, which is in the fourth of five segments. When the correction is complete, it will be followed by an energetic decline, proportional to the size of the movements relative to the rest of the chart.

What are the alternatives? None at present. I’m sure alternatives will develop, as they always do.

Chart note. The Horizontal Triangle’s price channel is shown on the chart in red. Directional movements, or waves, within a correction are designated by letters, and within a trend, by numbers. Each label is followed by a subscript, in curly brackets, showing each directional movement’s place in the complex hierarchy of the chart, in which larger waves contain smaller waves and are in turn contained by still larger waves, a fractal structure. A wave’s place in the hierarchy is called its “degree”. The larger the subscript, the larger a wave’s degree.

[S&P 500 E-mini futures at 3:30 p.m., 210-minute bars, with volume]

What does Elliott wave theory say? Elliott wave theory says, “More of the same”.

Here are the waves that are guiding the analysis.

  • The upward correction that began on December 19, 2022 is wave 2{-9}.
  • It is a subwave of wave 1{-8}, a downtrending wave that began on December 13.
  • The parent wave of wave 1{-8} is wave 3{-7}, a downtrend that has much energy, like most 3rd waves, and that will carry the price down a signifiant distanced.
  • This is all happening within wave 3{-6}, which began on August 16, 2022…
  • … which in turn is part of wave 1{-5}, which began on January 4, 2022, the starting point of the large bear market that dominated the charts last year and probably will this year.

We Are Here.

These are the waves currently in progress under my principal analysis. Each line on the list shows the wave number, with the subscript in curly brackets, the traditional degree name, the starting date, the starting price of the S&P 500 E-mini futures, and the direction of the wave.

  • S&P 500 Index:
  • 5{+3} Supercycle, 7/8/1932, 4.40 (up)
  • 5{+2} Cycle, 12/9/1974, 60.96 (up)
  • 5{+1} Primary, 3/6/2009, 666.79 (up)
  • 5{0} Intermediate, 12/26/2018, 2346.58 (up)
  • 4{-1} Minor, 1/4/2022 4818.62 (down)
  • 1{-2} Minute, 1/4/2022 4818.62 (down)
  • S&P 500 Futures and index:
  • 1{-3} Minuette, 1/4/2022, 4808.25 (down) (futures), 4818.62 (down) (index)
  • S&P 500 Futures:
  • 1{-4} Subminuette, 1/4/2022, 4808.25 (down)
  • 1{-5} Micro, 1/4/2022, 4808.25 (down)
  • 3{-6} Submicro, 8/16/2022, 4327.50 (down)
  • 3{-7} Minuscule, 12/1/2022, 4110 (down)
  • 1{-8} Subminuscule, 12/1/2022, 4110 (down)

Learning and other resources. Elliott wave analysis provides context, not prophecy. As the 20th century semanticist Alfred Korzybski put it in his book Science and Sanity (1933), “The map is not the territory … The only usefulness of a map depends on similarity of structure between the empirical world and the map.” And I would add, in the ever-changing markets, we can judge that similarity of structure only after the fact.

See the menu page Analytical Methods for a rundown on where to go for information on Elliott wave analysis.

By Tim Bovee, Portland, Oregon, January 5, 2023

Disclaimer

Tim Bovee, Private Trader tracks the analysis and trades of a private trader for his own accounts. Nothing in this blog constitutes a recommendation to buy or sell stocks, options or any other financial instrument. The only purpose of this blog is to provide education and entertainment.

No trader is ever 100 percent successful in his or her trades. Trading in the stock and option markets is risky and uncertain. Each trader must make trading decisions for his or her own account, and take responsibility for the consequences.

License
Creative Commons License

All content on Tim Bovee, Private Trader by Timothy K. Bovee is licensed under a Creative Commons Attribution-ShareAlike 4.0 International License.

Based on a work at www.timbovee.com.

Trader’s Notebook

3:30 p.m. New York time

Half an hour before the closing bell. The S&P 500 futures has stuck narrow range during the session, from the 3890s to the 3830s. The upward correction that began on December 19, 2022 continues, taking the form of a Horizontal Triangle. I’ve updated the chart.

9:35 a.m. New York time

Happy birthday! The massive downtrend that is betraying bullish hopes and expectations began a year ago today, on January 4, 2022 on the S&P 500 futures. Other index derivatives and stocks began their declines at various times around that date. So raise a cup to toast the great slow-motion crash of 2022. The bear market is one year old.

What’s happening now? The S&P 500 E-mini futures rose along a shallow path in overnight trading, reaching into the 3870s in an upward movement that began on January 3 from 3814.50.

What does it mean? The rise is part of what appears to be the fourth wave within a Horizontal Triangle, an upward correction that began on December 19, 2022. Altogether, the Triangle will have five waves. The end of the Triangle, and of the upward correction, will be followed by an energetic downtrend that will carry the price lower.

What are the alternatives? The wave count is a bit ambiguous, with some uncertainty over whether a wave is a subwave or one of the waves defining the Triangle. So my assertion that the Triangle is in its fourth wave is somewhat tentative.

Chart note. The price channel boundaries of the Horizontal Triangle are shown on the chart in red.

[S&P 500 E-mini futures at 3:30 p.m., 210-minute bars, with volume]

What does Elliott wave theory say? These are the wave involved in the analysis. Each wave number or letter is followed by a subscript in curly brackets showing the wave degree, where it fits in the complex fractal structure of waves, subwaves (or child waves), and parent waves.

  • The Horizontal Triangle is wave 2{-9}, an upward correction.
  • Internally, the Triangle is in its fourth wave, D{-10}, which will be followed by a rising final movement, wave E{-10}. That final wave will complete the Triangle and wave 2{-9}.
  • It’s possible that the overnight rise is the beginning of wave E{-10}, but it seems to me that it is more likely a subwave of D{-10}
  • Wave 2{-9} will be followed by a downtrending wave, 3{-9}. Like most third waves, it is likely to show greater power than any other movement since the present decline began in mid-December.
  • Wave 2{-9} is part of a downtrending wave, 1{-8}.
  • Wave 1{-8} is a subwave of wave 3{-7}, a larger downtrend that began on December 13, 20223.
  • All of this is happening within wave 3{-6}, a powerful downtrend that began on August 16.
  • The parent of them all is wave 1{-5}, a downtrend that began a year ago, on January 4, 2022, from 4808.25.

We Are Here.

These are the waves currently in progress under my principal analysis. Each line on the list shows the wave number, with the subscript in curly brackets, the traditional degree name, the starting date, the starting price of the S&P 500 E-mini futures, and the direction of the wave.

  • S&P 500 Index:
  • 5{+3} Supercycle, 7/8/1932, 4.40 (up)
  • 5{+2} Cycle, 12/9/1974, 60.96 (up)
  • 5{+1} Primary, 3/6/2009, 666.79 (up)
  • 5{0} Intermediate, 12/26/2018, 2346.58 (up)
  • 4{-1} Minor, 1/4/2022 4818.62 (down)
  • 1{-2} Minute, 1/4/2022 4818.62 (down)
  • S&P 500 Futures and index:
  • 1{-3} Minuette, 1/4/2022, 4808.25 (down) (futures), 4818.62 (down) (index)
  • S&P 500 Futures:
  • 1{-4} Subminuette, 1/4/2022, 4808.25 (down)
  • 1{-5} Micro, 1/4/2022, 4808.25 (down)
  • 3{-6} Submicro, 8/16/2022, 4327.50 (down)
  • 3{-7} Minuscule, 12/1/2022, 4110 (down)
  • 1{-8} Subminuscule, 12/1/2022, 4110 (down)

Learning and other resources. Elliott wave analysis provides context, not prophecy. As the 20th century semanticist Alfred Korzybski put it in his book Science and Sanity (1933), “The map is not the territory … The only usefulness of a map depends on similarity of structure between the empirical world and the map.” And I would add, in the ever-changing markets, we can judge that similarity of structure only after the fact.

See the menu page Analytical Methods for a rundown on where to go for information on Elliott wave analysis.

By Tim Bovee, Portland, Oregon, January 4, 2023

Disclaimer

Tim Bovee, Private Trader tracks the analysis and trades of a private trader for his own accounts. Nothing in this blog constitutes a recommendation to buy or sell stocks, options or any other financial instrument. The only purpose of this blog is to provide education and entertainment.

No trader is ever 100 percent successful in his or her trades. Trading in the stock and option markets is risky and uncertain. Each trader must make trading decisions for his or her own account, and take responsibility for the consequences.

License
Creative Commons License

All content on Tim Bovee, Private Trader by Timothy K. Bovee is licensed under a Creative Commons Attribution-ShareAlike 4.0 International License.

Based on a work at www.timbovee.com.

Trader’s Notebook

3:30 p.m. New York time

Half an hour before the closing bell. The S&P 500 futures fell during the session to the lower boundary of the price channel, which defines a Horizontal Triangle that began on December 19. It then reversed to the upside. No change in the analysis. I’ve updated the chart.

9:35 a.m. New York time

What’s happening now? The S&P 500 E-mini futures rose when trading resumed after the New Year’s holiday, reaching 3906.75 as the opening bell approached, and then pulling back.

What does it mean? The downtrend that began on December 13 continues and internally is in an upward correction that is taking the form of a Horizontal Triangle. The upward correction will be followed by an energetic downtrend.

What are the alternatives? The Triangle can be viewed as Zig-zag pattern. The Triangle analysis seems to me to fit best, but there is, as always, some ambiguity.

Chart note. The price channel of the Triangle is drawn on the chart in red.

[S&P 500 E-mini futures at 3:30 p.m., 195-minute bars, with volume]

What does Elliott wave theory say? R.N. Elliott, an accountant, developed his method of analysis in the 1930s. That the market’s directional movements in price — the price waves — form repeating patterns was known Elliott’s time. His innovation lay in seeing putting those patterns as components of an elaborate structure, in which larger waves are built from smaller waves and in turn are building blocks of still larger waves.

Elliott used numbers to label the components of trending waves and letters for the components of counter-trend corrections. I follow that method on my charts and designate the relative size of each wave with a subscription in curly brackets. The subscript shows where in the complex structure each wave stands, called its “degree”. The larger the subscript number, the larger the degree.

From larger to smaller, these are the waves important to interpreting the chart.

  • The downtrend that began on December 13, 2022 is wave 3{-7}.
  • That wave is in its first component, downtrending wave 1{-8}.
  • The component is in an upward correction, wave 2{-9}, which is taking the form of a Horizontal Triangle.

A Horizontal Triangle is constructed from five subwaves. When the Triangle is complete, it will likely be the end of wave 2{-9}.

Downtrending wave 3{-9} will follow, with the energy that is characteristic of third waves.

This is all happening within larger downtrend, wave 3{-6}, which began on August 16, 2022 and is a subwave of wave 1{-5}, which began on January 4, 2022, the starting point of a large downtrend that will characterize the markets for some time to come.

We Are Here.

These are the waves currently in progress under my principal analysis. Each line on the list shows the wave number, with the subscript in curly brackets, the traditional degree name, the starting date, the starting price of the S&P 500 E-mini futures, and the direction of the wave.

  • S&P 500 Index:
  • 5{+3} Supercycle, 7/8/1932, 4.40 (up)
  • 5{+2} Cycle, 12/9/1974, 60.96 (up)
  • 5{+1} Primary, 3/6/2009, 666.79 (up)
  • 5{0} Intermediate, 12/26/2018, 2346.58 (up)
  • 4{-1} Minor, 1/4/2022 4818.62 (down)
  • 1{-2} Minute, 1/4/2022 4818.62 (down)
  • S&P 500 Futures and index:
  • 1{-3} Minuette, 1/4/2022, 4808.25 (down) (futures), 4818.62 (down) (index)
  • S&P 500 Futures:
  • 1{-4} Subminuette, 1/4/2022, 4808.25 (down)
  • 1{-5} Micro, 1/4/2022, 4808.25 (down)
  • 3{-6} Submicro, 8/16/2022, 4327.50 (down)
  • 3{-7} Minuscule, 12/13/2022, 4180 (down)
  • 1{-8} Subminuscule, 12/13/2022, 4180 (down)

Learning and other resources. Elliott wave analysis provides context, not prophecy. As the 20th century semanticist Alfred Korzybski put it in his book Science and Sanity (1933), “The map is not the territory … The only usefulness of a map depends on similarity of structure between the empirical world and the map.” And I would add, in the ever-changing markets, we can judge that similarity of structure only after the fact.

See the menu page Analytical Methods for a rundown on where to go for information on Elliott wave analysis.

By Tim Bovee, Portland, Oregon, January 3, 2023

Disclaimer

Tim Bovee, Private Trader tracks the analysis and trades of a private trader for his own accounts. Nothing in this blog constitutes a recommendation to buy or sell stocks, options or any other financial instrument. The only purpose of this blog is to provide education and entertainment.

No trader is ever 100 percent successful in his or her trades. Trading in the stock and option markets is risky and uncertain. Each trader must make trading decisions for his or her own account, and take responsibility for the consequences.

License
Creative Commons License

All content on Tim Bovee, Private Trader by Timothy K. Bovee is licensed under a Creative Commons Attribution-ShareAlike 4.0 International License.

Based on a work at www.timbovee.com.

Trader’s Notebook

New Year’s holiday trading. New Year’s Eve falls on a Sunday this year and the markets will be closed on Monday in observance of the holiday. The S&P 500 futures will resume trading Monday evening, January 2, 2023.

3:30 p.m. New York time

Half an hour before the closing bell. The S&P 500 futures has fallen during the session, reaching a low of 3821.50 as the closing bell approached. No change in the analysis. The downtrend that began on December 13, wave 3{-7}, continues. I’ve updated the short-term, upper chart.

9:35 a.m. New York time

What’s happening now? The S&P 500 E-mini futures withdrew from yesterday’s high, 3882.75, into the 3830s, as the final trading session of 2022 opened.

What does it mean? The first leg of a downtrend that began on December 13 continues. Internally, it is in its third of five segments, and within that third segment, is in the midst of a low-level upward correction.

What are the alternatives? For the past few weeks I’ve listed alternate analyses that saw the upward correction that began on October 13 as still being underway. I’m dropping those alternatives. The internal structure makes it clear that this downtrend is the real deal.

So I have no alternatives today. I’m quite certain they will develop as the chart progresses. Alternatives always do.

Chart notes. The upper chart, of the S&P 500 E-mini futures, shows the present downtrend and the upward correction that preceded it, running from mid-October to the present. The lower chart, of the Dow Jones Industrial Average, shows the Crash of 1929 and the subsequent uptrend that began in 1932 and is with us today.

[S&P 500 E-mini futures at 3:30 pm., 3-hour bars, with volume]

[Dow Jones Industrial Average at 9:30 a.m., quarterly bars]

What does Elliott wave theory say? Looking first at the near-term, upper chart of the S&P 500 futures…

These are the waves that are driving the action:

  • The downtrend that began on December 13 is wave 3{-7}.
  • It is in its initial subwave, downtrending wave 1{-8}.
  • The initial subwave is in its 3rd and middle segment, wave 3{-9}.
  • Wave 3{-9} is in an upward correction of low degree, wave 2{-10}

Wave 3{-9} will be followed by an upward correction, wave 4{-9}, and then a final decline, wave 5{-9}, that will complete the parent wave, 1{-8}.

Turning next to the very long term, lower chart of the Dow Jones Industrial Average…

  • The Crash of 1929, wave 4{-3}, ended in 1932.
  • The uptrend that followed, wave 5{-3}, is still underway, having traveled from 40.6 on the index top the January 5, 2022 peak, 36952.65.
  • The 2022 peak ended wave 3{-1}, the middle wave of wave 5{0}, the final wave of wave 5{+1}.
  • The completion of wave 5{+1} will also be the end of wave 5{+2}, which began in 1974, and wave 5{+3}, the rise that began in 1932.

The analysis shows that we are in a significant market correction, one that I expect to continue through 2023 and perhaps into 2024. It will be followed by an uptrend of massive proportions that will carry the price above the January 2022 high and almost certainly quite a distance above that level.

So Happy New Year, everyone. My motto as a trader for 2023 will be the words of the English Theologian Thomas Fuller, who began a sentence, “Thus, as it is always darkest just before the day dawneth…”. The quote comes from his 1650 work, A Pisgah-Sight of Palestine and the confines thereof; with the history of the Old and New Testaments acted thereon.

And so it is with the markets: It is always darkest before the dawn.

We Are Here.

These are the waves currently in progress under my principal analysis. Each line on the list shows the wave number, with the subscript in curly brackets, the traditional degree name, the starting date, the starting price of the S&P 500 E-mini futures, and the direction of the wave.

  • S&P 500 Index:
  • 5{+3} Supercycle, 7/8/1932, 4.40 (up)
  • 5{+2} Cycle, 12/9/1974, 60.96 (up)
  • 5{+1} Primary, 3/6/2009, 666.79 (up)
  • 5{0} Intermediate, 12/26/2018, 2346.58 (up)
  • 4{-1} Minor, 1/4/2022 4818.62 (down)
  • 1{-2} Minute, 1/4/2022 4818.62 (down)
  • S&P 500 Futures and index:
  • 1{-3} Minuette, 1/4/2022, 4808.25 (down) (futures), 4818.62 (down) (index)
  • S&P 500 Futures:
  • 1{-4} Subminuette, 1/4/2022, 4808.25 (down)
  • 1{-5} Micro, 1/4/2022, 4808.25 (down)
  • 3{-6} Submicro, 8/16/2022, 4327.50 (down)
  • 3{-7} Minuscule, 12/1/2022, 4110 (down)
  • 1{-8} Subminuscule, 12/1/2022, 4110 (down)

Learning and other resources. Elliott wave analysis provides context, not prophecy. As the 20th century semanticist Alfred Korzybski put it in his book Science and Sanity (1933), “The map is not the territory … The only usefulness of a map depends on similarity of structure between the empirical world and the map.” And I would add, in the ever-changing markets, we can judge that similarity of structure only after the fact.

See the menu page Analytical Methods for a rundown on where to go for information on Elliott wave analysis.

By Tim Bovee, Portland, Oregon, December 30, 2022

Disclaimer

Tim Bovee, Private Trader tracks the analysis and trades of a private trader for his own accounts. Nothing in this blog constitutes a recommendation to buy or sell stocks, options or any other financial instrument. The only purpose of this blog is to provide education and entertainment.

No trader is ever 100 percent successful in his or her trades. Trading in the stock and option markets is risky and uncertain. Each trader must make trading decisions for his or her own account, and take responsibility for the consequences.

License
Creative Commons License

All content on Tim Bovee, Private Trader by Timothy K. Bovee is licensed under a Creative Commons Attribution-ShareAlike 4.0 International License.

Based on a work at www.timbovee.com.

SPY Trade

S&P 500 ETF Trust (SPY)

Lot 2022-6

Update 2/6/2023: I exited my short bear all vertical spread on SPY, 11 days before expiration, for a $7.26 debit per contract/share, a loss before fees of $446 per contract. Shares were trading at $409.98, up $29.17 from the entry level.

The Implied Volatility Rank at exit was 9.5%, down 14.4 points from the entry level.

I exited on the day after entry because the position had only 11 days to expiration and I wanted to avoid exercise.

Shares rose by 71.7% over 39 days for a +72% annual rate. The options position produced a 61.7% loss for a -577% annual rate.


I have entered a short bear call vertical spread on SPY, using options that trade for the last time 50 days hence, on February 17, 2023. The premium is a $2.77 credit per contract share and the stock at the time of entry was priced at $380.81.

The Implied Volatility Ratio stood at 23.9%.

Premium:$2.77Expire OTM
SPY-bear call spreadStrikeOddsDelta
Calls
Long408.0083.0%19
Break-even400.7777.5%24.5
Short398.0072.0%30

The premium is 55.4% of the width of the position’s short/long spread. The profit zone covers a 5.2% move to the upside and an unlimited move to the downside.

The risk/reward ratio is 2.6:1, with maximum risk of $723 and maximum reward of $277 per contract.

How I chose the trade. I placed the trade based on Elliott wave analysis showing that S&P 500 — the index upon which SPY is based — began a downtrend on December 13.

By Tim Bovee, Portland, Oregon, December 29, 2022

Disclaimer

Tim Bovee, Private Trader tracks the analysis and trades of a private trader for his own accounts. Nothing in this blog constitutes a recommendation to buy or sell stocks, options or any other financial instrument. The only purpose of this blog is to provide education and entertainment.

No trader is ever 100 percent successful in his or her trades. Trading in the stock and option markets is risky and uncertain. Each trader must make trading decisions for his or her own account, and take responsibility for the consequences.

License
Creative Commons License

All content on Tim Bovee, Private Trader by Timothy K. Bovee is licensed under a Creative Commons Attribution-ShareAlike 4.0 International License.

Based on a work at www.timbovee.com.