Update 10/6/2021:The Fisher Transform indicator whipsawed on PAAS, giving a sell signal the day after a buy signal that triggered entry. I’ve exited the position for a $1.16 credit per contract/share, a loss of $0.35 from the entry price.The share price declined by $0.02, to $22.39.
The Implied Volatility Rate declined by 1.3 points to 18.9%.
Shares declined by 0.1% over one day for a -33% annual rate. The options position produced a 17.9% loss for a -6,518% annual rate.
I have entered a put position on PAAS, using options that trade for the last time 108 days hence, on January 21, 2022. The premium is a $1.96 debit per contract share and the stock at the time of entry was priced at $22.41.
The Implied Volatility Ratio stands at 20.2%.
Premium:
$1.96
Expire OTM
PAAS-long option
Strike
Odds
Delta
Put
Long
22.00
43.0%
46.9
The maximum risk is $196 and the maximum reward is unlimited. Time decay at the time of purchase was $-0.01 per day.
I entered the position based on a short signal on the Fisher Transform indicator. I anticipate exiting upon receipt of a long signal on the Fisher, or by November 19, whichever comes first.
By Tim Bovee, Portland, Oregon, October 5, 2021
Disclaimer
Tim Bovee, Private Trader tracks the analysis and trades of a private trader for his own accounts. Nothing in this blog constitutes a recommendation to buy or sell stocks, options or any other financial instrument. The only purpose of this blog is to provide education and entertainment.
No trader is ever 100 percent successful in his or her trades. Trading in the stock and option markets is risky and uncertain. Each trader must make trading decisions for his or her own account, and take responsibility for the consequences.
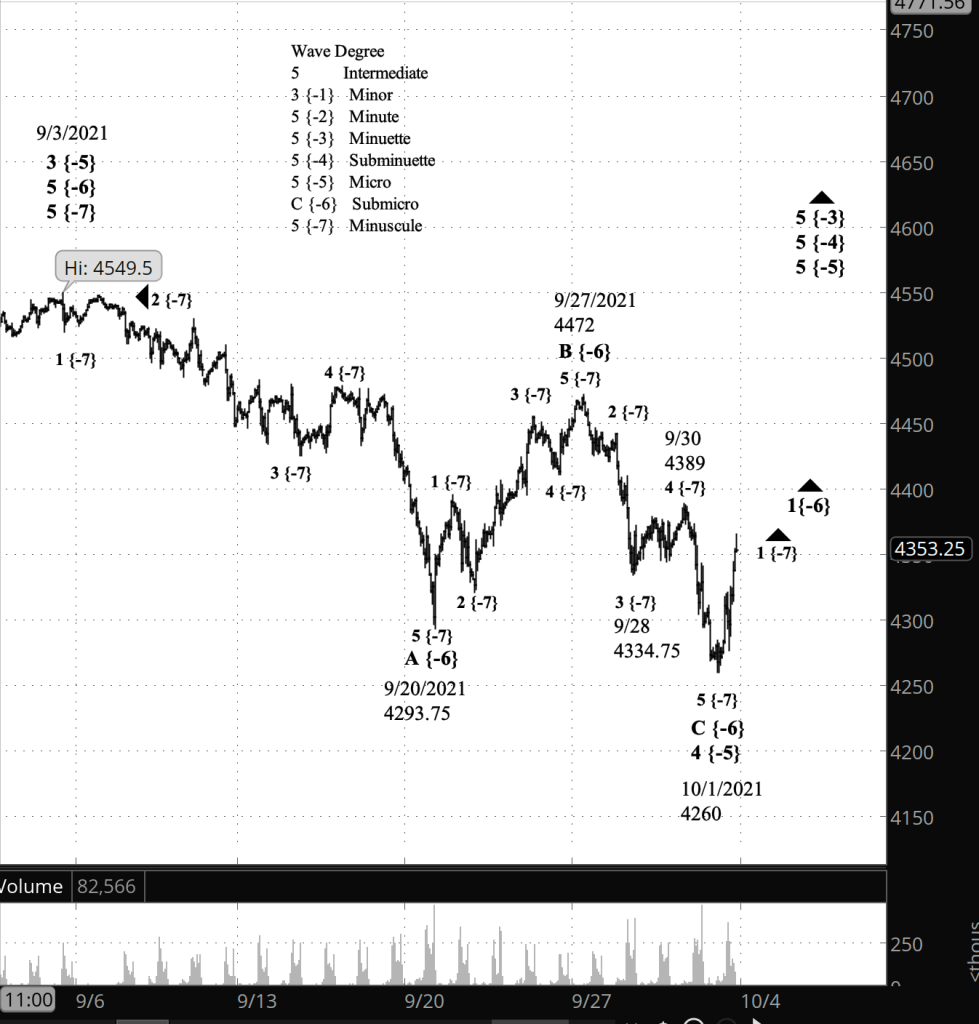
Half an hour before the closing bell. The S&P 500 continued to rise during the day. No change in the analysis. I’ve updated the chart.
1:55 p.m. New York time
Today’s Trades. Long put positions on PAAS and SPCE.
Today is the optimal day for entering short spreads whose options expire on November 19. I couldn’t find anything I liked; the risk-reward ratios were simply way too high. I’ll keep looking. The window for entry will be open through October 12.
9:35 a.m. New York time
What’s happening now? The S&P 500 E-mini futures continued to rise in overnight trading, remaining above yesterday’s low of 4267.50.
What does it mean? The present rise is the third leg within a larger upward trend that began on October 1. It will continue to work its way higher, eventually exceeding the September 3 peak, 4549.50.
What’s the alternative? The rise could be a separator within a compound correction. One corrective pattern is complete, and the separator sets the stage for a second corrective pattern.
[S&P 500 E-mini futures at 3:30 p.m., 70-minute bars, with volume]
What does Elliott wave theory say? The rise that began yesterday from 4267.50 is the 3rd wave within wave 1 of Minuscule degree within the larger wave 1 of Submicro degree. This is all happening within a series of 5th waves, in order of increasing size, of MIcro, Subinuette, Minuette and Minute degrees, which in turn are subwaves of wave 3 of Minor degree, part of a Diagonal Triangle that began in December 2018, forming the 5th wave of Intermediate degree. Minor wave 3 will carry the price to new highs, above the prior peak of 4549.50, set on September 3. The subsequent Minor wave 4 will carry the price to to the lower boundary of the Triangle, which is presently below 2050 and continuing to move lower.
Under the alternative analysis, the present rise is part of wave X of Submicro degree, which separates two corrective patterns within a compound correction, wave 4 of Micro degree. The first corrective pattern, a Zigzag, ended on October 1, having lasted nearly a month. The second pattern, which will begin after wave X, might well last a similar amount of time. When it is done, then we can expect the rise to new highs described in the principle analysis.
The higher the price goes, the more likely the principle analysis is corrective. If the price reverses and falls bellow the October 1 low of 4260, then the alternate scenario becomes the most likely.
Learning and other resources. Elliott wave analysis provides context, not prophecy. As the 20th century semanticist Alfred Korzybski put it in his book Science and Sanity (1933), “The map is not the territory … The only usefulness of a map depends on similarity of structure between the empirical world and the map.” And I would add, we can judge that similarity of structure only after the fact.
See the menu page Analytical Methods for a rundown on where to go for information on Elliott wave analysis.
By Tim Bovee, Portland, Oregon, October 5, 2021
Disclaimer
Tim Bovee, Private Trader tracks the analysis and trades of a private trader for his own accounts. Nothing in this blog constitutes a recommendation to buy or sell stocks, options or any other financial instrument. The only purpose of this blog is to provide education and entertainment.
No trader is ever 100 percent successful in his or her trades. Trading in the stock and option markets is risky and uncertain. Each trader must make trading decisions for his or her own account, and take responsibility for the consequences.
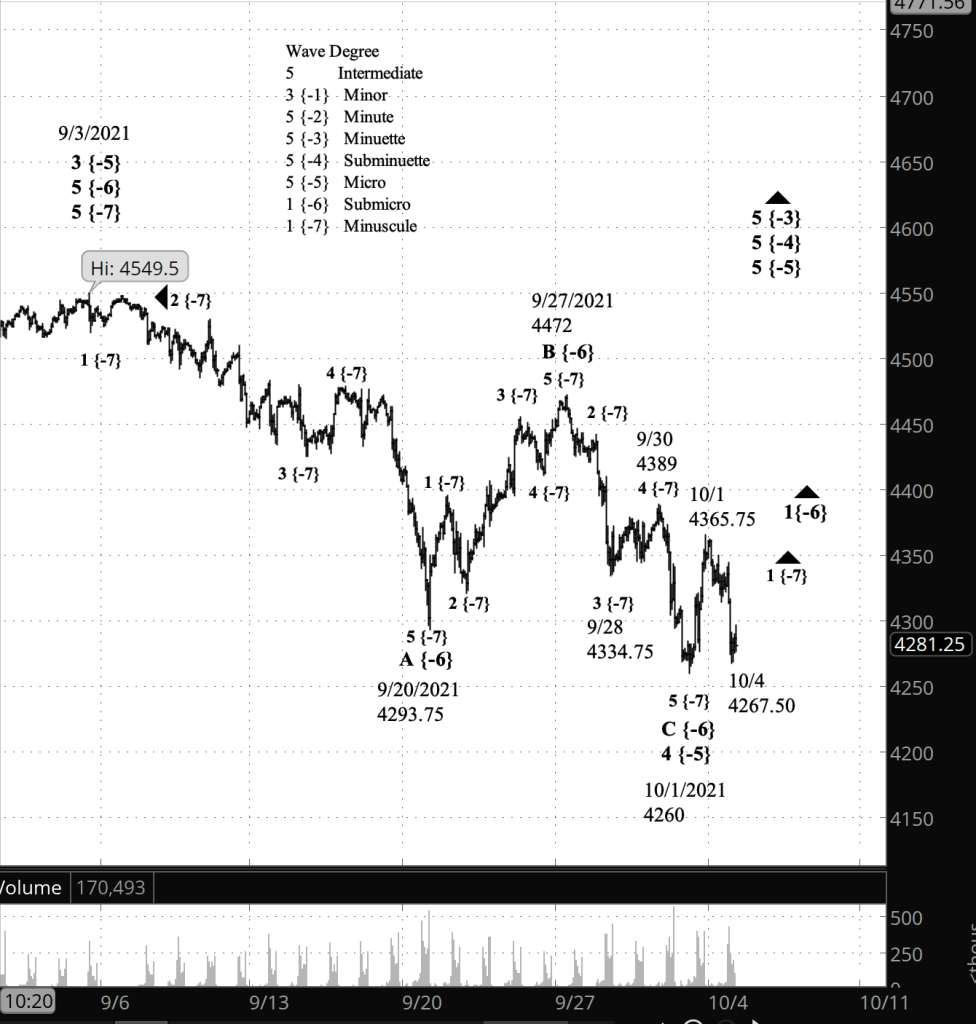
Half an hour before the closing bell. The S&P 500 fell during the trading session, on the futures to within eight points of Friday’s low, and then reversed. No change in the analysis. I’ve updated the chart.
9:35 a.m. New York time
What’s happening now? The S&P 500 declined in overnight trading to about 50 points below Friday’s high, reaching a low of 4315. From that low it rose slightly as the opening bell approached.
What does it mean? The decline appears to be a downward correction within the early portion of a rise that began October 1 and under my principle scenario eventually can be expected to exceed the September 3 high, 4549.50.
What’s the alternative? The rise could prove to be a shorter rise and fall separating two corrective patterns in a compound structure. Under this alternative scenario, the price will begin its rise to new highs, but later than is the case under the principle scenario.
[S&P 500 E-mini futures at 3:30 p.m., hourly bars, with volume]
What does Elliott wave theory say? Under my principle analysis the decline from October 1 is 2nd wave within wave 1 of Minuscule degree within wave 1 of Submicro degree within a series of 5th waves of increasing size, from Micro degree up to Minute degree. All of this is taking place within wave 3 of Minor degree. The completion of Minor wave 3 will be followed by a 4th wave that will carry the price down to the low 2000s or below, to the lower boundary of a Diagonal Triangle that began on December 26, 2018.
The alternative analysis is the same as the principle analysis, except that wave 1 of Minuscule degree, with all of its parent waves, will be delayed by a second corrective pattern. Under this scenario, the rise tat began October 1 is wave X of Submicro degree separating the first corrective pattern within wave 4 of Micro degree, which began on September 3, from a second corrective pattern which could well take a month or so to reach completion. At the end of that second pattern, the principle scenario described above will begin.
Learning and other resources. Elliott wave analysis provides context, not prophecy. As the 20th century semanticist Alfred Korzybski put it in his book Science and Sanity (1933), “The map is not the territory … The only usefulness of a map depends on similarity of structure between the empirical world and the map.” And I would add, we can judge that similarity of structure only after the fact.
See the menu page Analytical Methods for a rundown on where to go for information on Elliott wave analysis.
By Tim Bovee, Portland, Oregon, October 4, 2021
Disclaimer
Tim Bovee, Private Trader tracks the analysis and trades of a private trader for his own accounts. Nothing in this blog constitutes a recommendation to buy or sell stocks, options or any other financial instrument. The only purpose of this blog is to provide education and entertainment.
No trader is ever 100 percent successful in his or her trades. Trading in the stock and option markets is risky and uncertain. Each trader must make trading decisions for his or her own account, and take responsibility for the consequences.
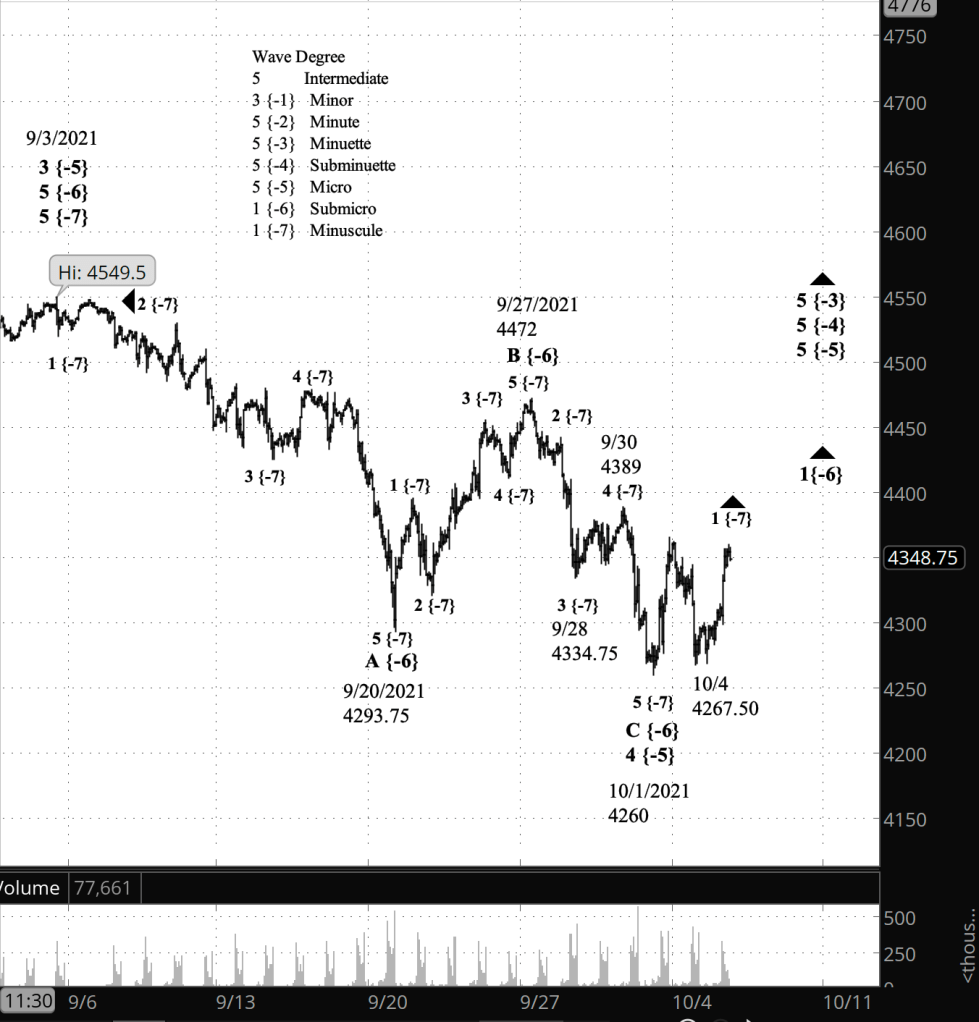
Half an hour before the closing bell. The S&P 500 has continued to rise throughout the session, reaching 4360s on the futures, 4370s on the index, as the closing bell neared. The intensity of the rise gives credence to my principal analysis: That the correction ended overnight and wave 5 of Micro degree is on its way to new highs. I’ve updated the top chart, showing a near-term view.
9:35 a.m. New York time
What’s happening now? The S&P 500 E-mini futures dropped in 4260 in overnight trading and then executed a sharp reversal, moving up 60 points.
What does it mean? By my principal analysis, the correction that began on September 3 ended at the overnight low, and a rise has begun that will eventually exceed that date’s high, 4549.50. This analysis will be disproven if the price reverses and drops back to the 4260 region.
What’s the alternative? If the price rise falls well short of the September 3 high, then the correction is still underway and is taking a compound structure, in which two corrective patterns are connected by an intervening wave. Under this scenario, the rise that began last night is the beginning of that intervening wave.
Charts. The top chart is a near-term chart, tracking the correction that began September 3. The lower chart is a long-term chart, showing the Diagonal Triangle that began in December 2018.
[S&P 500 E-mini futures at 3:30 p.m., hourly bars, with volume]
[S&P 500 index at 9:35 a.m., 2-day bars]
What does Elliott wave theory say? Under the principal analysis, last night’s low marks the end of wave 5 of Micro degree and also of two parent waves of increasingly larger degrees, wave C of Submicro degree, and its parent wave 4 of Micro degree (the correction that began on September 3). The ensuing rise is wave 5 of Micro degree, which will push beyond the September 3 high of 4549.50, perhaps significantly so.
Under the alternative scenario, the rise that began last night is an X wave, connecting two Submicro corrective patterns within wave 4 of Micro degree. The first pattern, now complete, proved to be a Zigzag. The second pattern, after wave X is complete, could be another Zigzag, or a Flat, or perhaps a Triangle of some kind. There is a lot of variety in corrective waves. If the alternative scenario proves to be correct, then the present rise won’t approach the September 3 peak.
Under both scenarios, wave 4 of MIcro degree eventually ends, and the 5th wave that follows will carry the price up to new highs. The end of wave 5 of Micro degree will cascade up the degree ladder, also marking the end of 5th waves of Subminuette, Minuette and Minute degree. One more level up, and it’s the end of wave 3 of Minor degree, which began on February 23, 2020, at the end of the early pandemic crash. The ensuing wave 4 of Minor degree will carry the price down to the lower boundary of an Expanding Triangle that began. The boundary drops lower every day and is presently in the 1980s.
Learning and other resources. Elliott wave analysis provides context, not prophecy. As the 20th century semanticist Alfred Korzybski put it in his book Science and Sanity (1933), “The map is not the territory … The only usefulness of a map depends on similarity of structure between the empirical world and the map.” And I would add, we can judge that similarity of structure only after the fact.
See the menu page Analytical Methods for a rundown on where to go for information on Elliott wave analysis.
By Tim Bovee, Portland, Oregon, October 1, 2021
Disclaimer
Tim Bovee, Private Trader tracks the analysis and trades of a private trader for his own accounts. Nothing in this blog constitutes a recommendation to buy or sell stocks, options or any other financial instrument. The only purpose of this blog is to provide education and entertainment.
No trader is ever 100 percent successful in his or her trades. Trading in the stock and option markets is risky and uncertain. Each trader must make trading decisions for his or her own account, and take responsibility for the consequences.
Update 10/7/2021: I’ve exited my long put position on XLY for a debit of $4.80, a loss of $1.95 per contract/share. Shares were trading at $180.78, down $3.22 from the entry level.
The Implied Volatility Rank at exit was 23.30, down 4.9 points from the entry level.
I exited based on a sell signal from the Fisher Transform indicator.
Shares declined by 1.98% over seven days for a -91% annual rate. The options position produced a 28.9% return for a -1,506% annual rate.
I have entered a long put on XLY, using options that trade for the last time 78 days hence, on December 17. The premium is a $6.75 debit per contract share and the stock at the time of entry was priced at $180.78.
The Implied Volatility Ratio stands at 28.9%.
The position must be managed by October 15, which 63 days before the last trading day.
Premium:
$6.75
Expire OTM
XLY-long option
Strike
Odds
Delta
Put
Long
180.00
49.0%
46
I entered the position based on a buy signal from the Fisher Transform on a daily chart.
By Tim Bovee, Portland, Oregon, September 30, 2021
Disclaimer
Tim Bovee, Private Trader tracks the analysis and trades of a private trader for his own accounts. Nothing in this blog constitutes a recommendation to buy or sell stocks, options or any other financial instrument. The only purpose of this blog is to provide education and entertainment.
No trader is ever 100 percent successful in his or her trades. Trading in the stock and option markets is risky and uncertain. Each trader must make trading decisions for his or her own account, and take responsibility for the consequences.
Update 10/13/2021: I exited my long call position on GLD 21 days before expiration, for a $5.31 credit per contract/share, a profit before fees of $116 per contract. Shares were trading at $167.55, up $3.16 from the entry level.
The Implied Volatility Rank at exit was 14.7%, down 13.2 points from the entry level.
My decision to exit was based on a sharp rise in the chart followed by a pause. In other words, anticipating a correction, I took the moneyand ran.
Shares rise by 1.9% over 13 days for a +54% annual rate. The options position produced a 28.0% return for a +785% annual rate.
I have entered a long call on GLD, using options that trade for the last time 78 days hence, on December 17. The premium is a $4.15 debit per contract share and the stock at the time of entry was priced at $164.39.
The Implied Volatility Ratio stands at 28.9%.
The position must be managed by October 15, which 63 days before the last trading day.
Premium:
$4.15
Expire OTM
GLD-long option
Strike
Odds
Delta
Call
Long
165.00
54.0%
49
I entered the position based on a buy signal from the Fisher Transform on a daily chart.
By Tim Bovee, Portland, Oregon, September 30, 2021
Disclaimer
Tim Bovee, Private Trader tracks the analysis and trades of a private trader for his own accounts. Nothing in this blog constitutes a recommendation to buy or sell stocks, options or any other financial instrument. The only purpose of this blog is to provide education and entertainment.
No trader is ever 100 percent successful in his or her trades. Trading in the stock and option markets is risky and uncertain. Each trader must make trading decisions for his or her own account, and take responsibility for the consequences.
Buying a put or a call is the simplest way to trade options. If you think the price is going up, buy a call. If down, buy a put. None of this long-short-spreads-condors-diagonals-calendars strategic strutures that produce confusion, and yet are so beloved by experienced traders (myself included).
Despite the ease of execution, buying calls and puts is a quick, low overhead way of making trades. It has the added bonus of working best with low implied volatility symbols and so can be attractive trades in those times when there are few high-volatility trades on the table.
With all of that in mind, I’ve spent some time pondering a rule set for long options trades.
Long options are debit trades: The trader hands over the money and gets the contract in return. The profit comes when the trader is able to sell the contract for more than buying price.
One attractive characteristic is that the risk is limited — to the price paid for the contract — and the reward is unlimited.
One unattractive characteristic is that as a long position, it is subject to time decay, or theta in the jargon of options. Theta is a loss of value as the contract approaches expiration. A study I ran across concluded that the rate of time decay begins to increase 60 days before expiration. So that inescapable characteristic is something every long option trader must be mindful of.
The solution to time decay, of course, is to buy options that have more than 60 days until expiration and exit them before time decay grows swifter. That necessity frames all long option trades.
No matter how long until expiration, there is always some time decay. To me, that suggests that the best use of long options is for relatively short-term trades — days or weeks rather than months.
With all of that in mind, here are my trading rules.
Low Risk: Long Options
A long option position should be entered upon an entry signal, no less than 70 days prior to the contract’s last day of trading.
The closer to the last day of trading an option is, the cheaper the option’s price will be.
The option traded should be at the money or slightly out of the money at entry, with a Delta of 50% being the preferred positioning.
The option must be sold upon receipt of an exit signal.
A position must be managed no less than 63 days prior to the contract’s last day of trading.
Management consists of exiting the trade, whether it produces a profit or a loss.
If the stock is expected to continue to moving in a profitable direction for the option, then the position can be reestablished with a later expiration date.
Each trader will have her or his signal for entry and exit. My preference is for technical signals that produce clear buy and sell signals, such as the RSI, the MACD or the Fisher Transform. For my trades I use the Fisher Transform.
And that’s it. Initially I’ll be focusing on exchange-traded funds and will consider branching out later.
By Tim Bovee, Portland, Oregon, September 30, 2021
Disclaimer
Tim Bovee, Private Trader tracks the analysis and trades of a private trader for his own accounts. Nothing in this blog constitutes a recommendation to buy or sell stocks, options or any other financial instrument. The only purpose of this blog is to provide education and entertainment.
No trader is ever 100 percent successful in his or her trades. Trading in the stock and option markets is risky and uncertain. Each trader must make trading decisions for his or her own account, and take responsibility for the consequences.
Half an hour before the closing bell. The S&P 500 E-mini futures peaked at 4389 and reversed in rapid downturn. The peak on the index was 4382.55. The peak ended the 4th wave within wave C of Submicro degree and began the downward movement of a 5th and final wave, whose completion will either end the larger wave 4 of Micro degree correction or begin a second corrective pattern that will extend the correction. I’ve updated the chart.
2:15 p.m. New York time
Another new options position. I’ve entered a long put position on XLY following a sell signal from the Fisher Transform and have posted the analysis.
1:05 p.m. New York time
New options position. I’ve entered a long call position on GLD based on a buy signal from the Fisher Transform and have posted the analysis.
11:45 a.m. New York time
New trading rules. In a break with my usual strategic complexity, I’ve drawn up some trading rules for the simplest of trades: Buying long calls and puts.
9:35 a.m. New York time
What’s happening now? The S&P 500 E-mini futures continued to stairstep upward overnight.
What does it mean? The penultimate leg within the final leg of the downward correction that began September 3 is underway. When the present rise is complete, the price will resume its decline, possibly to new lows, which will be followed by a resumption of the uptrend that began on February 23, 2020, reaching to new highs.
What’s the alternative? When the present corrective pattern is complete, it might be followed by a second corrective pattern, delaying the start of the uptrend.
[S&P 500 E-mini futures at 3:30 p.m., hourly bars, with volume]
What does Elliott wave theory say? The present wave is a rising 4th wave of Minuscule degree within a declining C wave of Submicro degree within a declining wave 4 of Micro degree, which began on September 3. When the 4th wave correction is complete, it will be followed by wave 5 of Micro degree, a continuation of wave 2 of Minor degree, which began in February 2020.
Learning and other resources. Elliott wave analysis provides context, not prophecy. As the 20th century semanticist Alfred Korzybski put it in his book Science and Sanity (1933), “The map is not the territory … The only usefulness of a map depends on similarity of structure between the empirical world and the map.” And I would add, we can judge that similarity of structure only after the fact.
See the menu page Analytical Methods for a rundown on where to go for information on Elliott wave analysis.
By Tim Bovee, Portland, Oregon, September 30, 2021
Disclaimer
Tim Bovee, Private Trader tracks the analysis and trades of a private trader for his own accounts. Nothing in this blog constitutes a recommendation to buy or sell stocks, options or any other financial instrument. The only purpose of this blog is to provide education and entertainment.
No trader is ever 100 percent successful in his or her trades. Trading in the stock and option markets is risky and uncertain. Each trader must make trading decisions for his or her own account, and take responsibility for the consequences.
Half an hour before the closing bell. The S&P 500 traded in a narrow range during the session, remaining below the overnight high of 3878.75. No change from this morning’s analysis, and I’ve updated the chart.
9:45 a.m. New York time
What’s happening now? The S&P 500 E-mini futures rose in overnight trading as the final leg of a larger correction continued its downward course. The price has remained above yesterday’s low of 4334.75.
What does it mean? The end of the final leg will mark the beginning of a rise to new highs, or a shorter rise connecting two corrective patterns.
What’s the alternative? I can’t choose between the two alternatives at this point.
[S&P 500 E-mini futures at 3:30 p.m., hourly bars, with volume]
What does Elliott wave theory say? The overnight rise was wave 4 of Minuscule degree within wave C of Submicro degree with a descending correction, wave 4 of Micro degree. The end of wave C will either mark the end of wave 4, igniting a 5th wave rise above the September 3 high, 4549.50 on the futures. Or wave C will be followed by a small rise, an X wave that will be followed by another corrective pattern.
Earlier in the week there was some ambiguity as to the nature of wave 4: Is it a sideways correction, called a “Flat”, or a directional, called a “Zigzag”. i’ve settled on Zigzag for the following reasons.
Waves A and B of Submicro degree both have five waves internally, at the Minuscule degree. Wave C also appears to be headed for five waves. A Flat pattern internally is three waves within the larger A wave, three within the B and five within the C — often expressed as 3-3-5. A Zigzag pattern internally is 5-3-5.
So what are we to make of the five waves within wave B? The next to the last wave in a correction can take the form of a Triangle, with an undefined number of waves. The internal wave count is often five, but I’ve seen as many as nine. in this case, the five waves within wave B form a Triangle and will be followed by the normal five-wave pattern of wave C within a Zigzag.
Learning and other resources. Elliott wave analysis provides context, not prophecy. As the 20th century semanticist Alfred Korzybski put it in his book Science and Sanity (1933), “The map is not the territory … The only usefulness of a map depends on similarity of structure between the empirical world and the map.” And I would add, we can judge that similarity of structure only after the fact.
See the menu page Analytical Methods for a rundown on where to go for information on Elliott wave analysis.
By Tim Bovee, Portland, Oregon, September 29, 2021
Disclaimer
Tim Bovee, Private Trader tracks the analysis and trades of a private trader for his own accounts. Nothing in this blog constitutes a recommendation to buy or sell stocks, options or any other financial instrument. The only purpose of this blog is to provide education and entertainment.
No trader is ever 100 percent successful in his or her trades. Trading in the stock and option markets is risky and uncertain. Each trader must make trading decisions for his or her own account, and take responsibility for the consequences.
Half an hour before the closing bell. The S&P 500 continued to decline throughout the day, reaching a low so far of 4334.75. The decline was sufficient to suggest that wave B of Submicro degree won’t reach a 90% retracement of the preceding wave A. That being the case, for reasons discussed below, the form of the correction, wave 4 of Micro degree, is a Zigzag, or potentially a Triangle of some sort, rather than a Flat. I’ve changed the labelling on the chart to match a Zigzag scenario.
Under the Zigzag analysis, wave B of Submicro degree ended yesterday at 4472 on the futures, and the subsequent decline, wave C of Submicro degree, has so far fallen to 4334.75, and as a Zigzag is likely to drop below the end of wave A, 4293.75.
The end of wave C in a simple correction will mark the end of wave 4 of Micro degree, which will be followed by the rise of wave 5 of Micro degree to new heights. If the correction takes a compound form, then the of wave C will be followed by a separator wave, which I label as wave X, to the upside, and then a second corrective pattern, perhaps another Zigzag, or perhaps a Flat. Long story short: The S&P 500 is at a crossroad with many possible paths to choose from.
1 p.m. New York time
Options calendar. Today marks the opening of my trading window for using options expiring November 19. The window remains open through October 12, with October 5 being the optimal trading date. See my trading rules for details.
9:35 a.m. New York time
What’s happening now? The S&P 500 E-mini futures fell 84 points from yesterday’s high, 4472, to the overnight low, 4388.
What does it mean? The high is 52 points below a 90% retracement — 4523.93 — of the decline from September 3 to September 20, If the price reverses and reaches the 90% retracement level, then the correction that began September 3 is a sideways, Flat pattern.
What’s the alternative? If the price continues to decline, the correction is taking some other pattern, most likely a direction Zigzag pattern.
[S&P 500 E-mini futures at 3:30 p.m., hourly bars, with volume]
What does Elliott wave theory say? The rise that began September 20 is wave B of Submicro degree, the middle wave within its parent, wave 4 of Micro degree, which began on September 3.
It is wave B that will determine the nature of the correction. In a Flat pattern, the B wave always retraces at least 90% of the preceding A wave. That would mean a rise to 4523.93 in this case. In a Zigzag pattern, the B wave usually will retrace 50% to 79% of wave B, which it has done. So far B has retraced 70% of wave A.
There are other patterns with other B-wave retracements, but Flat and Zigzag are the most common.
Another tendency is for wave 4 to take a different pattern than wave 2. Micro wave 2 in this case was a Zigzag, and so the present wave 4 is likely to be a Flat. “Likely” isn’t a firm rule, so perhaps this will turn out to be an exception.
Learning and other resources. Elliott wave analysis provides context, not prophecy. As the 20th century semanticist Alfred Korzybski put it in his book Science and Sanity (1933), “The map is not the territory … The only usefulness of a map depends on similarity of structure between the empirical world and the map.” And I would add, we can judge that similarity of structure only after the fact.
See the menu page Analytical Methods for a rundown on where to go for information on Elliott wave analysis.
By Tim Bovee, Portland, Oregon, September 28, 2021
Disclaimer
Tim Bovee, Private Trader tracks the analysis and trades of a private trader for his own accounts. Nothing in this blog constitutes a recommendation to buy or sell stocks, options or any other financial instrument. The only purpose of this blog is to provide education and entertainment.
No trader is ever 100 percent successful in his or her trades. Trading in the stock and option markets is risky and uncertain. Each trader must make trading decisions for his or her own account, and take responsibility for the consequences.


You must be logged in to post a comment.