The Week Ahead: Productivity, retail, industry, housing

Productivity

Productivity, 1988-2017

The always important question of productivity takes center stage this week, along with the retail, housing and industrial sectors.

The quarterly productivity and costs report will be published Wednesday at 8:30 a.m. New York time. As the chart above shows, productivity peaked in 2002, hit a lower high in 2011, and thereafter fell into a narrow range in the cellar. Economists consider productivity to be the source of growth.

The chart of productivity below shows just how dramatic the long-term change has been. We are back in the 1970s, and traders of a certain age know all too well what that meant back in the day: Massive job losses, the dismantling of the American industrial sector, stagflation. Not a happy chart.

productivity1947

So economists for sure and many traders as well will be paying attention when the report is released.

The sector reports will be concentrated on Wednesday and Thursay.

Expect retail sales on Wednesday at 8:30 a.m., concurrently with productivity, and industrial production 45 minutes later at 9:15 a.m. Housing starts will be published on Thursday at 8:30 a.m.

Read More »

Live: Friday, Aug. 10, 2018

10:30 a.m. New York time

SPY has peaked and this morning began its next Elliott wave down. I count it as a B wave with an ongoing correction. It could rather be a 3rd wave down. As the movement progresses I’ll adjust my count as needed.

The SPY chart covers 10 days using 5-minute bars.

spy20180810

My position on SPY expires at the end of next week. My intent is to hold on until perhaps as late as Wednesday, and then exit. On Monday, when I have more verification that this is indeed the beginning of the downward wave, then I shall consider when I should entered the next position with a later expiration.

By Tim Bovee, Portland, Oregon, Aug. 10, 2018

Read More »

Live: Thursday, Aug. 9, 2018

9:40 a.m. New York time

SPY has for a third day begun trading in a very narrow range. A traditional chartist would look at SPY, nod sagely, and mutter, “Topping behavior.”

The position expires Aug. 17. I’m going to give it a bit more time in the hope that the topping will turn into a price collapse and return my position to profitability.

The SPY chart covers one month with daily bars. The subchart is the Fisher Transform Trend, which produces a binary true (high) or false signal on Fisher crosses.

spy20180809

By Tim Bovee, Portland, Oregon, Aug. 9, 2018

Read More »

Live: Wednesday, Aug. 8, 2018

11:25 a.m. New York time

SPY pulled back from a high yesterday that could mark a significant turning point int the Elliott wave analysis, but not necessarily. I shall be waiting for the market to work out its path and anticipate no trades.

Yesterday afternoon, for the enjoyment of doing the analysis, I took a look at TSLA, running a long-term Elliott wave chart that suggested that the price was moving as expected, not being pushed into a surprising direction by Tesla CEO Elon Musk’s tweet saying he hopes to take the company private..

This morning in Seeking Alpha, I ran across a smart analysis of the business and regulatory realities of privatizing Tesla: “Tesla: Separating Fact From Fiction“. It’s a good read.

By Tim Bovee, Portland, Oregon, Aug. 8, 2018

Read More »

TSLA Analysis – Just for fun

Today’s market shock after Tesla CEO Elon Musk tweeted that he was considering taking TSLA private illustrated an important point about Elliott wave analysis: The analytical technique operates independently of items in the news, and yet traders mob response to news often confirms the analysis found through Elliott.

So it was with TSLA. For background, here’s an article from Reuters on Musk’s tweet.

The TSLA chart below is the broadest possible, beginning in 2010, when the company went public, and ending with today’s impactful tweet. The chart uses weekly bars.

tsla20180808

In counting the Elliott waves, I’ve made no attempt to relate the degrees of each wave to the broader market. The numbering scheme is relative; the numbers without modifiers are the highest degree counted, and the ones with {-1} after the number are one degree down.

My count shows that TSLA had begun to edge up from a low several days prior to the tweet. The response to the tweet confirmed that an upward wave was underway.

It’s a 5th wave at the lower degree with a greater 3rd wave, so it should have some serious legs, although a movement above the September 2016 high of 389.61 is all that is required to satisfy Elliott’s definition of a 5th wave in these cirumstances.

However far it goes, once the 5th wave and its parent 3rd wave are complete, TSLA will be set for a significant decline spanning several years.

If Musk takes the company private, of course, then Elliott has nothing more to say. The analysis requires a liquid market — the more liquid the better — because it relies on social mood. When the market is illiquid, then social mood becomes unreadable.

Musk has said that he intends to find a way so that even after going private, he wants shareholders to be able to continue to have a stake in the company. Whether that options would include a private market of some sort, and whether that pricing would be publicly available, I can’t even guess.

I have no intention of buying into TSLA. I’m not a long-term trader, so Mr. Musk and his investors will sail off to the future, of electric cars, high-speed underground railroads and a colony on Mars, without me on board. Bon voyage, mes chers amis. Bon voyage.

By Tim Bovee, Portland, Oregon, Aug. 7, 2018

Read More »

Live: Tuesday, Aug. 7, 2018

10:35 a.m. New York time

By my  Elliott wave count, we’re at a turning point in the counter-trend rise that began April 2.

In the chart below, I focus on the final wave, a 5th wave of the Minuscule degree {-4}, and it’s internal waves, at a level so small it lacks a name. Let’s agree to call it the “Tiny”. By my count, SPY is in the 5th wave of the Tiny degree {-5}.

The chart covers Aug. 1 to the present, with 5-minute bars.

spy20180807

By “turning point” I mean that the first leg of the counter trend correction, the A wave of Submicro degree {-3} is nearing completion, to be followed by a downward B wave, which often has three waves internally, and then a C wave to the upside that will complete the 2nd wave of Micro degree.

The proper identification of degrees is always a matter of ambiguity in Elliott. But for my purposes what counts is the relationship among the waves — how far along as the price movement progressed. In that latter respect Elliott wave analysis can be made with great confidence.

My present position expires Aug. 17. It is loss-making at this point. Given how far advanced the A wave is, the rational choice is to delay until the last possible moment before getting out.

Or as the Earth-child raised by Martians, Valentine Michael Smith, put it in Robert A. Heinlein’s 1961 masterwork Stranger in a Strange Land, “Waiting is.”

By Tim Bovee, Portland, Oregon, Aug. 7, 2018

Read More »

Live: Monday, Aug. 6, 2018

9:50 a.m. New York time

SPY is trading within yesterday’s range. I have no changes to my analysis, and anticipate no trades today. My options positions on SPY expire on Aug. 17, eleven days hence, so I need to be picking an exit point.

By Tim Bovee, Portland, Oregon, Aug. 6, 2018

Read More »

Live: Thursday, Aug. 2, 2018

11:20 a.m. New York time

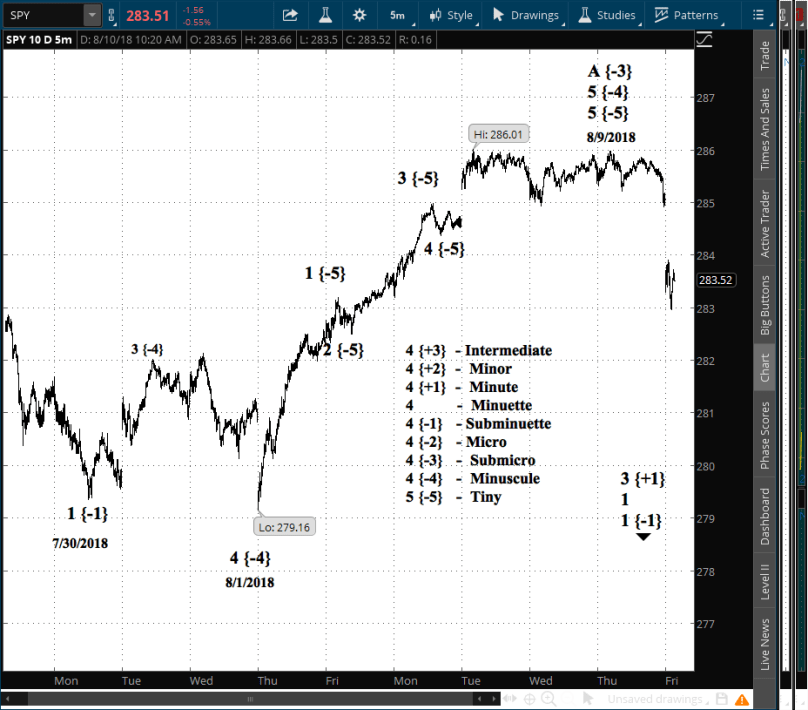
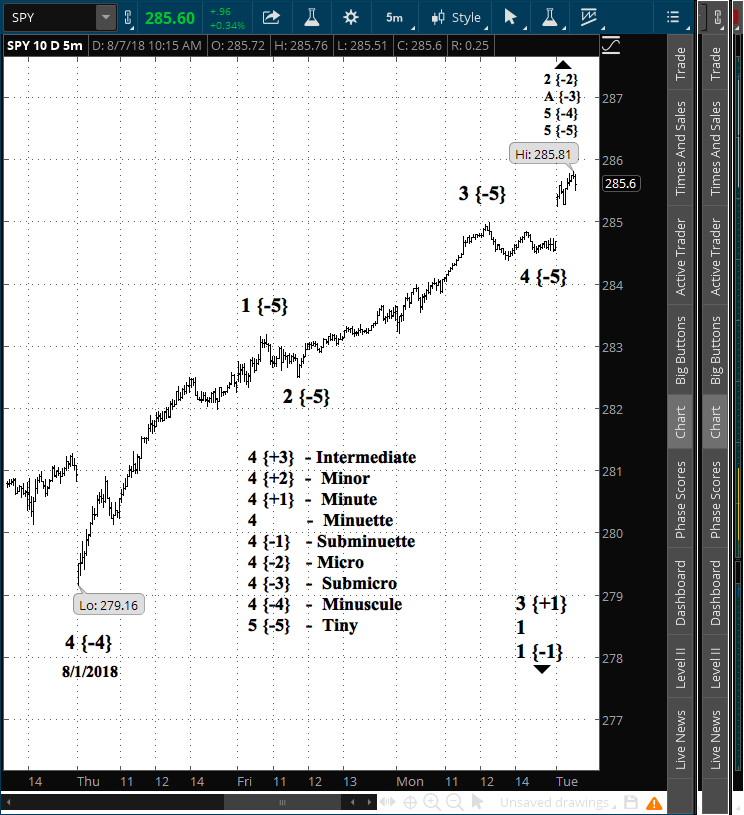
SPY declined in early trading to a new low in its downward march since July 25, and then rose back into the prior day’s range. My Elliott wave analysis shown in the most recent chart continues to be valid.

Long-time readers will have noticed that my pace of trading has slowed considerably this year. Blame the bear market that began Jan. 26.

Most of my trading before this year was in the form of earnings plays: Selling options positions before the earnings announcement, at high implied volatility, and then buying them back after the announcement, when volatility had fallen.

That works if I can have a theory of how the price will respond to the announcement. In an optimistic time, during a full bull market, or during a pessimistic time, during a full bear market, that assessment is fairly easy to make. There’s a lot of clarity.

But half a year into this bear market, public mood is still in the transition phase. It is deteriorating in many areas — the political mood is as dark as any I’ve seen since the 1970s — but the hopefulness of the post recession bull market continues to hold a degree of sway.

Under such circumstances, reactions to an earnings announcement can be outsized and shocking large.

The FB chart covers 10 days with 5-minute bars.

fb20180802

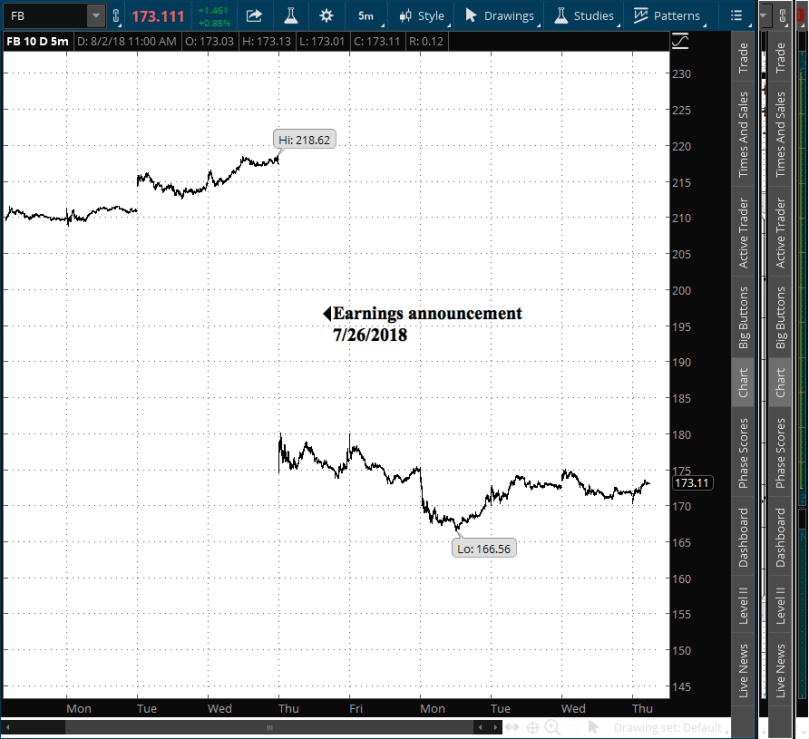
FB and TWTR’s similar fall confirmed my earlier assessment that earnings plays weren’t a smart move at this point in the market.

So my trading has dropped off, and I have uninvested funds. What do I do with those?

Uninvested funds present three problems: They aren’t earnings trading profits, they’re eroded constantly by inflation, and they present a temptation for spending on consumer goods.

To avoid those problems, I turn to the U.S. Treasury, and in particular, the TreasuryDirect website, which is agency’s vehicle that allows people and businesses to buy government bonds.

It has two advantages: There are no transactions fees or commissions, and it is granular with wide limits, allowing purchases at auctions of as little as $100 or as large as $5 million per auction.

My chosen vehicle is 13-week Treasury bills, which are paying 2.2% annualized. That beats the inflation measure used by the Federal Open Market Committee in its analysis, the Personal Consumer Expenditures (PCE) deflator, which stands at 1.9%, and also the expectation of future inflation implied by the 10-year Treasury bond rates, which is 2.13%

As many do, I’ve structured my holdings as a tree, with a portion of the bills maturing each week, for withdrawal or reinvestment.

It’s not as profitable or exciting as earnings plays, to be sure, but it’s a calm port for shelter during our early bear market storm.

By Tim Bovee, Portland, Oregon, Aug. 2, 2018

Read More »