11::10 a.m. New York time
I have re-worked my Elliott Wave analysis of the SPY chart to take of the issue that arose a couple of days ago, as described in the Live post of Aug. 21.
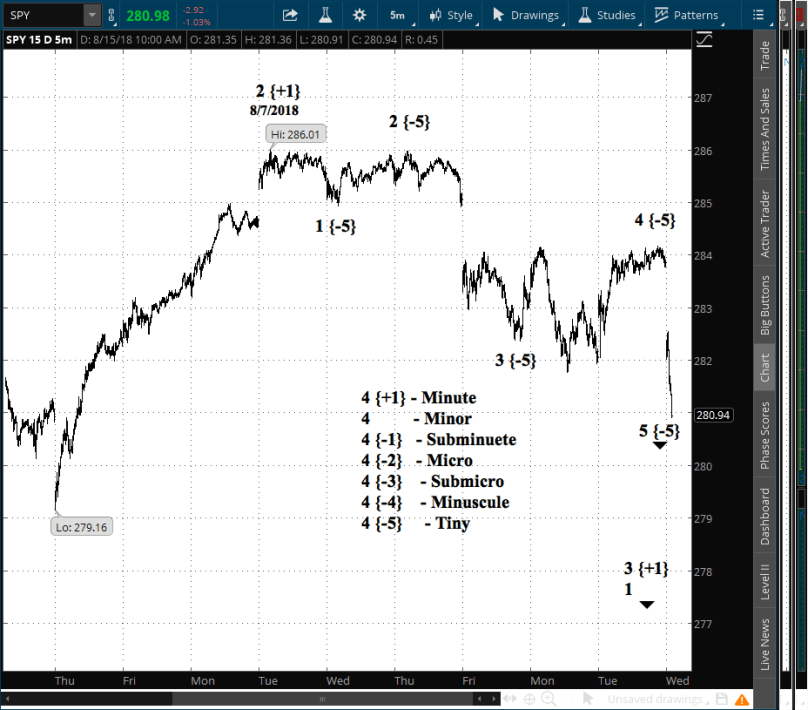
The SPY chart below covers one year with daily bars.
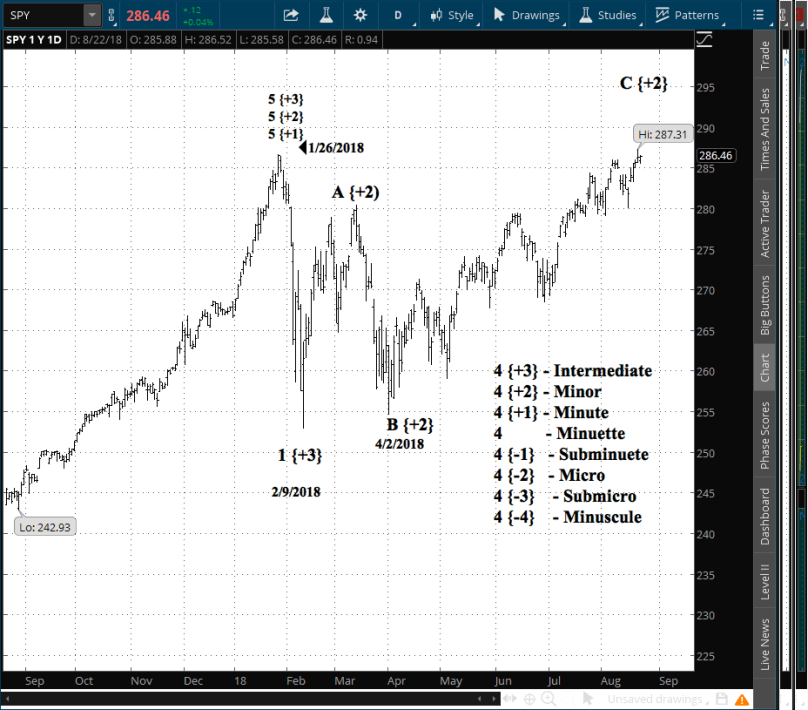
The difficulty came because I had counted the corrected since the bear market began on Jan. 26 as being a Zig-Zag — a directional correction with a 5-wave, 3-wave, 5-wave pattern. As it turns out out, the correction now analyzes as a Flat — a sieways correction — with a 3-wave, 3-wave, 5-wave pattern.
In my experience 2nd wave corrections, like this one, tend to be Zig-Zags. But it’s not a rule, and this one is marching to the beat of its own drummer.
Even so, my conclusion that the C wave is near an end remains intact. Also, my decision to exit yesterday is supported by the new wave count; the C wave may be nearing an end, but it could still have a good distance to go.
Or not. There’s no way to say.
I anticipate no trades today.
By Tim Bovee, Portland, Oregon, Aug. 22, 2018
 Economically significant? Sometimes. Often of interest? Sure. Who doesn’t take notice when the powerful gather to celebrate their power. And to exchange ideas. And maybe, to learn. Or to mislearn.

You must be logged in to post a comment.