Live: Tuesday, Sept. 4, 2018

3:20 p.m. New York time

I had no need to trade today. As we near the closing bell, SPY is trading within Friday’s range.

Over the summer my trading dropped off, primarily because of uncertainty over where we stood within the new bear market. I’m feeling comfortable enough with our new era to attempt a greater volume of trading.

My plan is this: I’m looking for stock options, as opposed to ETF options, because stock options tend to have higher implied volatility, which increases my profits.

Because of the directional uncertainties at this point in the Elliott wave progression, I shall focus on short iron condors, which limit losses both when the underlying rises past a point and when it falls past a point.

I’ll be looking for stocks that have high relative implied volatility and that are rising. To measure relative IV, I shall use the IV Rank metric developed by Tom Sosnoff‘s team at TastyTrade.

Tom had the vision of democratizing access to professional-grade options trading tools and oversaw the development of ThinkOrSwim, the best options platform there is and the platform that I use for my trading. He eventually sold ThinkOrSwim to TDAmeritrade, which manages it to this day.

I urge anyone who hasn’t checked out his current venture, the options education platform TastyTrade, to do so, and to get on the email lists immediately. His team, personified by “Dr. Data’, provides reams of useful information about individual stocks and funds. The IV Rank metric I’ll be using in my trading is part of that data.

All absolutely free. Great tools for options traders. (This is not an advertisement, by the way, but a heartfelt homage to a vision and tools that have had a huge impact on my trading.)

He also runs the brokerage TastyWorks, which I haven’t check out yet, but I plan to, quite soon.

7:20 a.m. New York time

With Labor Day behind us, the markets set summer’s quirkiness aside and begins the serious business of August.

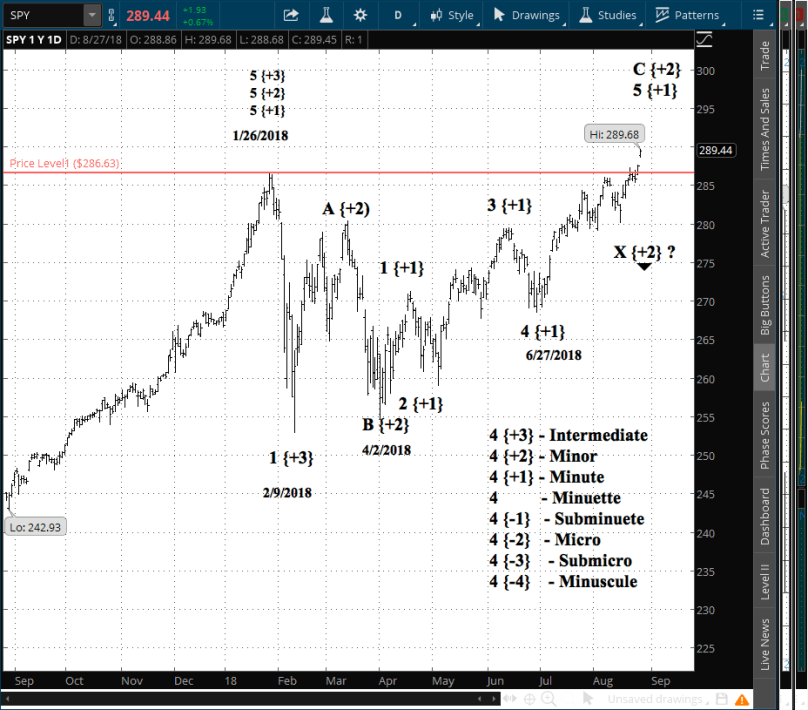
September, it is said, typically is a down month. That would certain match where the S&P 500 — in the form of its exchange-traded fund SPY — has positioned itself. I posted a longer-term chart on Aug. 27, suggesting in my discussion that it showed a peak was near, to be followed by a substantial decline.

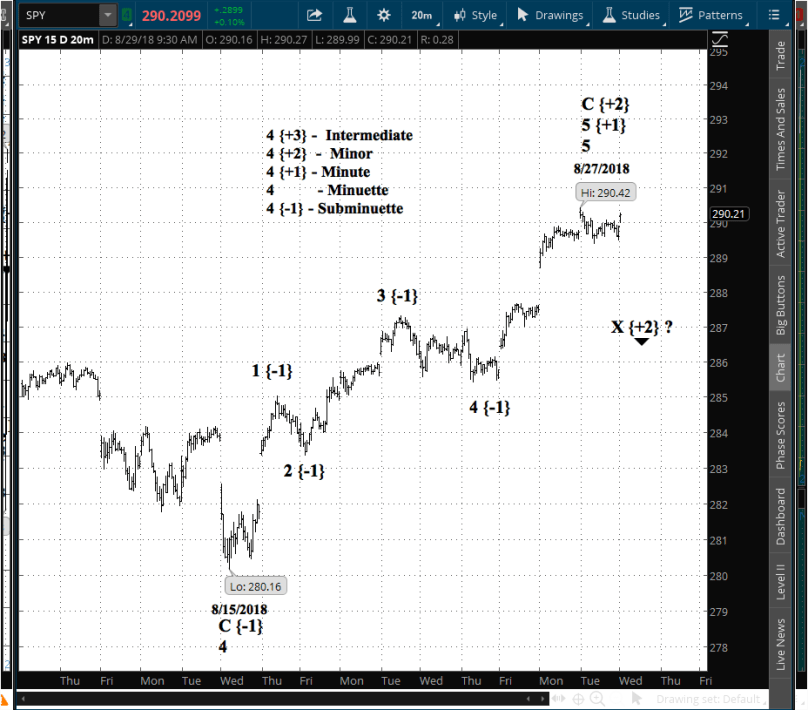
Today’s shorter-term chart, covering 15 days with 20-minute bars, confirms that that finding.

spy20180904

My Elliott wave analysis suggests that it is an X wave of the Minor degree {+2}, combing two corrective patterns. X waves tend to be zig-zags, and I would anticipate that it would reach completion above the start of prior corrective pattern in the series, in this case a zig-zag that began Feb. 9 at $252.92, which is 15% below the Aug. 29 end of that pattern at $291.74.

By Tim Bovee, Portland, Oregon, Sept. 4, 2018

Read More »

The Week Ahead: Jobs, manufacturing, global trade

riverrouge

With Monday’s Labor Day holiday behind us in the United States, the markets move from summer holidays to the serious business of autumn: Divining the minds on the Federal Open Market Committee by analyzing the strength of the economy.

As is often the case in finance, the question comes down to one of simple math: How quickly with the Fed raise interest rates? And will it be faster than before or slower?

A key measure of the economy’s strength, the employment situation report, will be published on Friday at 8:30 a.m. New York time. The trailing indicator will get a sneak preview on Thursday in the form of the ADP employment report, issued at 8:15 a.m. by a private payroll management company.

Other heavily watched reports out during the week: The Institute of Supply Management manufacturing index on Tuesday at 10 a.m. and international trade on Thursday at 8:30 a.m.

Read More »

Live: Friday, Aug. 31, 2018

10:35 a.m. New York time

SPY continues to trade within a narrow range since coming off the high of Aug. 29. It’s a holding pattern, perhaps in anticipation of the coming three-day weekend. U.S. markets will be closed Monday for Labor Day, marking the emotional end of summer, if not the astronomical end.

I shall post The Week Ahead on Saturday as usual.

By Tim Bovee, Portland, Oregon, Aug. 31, 2018

Read More »

Live: Wednesday, Aug. 29, 2018

9:50 a.m. New York time

I’ve brought my  Elliott wave analysis down to a shorter-term level in an attempt to judge how far the present rise has progressed. There are often ambiguities in a wave count, so this is one of several ways of assessing the rise. It shows that wave C in the Minor degree {+2} was completed on Aug. 27 by wave 5 of the Minute degree {+1}, or nearly so.

It’s also possible to count the peak I have labelled 3 {-1} as 1 {-1}, in the Subminuette degree. If that turns out to be the case, then what I have labelled as wave 5 of the Minuette degree is in fact wave 3 of that degree, and the C wave of the Minor degree {+2} still has a ways to go.

In either case, I see no opportunity to trade back in to SPY today, and so I shall wait for the ambiguities to resolve themselves. That will take a decline off of the Aug. 27 peak, perhaps a sharp one with a gap to signal that the trend has changed.

spy20180829

By Tim Bovee, Portland, Oregon, Aug. 29, 2018

Read More »

Live: Monday, Aug. 27, 2018

11:35 a.m. New York time

SPY broke above the peak of the bull market, which ended on Jan. 26 — an event that intuitively is filled with paradox. The damage to my Elliott wave analysis, however, is far less than might be imaged.

The SPY chart covers the past year with daily bars.

spy20180827

The paradox is how can a price within a bear market be higher than the start of the bear market. A bear market peak means the highest point, and there is no higher than highest.

Except in Elliott, where the form of things always takes precedence over our intuition. Here’s how I see it:

All is fine with the chart from the Minor degree {+3} on down. It is at the Intermediate degree {+3+} where the potential rule violation has occurred.

The peak of the present counter-trend corrective wave would be the 2nd wave of Minor degree {+3}. Elliott has a firm rule that a 2nd wave cannot move beyond the start of the 1st wave of the same degree. Full stop. No appeal. That’s the rule.

So that peak cannot be the end of the 2nd wave Minor degree correction to the upside, to be followed by a 1st wave down of Minor degree {+2} as the first wave of the 3rd wave down of Intermediate degree {+3}. That disallowed count is the most straightforward in my mind, but the markets are often less than straightforward in their course.

The alternative is to label the next wave down, once the Minor C wave is complete, as the 1st wave of Minute degree {+1} within an X wave of Minor degree {+2}.

I referred to that possibility in my analysis of Aug. 23 (although the degree labeling has since changed).

So, bottom line: My bear market analysis remains intact. The coming X wave may be tradable. Although not the beginning of a 3rd wave down, which would certainly carry to significant bear-market lows, it is of a sufficiently high degree to produce a decline that fits in with my goal of trades having lifespans of 30 days to 45 days.

By Tim Bovee, Portland, Oregon, Aug. 27, 2018

Read More »

The Week Ahead: GDP, trade, income, outlays

gdp

Traders get a second look at 2nd quarter gross domestic product on Wednesday at 8:30 a.m. New York time. Perhaps of greater importance in this era of Fed tightening of available credit, the report will include the GDP price index, a deflator used in the reporting that the Federal Open Market Committee uses in preference to the more widely known Consumer price index.

As go prices, so goes the Fed, as goes the Fed, so goes the economy, your job, your paycheck and your family’s ability to eat out this Friday and take a great vacation next summer. High stakes indeed.

Also out during the week, international trade in goods on Tuesday and personal income and outlays on Thursday, each at 8:30 a.m.

Read More »

Live: Thursday, Aug. 23, 2018

cliffhanger

11:05 a.m. New York time

Chart analysis is much like the old-time serial films they used to show in movie theaters, where each episode ended with a cliff-hanger, and the kids had to shell out their nickels again to see what happened.

Having revised my longer-term Elliott Wave analysis of the SPY chart from the Jan. 26 beginning of the bear market, I took a deeper dive into components of the uptrending 4th wave of Minute degree {+1}, which began June 27.

The SPY chart covers 90 days with hourly bars.

spy20180823

The interesting part is the leg up beginning Aug. 15, a movement that has much ambiguity. A straightforward count shows the C wave down of the Subminuette degree {-1} ended on Aug. 15.

If that wraps up the countertrend correction then that is also the end of the 4th wave and we are now pushing upward on the 5th and final wave of the C wave of Minute degree that began in April. (See the chart posted yesterday.)

However, the subsequent upward move could also prove to be the separating wave of a complex correction, with several zig-zags or flats or other corrective patterns linked to together. In Elliott, the separating waves are labeled X, and in this case it would be an X wave of Subminuette degree.

If the upward move from Aug. 15 is a 5th wave, then it will mean continued upward movement to a greater or lesser extent, followed by a significant down move, wave 3 of the Intermediate degree {+3}.

If the upward move is an X wave, then it has likely completed most its rise, and what follows will be a downward move, but not a major one, with a lower boundary on SPY in the $270s or so.

Bottom line: We don’t know which it will be. It’s a cliffhanger. We’ll need to pony up our nickels to see the next episode.

By Tim Bovee, Portland, Oregon, Aug. 23, 2018

Read More »