10:20 a.m. New York time
And the week ends, or so it seams in morning trading, not with a bang but a whimper. SPY is trading this morning in yesterday’s range. I foresee no trades.
By Tim Bovee, Portland, Oregon, July 20, 2018
10:20 a.m. New York time
And the week ends, or so it seams in morning trading, not with a bang but a whimper. SPY is trading this morning in yesterday’s range. I foresee no trades.
By Tim Bovee, Portland, Oregon, July 20, 2018
10:55 a.m. New York time
SPY is trading this morning slightly below yesterday’s range. The chart analysis posted yesterday remains valid. I anticipate no trades today.
By Tim Bovee, Portland, Oregon, July 19, 2018
10:05 a.m. New York time
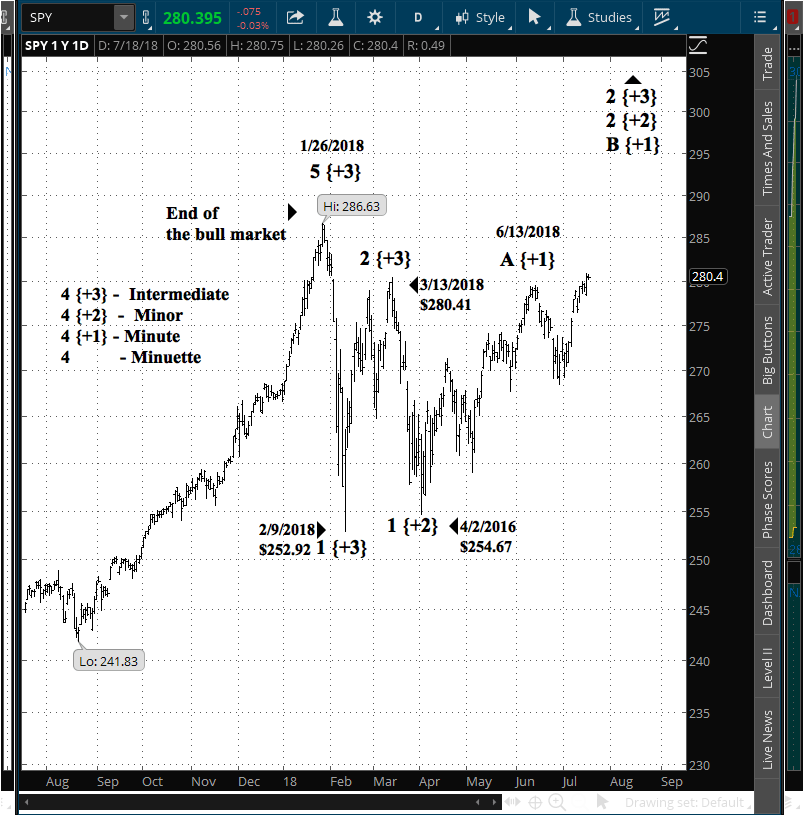
I’ve updated my longer-term charts for SPY, which tracks the S&P 500, and ARKG, a fund tracking the genetics sector which I am presently out of but would like to re-enter.
SPY continues an upward counter-trend correction, which I’ve labeled as a 2nd wave of the Intermediate degree in Elliott wave analysis. Within that wave it is presently tracing out a B wave of Minute degree.
The position expires in mid-August, so the trick will be to pick a low moment within the B wave to exit. The 2nd wave is contrary to my bear position.
The SPY chart covers one year with daily bars.
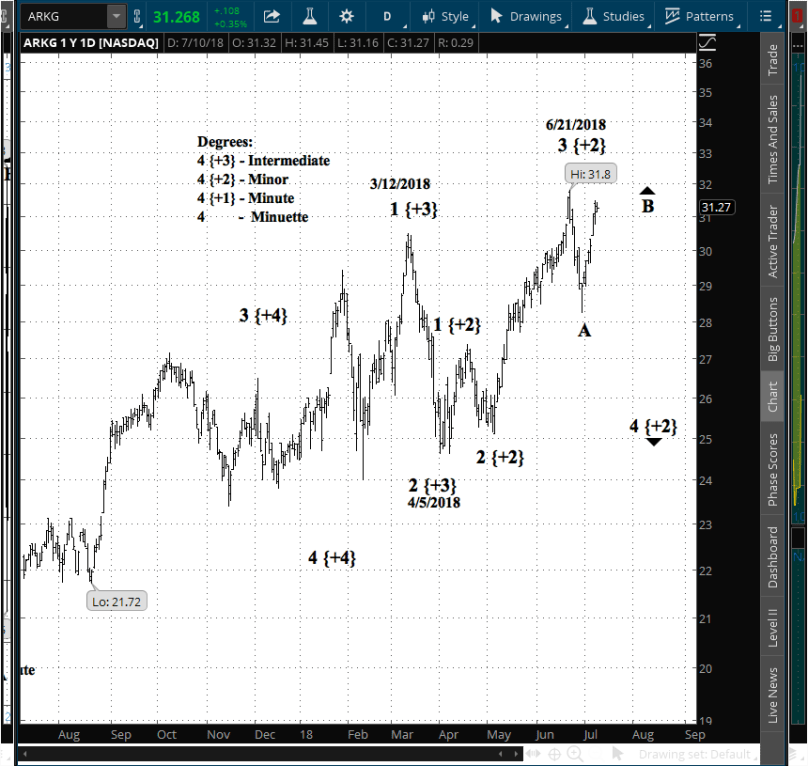
My count for ARKG remains bullish at the higher degrees, showing that the quickly innovating genetics sector is operating differently from the more established blue chips. Nevertheless, I see ARKG as being in a downward counter-trend correction, and I won’t re-enter my shares position until that correction is complete.
The ARKG chart covers a year using daily bars.

By Tim Bovee, Portland, Oregon, July 18, 2018
11:35 a.m. New York time
SPY continues its sideways course at what I count as the peak of a C wave of the Minuette degree that may mark the end of the 2nd wave one degree higher, at the Minute degree. I anticipate no trades today.
By Tim Bovee, Portland, Oregon, July 17, 2018
9:55 a.m. New York time
SPY is trading this morning within Friday’s range and requires no action.
By Tim Bovee, Portland, Oregon, July 16, 2018

The Federal Reserve takes center stage this week, as Fed Chairman Jerome Powell testifies on the state of monetary policy before the Senate Banking, Housing and Urban Affairs Committee on Tuesday and the House Financial Services Committee, each at 10 a.m. New York time. It will be his second semiannual report to Congress.
We live in an age flooded with information about monetary policy. Far gone are the days when analysts speculated on the likelihoods of Federal Open Market Committee action based on how fatly the chairman at the time, Alan Greenspan, had packed his briefcase.
So the semiannual report is valuable in providing a big picture view of the forces that go into regulators’ thinking, but is a smaller piece of the speculative puzzle than it once was.
Even so, the semiannual report, combined with the Fed Beige Book, a narrative overview of conditions in each of the Fed’s 12 districts, provides the most extensive overview of Fed thinking on the economy. The Fed Beige Book will be published on Wednesday at 2 p.m.
Two other major reports will pique trader interest during the week: Housing starts on Wednesday and retail sales on Monday, each at 8:30 a.m.
And there’s another event from Fedworld: Fed Vice chairman Randal Quarles will give introductory remarks, via pre-recorded video, at the Alternative Reference Rates Committee Roundtable of the New York Federal Reserve Bank, on Wednesday at 9 a.m. The Roundtable meeting will be streamed here.
11:15 a.m. New York time
SPY remains within yesterday’s range, and the analysis I posted then is unchanged. The ambiguities I noted on the chart have yet to be resolved. Waiting is.
By Tim Bovee, Portland, Oregon, July 13, 2018
3:15 p.m. New York time
Why Elliott wave analysis is an art not a science.
SPY today exceeded its high of July 10, which means that the 2nd-wave countertrend correction did not in fact end on July 10, may have ended today, but maybe not. That interpretation will await further developments.
I’ve been working with Elliott wave analysis for more than 30 years, and reading the best in the game for that period of time. The shifts in interpretation that we saw today are commonplace.
Elliott wave analysis is not in any way a sure path to perfect market decisions, no more than any other way of assessing the market. What Elliott does is provide an ongoing context — a narrative — about the path the market has taken and what the next steps will be. As for the timing of those steps — it’s not always clear. Most reversals have a large degree of ambiguity that will be resolved over time.
So what I can say with certainty is that once the 2nd wave correction upside is complete, it will be followed by a 3rd wave down of the same Minute degree. Also, the count within the Minute wave suggests that it is near completion, so the reversal will come soon.
10 a.m. New York time
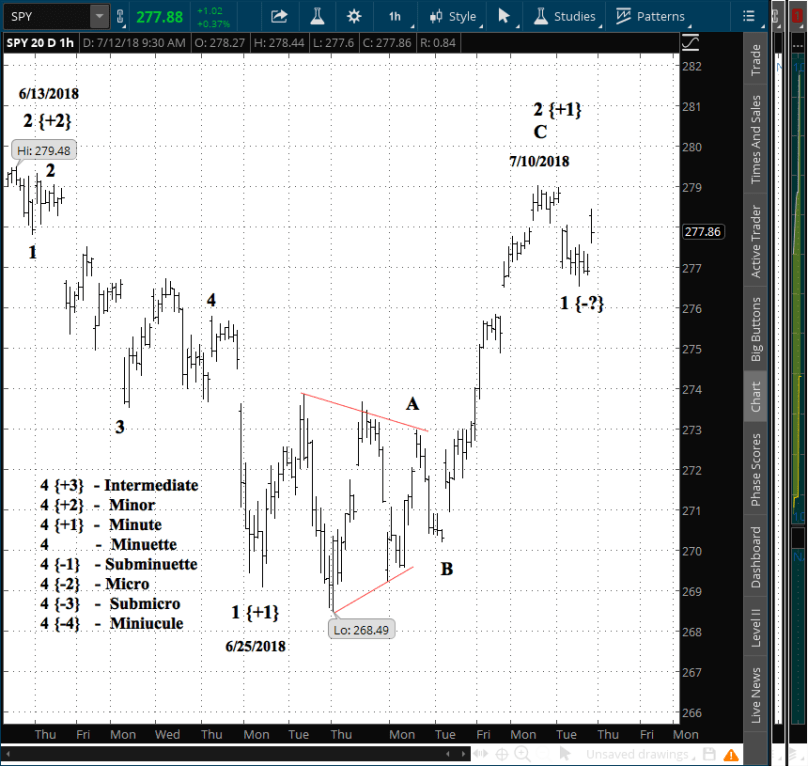
From Elliott wave analysis of SPY, I conclude that the 2nd wave counter-trend correction in the Minute degree {+1} to the upside that began on June 25 ended on July 10.
The Minuette 3rd wave to the downside has begun. It is part of a 3rd wave down in the Minor {+2} degree. The movement has traced a 1st wave down in a lower degree — Subminuette {-1} or Micro {-2}.
All of this is part of the working through of a major bear market that began on Jan. 26.
I plan no trades today, but I anticipate that any trade I make for quite some time to come will be bearish in its expectations.
The SPY chart covers 20 days with one-hour bars.
By Tim Bovee, Portland, Oregon, July 12, 2018
10 a.m. New York time
SPY remains within the parameters of yesterday’s chart analysis. I anticipate no trades today.
By Tim Bovee, Portland, Oregon, July 11, 2018
10:15 a.m. New York time
I have exited ARKG for a small profit and shall update the entry analysis with results within the next half hour.
10 a.m. New York time
I’ve reworked the charts for both of my positions, and neither requires adjustments at this point.
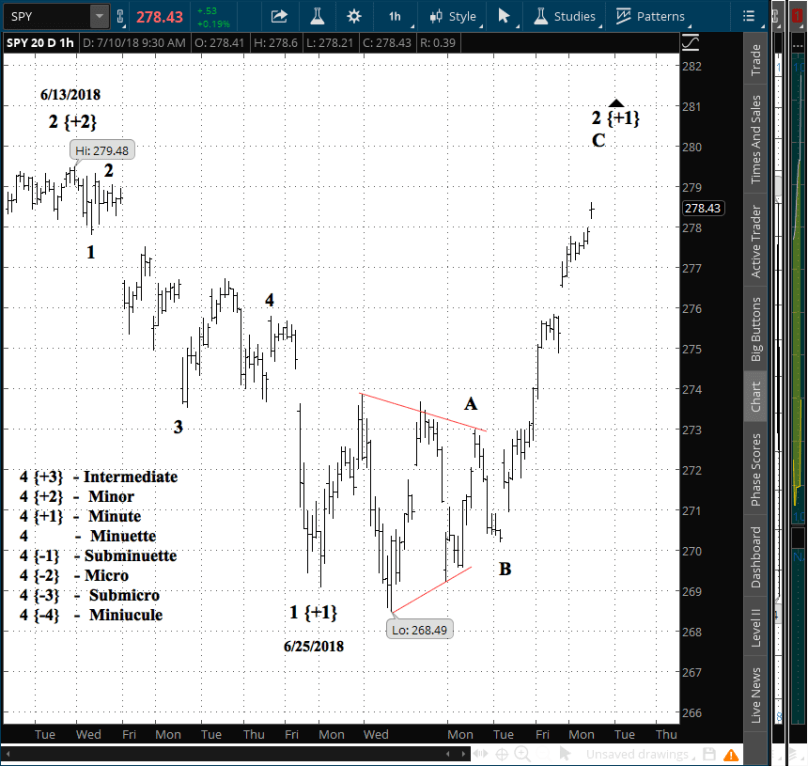
SPY is in a C wave within a 2nd wave countertrend correction. Once that C wave has ended, I expect the 3rd wave down to new lows to begin.
The SPY chart spans 20 days with hourly bars.
ARKG is marking a B wave to the upside before beginning a 3rd wave down. I count the C wave has having nearly completed five waves up, and so I shall take my profit today in order to avoid the coming decline.
The ARKG chart is one year with daily bars.
By Tim Bovee, Portland, Oregon, July 10, 2018

You must be logged in to post a comment.