Live: Thursday, May 24, 2018

3 p.m. New York time

I placed no trades today.

10:10 a.m. New York time

I anticipate no trades today. The Elliott wave count for SPY remains unchanged, as a 1st wav to the downside continues. The Fisher Transform on both the daily and monthly charts remains downtrending.

My SPY options (here and here) and shares in the inverse S&P 500 fund SPXU require no action at this point.

By Tim Bovee, Portland, Oregon, May 24, 2018

Read More »

Live: Wednesday, May 23, 2018

3:00 p.m. New York time

No trades today. The Elliott wave count from this morning remains valid, and the Fisher Transform signals downtrending on both the daily and the monthly charts.

10:30 a.m. New York time

The S&P 500 index and its exchange-traded fund SPY continued the decline started yesterday, bringing the Fisher Transform on the daily chart back to a downtrend signal. The monthly downtrend signal continues, as it has since February.

I shall continue to hold my SPY options (here and here) and shares in the inverse S&P 500 fund SPXU.

I have reworked my Elliott wave analysis to account for the higher high of May 22, which broke Elliott wave doctrine by exceeding the starting point of the 2nd wave down of the same degree.

The new labelling extends the 2nd wave of the Subminuette degree into a five-wave combination pattern.

To simplify matters, I have reverted to my earlier nomenclature that shows degrees relative to each other, with a base set showing the wave number only, and degrees above and below that base being indicated with a plus-number {+1} or a minus number {-2} in curly brackets. I’ve added a table suggesting what named degrees the relative levels indicate, but it’s a guess and may change.

The chart below shows SPY price from the beginning of the year, with daily bars.

spy20180523


By Tim Bovee, Portland, Oregon, May 23, 2018

Read More »

Live: Tuesday, May 22, 2018

3:15 p.m. New York time

No trades today.

SPY moved down during the day. The need for a recount of the Elliott wave analysis still stands, however, and I’m still figuring out how best to read the chart.

Big picture: The S&P 500 and other broad stock indexes made a high-level peak on Jan. 26. It is a downward wave, in my opinion a 1st wave of the primary degree.

Therefore, my major presumption remains bearish within that wave.

All of the Sturm und Drang since has been a working out of the details — the waves of lesser degree — within that bearish move.

Of course, for shorter-term traders like me, the devil is in the details, and those waves of lesser degree can burn up my profits very quickly. So I shall be obsessing over the new count until I’ve figured out an answer.

10:40 a.m. New York time

At this morning’s open SPY exceeded it’s May 14 peak, which I have labelled, using Elliott wave analysis, as the start of Minute wave 1 to the downside. Today’s opening breaks an iron-clad rule of Elliott wave doctrine, which is that a 2nd wave can never move beyond the beginning of the preceding 1st wave of the same degree.

Long story short, it’s back to the drawing board.

Events like this illustrate my contention that Elliott wave analysis is as much an art as a science. The patterns and the rules hold true, but their significance unfolds over time. Any count is the best intuitive based on the information available at the moment, but that intuition can be invalidated by ensuing events. That’s what happened this morning.

The Fisher Transform continues to show uptrending on the daily chart and downtrending on the monthly chart. Absent an agreement between the two, I am biding my time.

I plan no action at this point on my SPY options (here and here) and shares in the inverse S&P 500 fund SPXU.

By Tim Bovee, Portland, Oregon, May 22, 2018

Read More »

Live: Monday, May 21, 2018

3:15 p.m. New York time

No trades today. My analysis of the markets from this morning remains unchanged.

10:55 a.m. New York time

The revised Elliott wave count, showing that the 2nd wave of the Minuette degree is still underway.

The chart covers 10 days with 10-minute bars.

spy20180521

10:15 a.m. New York time

SPY’s gap upward this morning pushed the price above what I had labelled as the end of the 2nd wave peak of the Subminuette degree of the Elliott wave count. That means the 2nd wave is still in force, invalidating my previous count. I shall reanalyze the chart and post it later today.

The Fisher Transform on the SPY daily chart moved back to uptrending on the daily chart but remains downtrending on the monthly chart. At this point I intend no exits from my present positions, composed of SPY options (here and here) and shares in the inverse S&P 500 fund SPXU.

By Tim Bovee, Portland, Oregon, May 21, 2018

Read More »

The Week Ahead: Housing and durables

Real estate takes the spotlight in the week’s economic reporting, with the larger part of the sector, existing home sales, out Thursday and the remainder, new home sales, out Wednesday, each at 10 a.m. New York time.

Also, look for durable goods orders on Friday at 8:30 a.m.

In Fedworld, minutes of the May 2 Federal Open Market Committee meeting will be published on Wednesday at 2 p.m. At that meeting members voted unanimously to keep the federal funds target unchanged at 1.5% to 1.75%.

Fed Gov. Lael Brainard speaks on revitalization of the Community Reinvestment Act at a conference of the Association for Neighborhood and Housing Development in New York City, on Friday at 9:15 a.m. The event will be streamed live to viewers who register, here.

Read More »

Live: Friday, May 18, 2018

3:20 p.m. New York time

I placed no trades today.

10:45 a.m. New York time

The Fisher Transform on the SPY daily chart has returned to downtrending, validating the more complex signal handling I discussed in the May 17 Live post. The Elliott wave count, the daily Fisher and the monthly Fisher are all three aligned in signaling a downtrend.

Today’s early trading marked a new low in the decline from May 17, which I count as a 3rd wave down of the Subminuette degree.

I see no need for action on my present positions, SPY options (here and here) and shares in the inverse S&P 500 fund SPXU. I have no new positions planned for today.

By Tim Bovee, Portland, Oregon, May 18, 2018

Read More »

Live: Thursday, May 17, 2018

2:45 p.m. New York time

Rules are a bulwark against failure. Rules are fallible. Such are the Scylla and Charybdis through which traders must navigate every day.

Today’s six-headed monster and giant whirlpool, described in Homer’s Odyssey, are the signals from the Fisher Transform vs. the ambiguities of the Elliott wave count.

In beginning my trades into and out of the triple leverage inverse fund SPXU, which is based on the S&P 500, I proposed to rely solely on the daily chart’s Fisher Transform signals.

My resolve happened to coincide with a period of weak trending by the S&P 500 and consequently, a series of whipsaws, even on a metric as whipsaw-resistant as the Fisher.

And whipsaws, as we know, are like the gluttonous geese, also of the Odyssey. They nibble away at the prospect of profits until only the impossible dream remains.

What is a trader to do?

The chart below cover a month with daily bars. The upper metric is the Fisher Transform itself, with signals occurring when the yellow line crosses the blue line. The lower metric is a signal chart, showing the state of the Fisher: Uptrend or downtrend.

spyfisher20180517

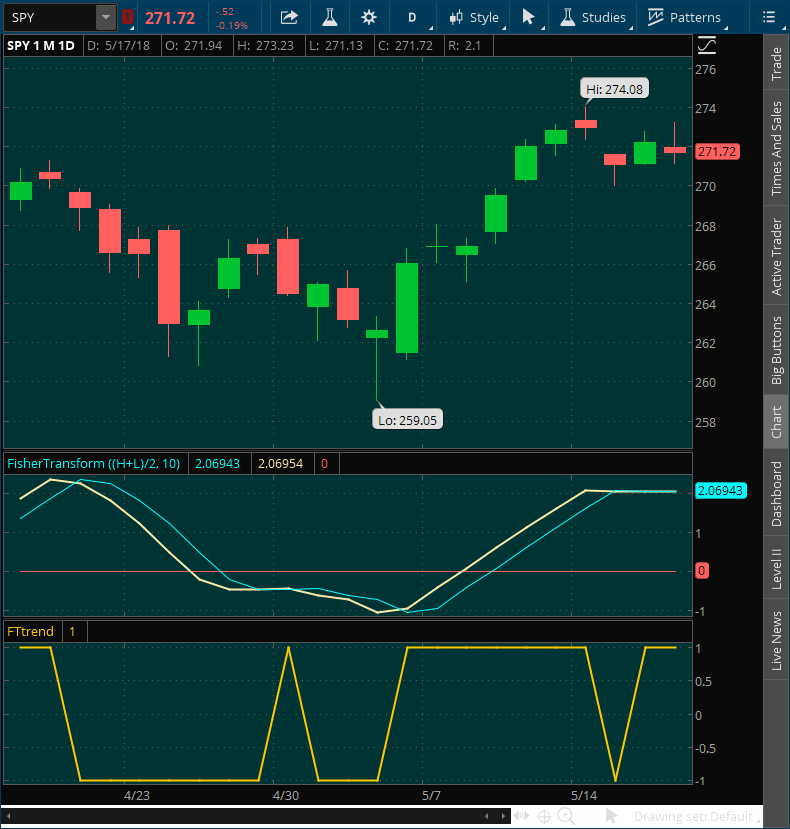
The Fisher whipsawed on May 15, moving to a downtrend signal , and then moved back to an uptrend signal the next day. The price chart itself shows a three-day sideways move, with the two lines in the upper metric crossing each other only in the most minuscule way, without an real change in the price trend. It’s as through Odysseus’ boat had only inches to spare to avoid the six-headed monster.

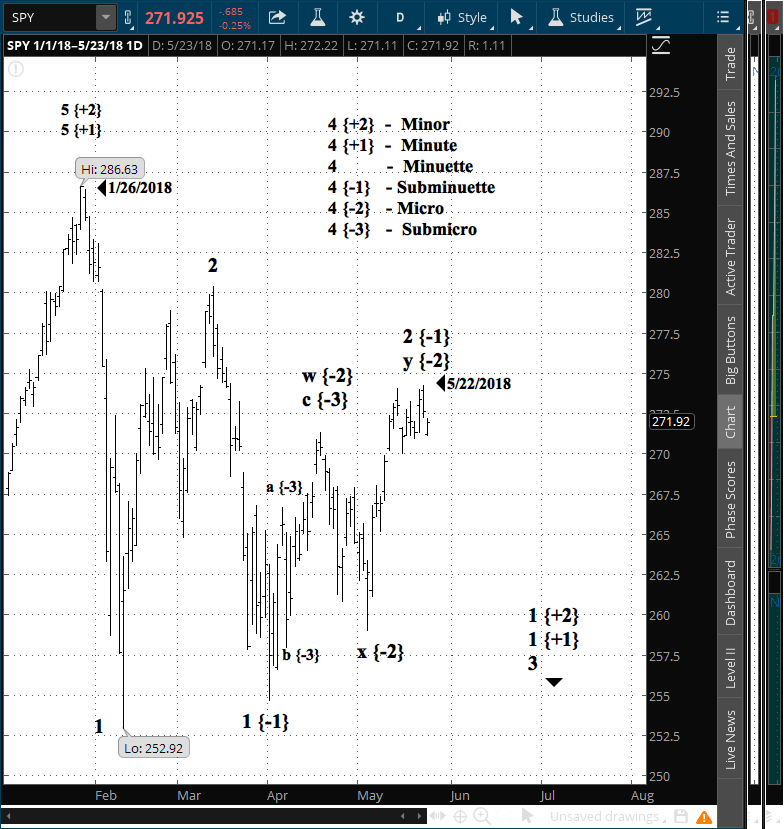
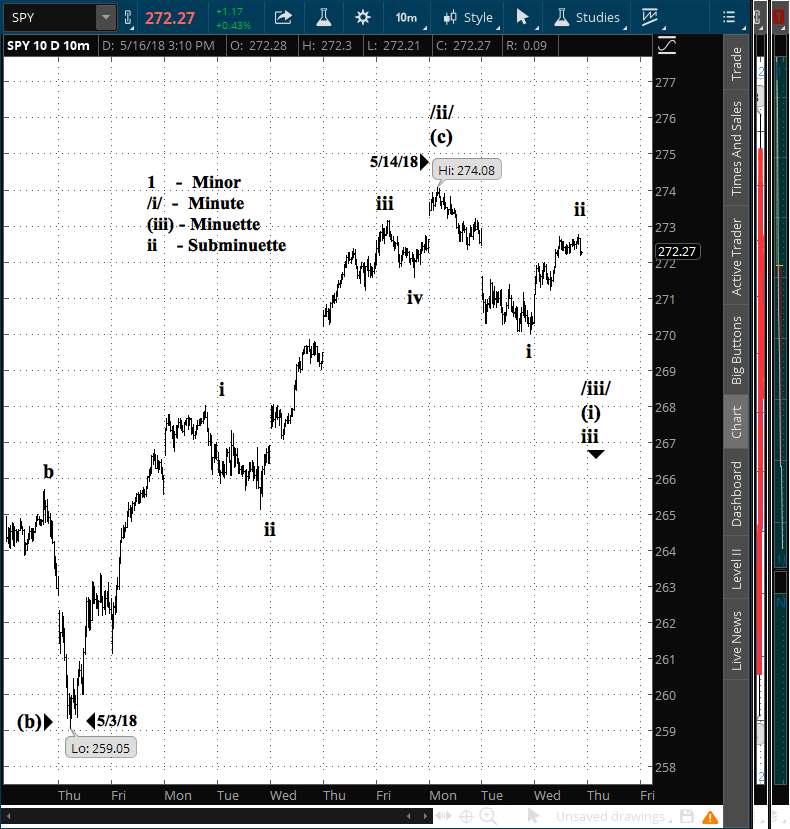
Under such circumstances, the signals aren’t meaningful. Add to the confusion the face, discussed in the May 16 live post, that by the Elliott wave count is clearly downtrending at the degrees I care about. Market charts are fractal in nature, with trends within trends. So a downtrend at one degree can contain both uptrends and downtrends at lesser degrees.

One way to navigate through the waters is to calm them by moving to a longer-term chart for the Fisher signals.

A monthly chart, for example, signals at a more stately pace, as seen on this five-year chart with monthly bars.

spyfisher20180517b

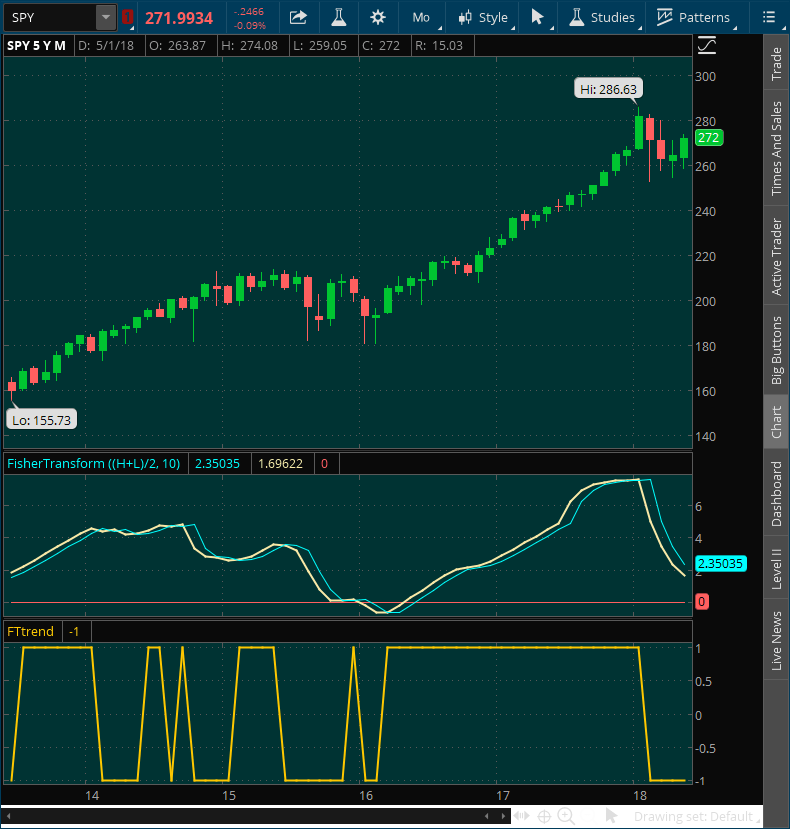
And I think that provides the solution. In assessing the Fisher Transform, I shall initially look at the daily chart signal. But I shall look at the monthly chart for confirmation. And I shall use the Elliott wave analysis as a tie-breaker.

In today’s case, the daily Fisher is showing an uptrend, but the monthly Fisher is showing a downtrend and the Elliott wave count is also downtrending. The consensus, then, is to continue to hold my bear positions on the S&P 500, including my long shares in the inverse fund SPXU.

10:55 a.m. New York time

The Fisher Transform on the SPY daily chart continues to signal an uptrend, and the intra-day signals agree. If the signals remains uptrending my rules require exiting my shares position in SPXU today.

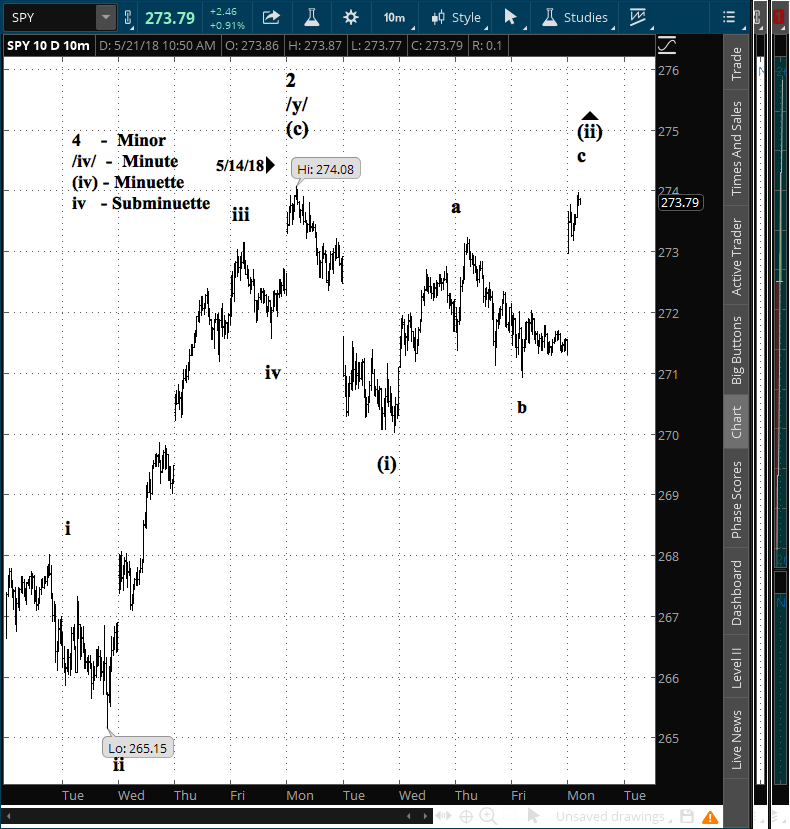
My Elliott wave analysis shows SPY continuing in 3rd waves to the downside of both the Minor and Minuette degrees, so I shall continue to hold my options positions on SPY (here and here). See the chart in Wednesday’s Live discussion.

By Tim Bovee, Portland, Oregon, May 17, 2018

Read More »

Live: Wednesday, March 16, 2018

3:15 p.m. New York time

I entered no positions and exited none.

The Fisher Transform on the daily hart moved to uptrending as the closing bell approached. However, as of this posting the trend was unconfirmed by the 10-minute chart Fisher, which is signaling a downtrend.

The signals would affect my shares trade on SPXU, and I shall wait and see if the signals will align before taking any action.

The uptrend signal is unsupported by the Elliott wave count. Below, a 10-day chart with 10-minute bars showing my Elliot wave analysis of the 3rd wave of the Minute degree, which began on May 14.

spy20180516

10:35 a.m. New York time

SPY has traded largely within yesterday’s range so far this morning. I have no trades in sight.

By Tim Bovee, Portland, Oregon, May 16, 2018

Read More »

SPY Analysis

SPDR S&P 500 ETF (SPY)

Update 6/11/2018: SPY as it turned out extended its 2nd-wave correction to the upside after I entered the position on May 14, entering a persistent rise on May 19 that continues to this day.

I exited for a loss more than a month before the options would have expired, for a $6.94 debit with shares at $278.51. I shall re-establish a position once the correction has ended.

Shares rose by 6.1% over my 39-day holding period, or a +57% annual rate. The options position lost 57.9% for a -542% annual rate and -1.5% share-equivalent loss.


I have entered a short vertical spread on SPY, using options that trade for the last time 66 days hence, on July 20. The premium is a $3.26 credit and the stock at the time of entry was priced at $270.86.

I made the decision to enter the trade in my account based on a reversal from the peak of May 14, beginning by my Elliott wave count the 3rd wave to the downside at the Minute degree.

Read More »

Shares: SPXU

ProShares UltraPro Short S&P500 (SPXU)

Update 5/25/2018: SPXU underwent a 4:1 reverse stock split on May 24. Here is the updated basis:

sym entry exit result (%) annualized (%) entry date exit date
SPXU 40.56 5/15

I have entered a shares position in SPXU, a triple-leveraged inverse fund based on the S&P 500 index.

The Fisher Transform on the S&P 500 signaled a downtrend this morning on the daily chart, a profitable direction for inverse funds.

The trade, with the basis reflecting the price prior to the May 24 4:1 reverse split:

sym entry exit result (%) annualized (%) entry date exit date
SPXU 10.14 5/15

By Tim Bovee, Portland, Oregon, May 15, 2018

Read More »