Shares: SPXU

ProShares UltraPro Short S&P500 (SPXU)

Update 5/7/2018: The Fisher Transform moved to uptrending on the SPY daily chart, and I exited my bear position on the SPXU inverse fund for a loss. I shall re-enter SPXU when the Fisher again signals a downtrend.


I have entered a bull position on SPXU using shares. SPXU is a short fund — it attempts to move the opposite of the S&P 500 — and a leveraged fund — it attempts to produce triple the return (or loss) for any given price move.

I entered the position because the daily chart Fisher Transform on SPXU is uptrending, and my Elliott wave analysis shows the S&P 500 in a third wave to the downside at multiple degrees. (See the SPY chart discussion in the May 3 Live post.)

So, a declining SPY equates to a rising SPXU.

The trade:

sym entry exit result (%) annualized (%) entry date exit date
SPXU 11.24  10.58  -5.9%  -535.8% 5/3  5/7

For my SPY options positions I’m relying on Elliott wave analysis to tell me that it’s time to get out. For SPXU, I’m eliminating the Elliott for exits and shall rely solely on the Fisher Transform to signal entries and exits.

I an do this because the position was placed the Robinhood Markets Inc. platform, which charges no commission on trades.

By Tim Bovee, Portland, Oregon, May 3, 2018

Read More »

SPY Analysis

SPDR S&P 500 ETF (SPY)

Update 6/11/2018: Exited. Results to be posted shortly.

I have entered a short vertical spread on SPY, using options that trade for the last time 43 days hence, on June 15. The premium is a 2.92 credit and the stock at the time of entry was priced at $262.50.

I made the decision to enter the trade in my account after concluding, based on Elliott wave analysis, that a 3rd wave down at the Minuette degree has begun. The Minuette is my preferred degree for trading options.

Read More »

Live: Thursday, May 3, 2018

5/3 – 3:20 p.m. New York time

I entered two positions today, a short bear position using options on SPY and a long bull position using shares on SPXU, which is an inverse fund with the same underlying as SPY, the S&P 500 index.

5/3 – 1:05 p.m. New York time

I have entered a bear-call-spread position on SPY after reworking my chart analysis. One problem with what I had before — and it is one that I have mentioned previously — is that the “feel” wasn’t right. The duration and span of the waves seemed somewhat inconsistent.

The new count considers the 3rd wave down of the Minuette degree to have begun on May 2. The Minuette is my preferred tell-tale for entering trades.

A 3rd wave at the Minuette degree is also a 3rd wave at the Minute degree, and indeed at the Primary degree, which is the level that began its 1st wave down on Jan. 26, kicking off the bear market.

Here is my reworked chart, covering 15 days with 30-minute bars:

spy20180503

5/3 – 11 a.m. New York time

My goal today will be to find a re-entry point into the large exchange-traded funds, SPY foremost, but others as well. No guarantees of success of course. As thte old market wisdom has it, “When in doubt, stay out.”

By Tim Bovee, Portland, Oregon, May 3, 2018

Read More »

Live: Tuesday, May 1, 2018

5/1 – 3:35 p.m. New York time

No trades today.

5/1 – 12:45 p.m. New York time

Having exited my SPY positions on Monday, the question now is when should I get back in. The decision whether to exit was based on Elliott wave analysis. The actual timing of the move was determined by the Fisher Transform, which moved to uptrending on the daily chart.

The Fisher this morning, in a classic whipsaw, moved back to downtrending. But that is not necessarily a signal to re-enter a bear position. The decision on whether to re-enter falls back on Elliott wave analysis.

In a declining market, Elliott answers the questions, What sort of decline is it? How does it fit into bigger picture? Only after those questions are answered can I make a decision to re-enter, and then time the re-entry itself with the Fisher Transform.

(The discussion that follows is pure Elliott. Readers unfamiliar with the analytical technique can find overviews in Wikipedia, Investopedia and  StockCharts. The leading practitioners of Elliott wave analysis are at Robert Prechter’s Elliott Wave International. The principle textbook is The Elliott Wave Principle: A Key to Market Behavior.)

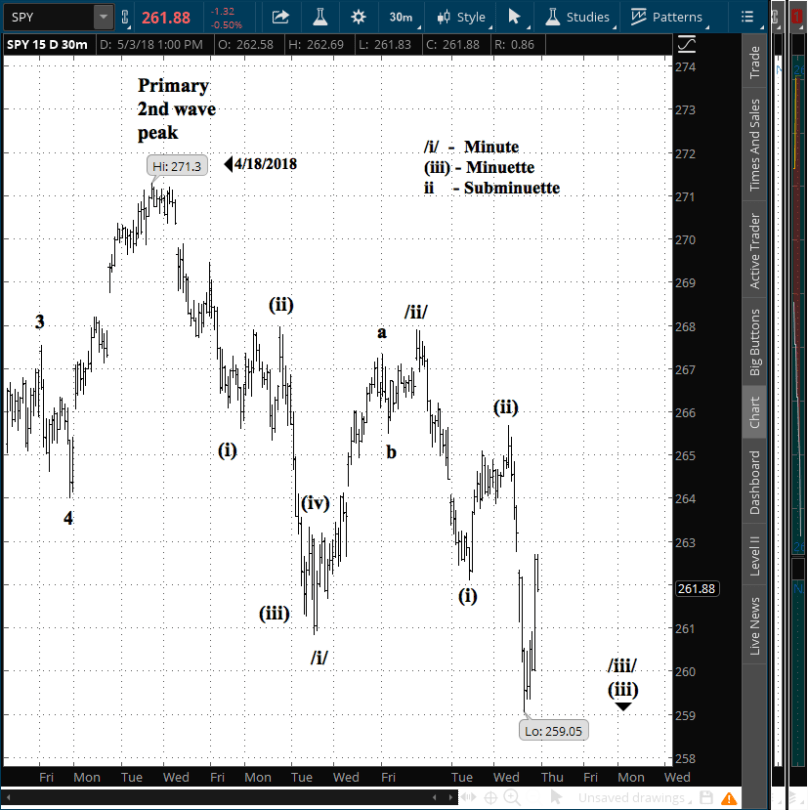
My goal is to trade the Minuette degree identified through Elliott wave analysis. By convention, it is identified on the chart by lower-case roman numerals and letters enclosed by parentheses. The next higher degree, Minor, completed its 2nd wave correction to the upside on April 18, and is now working through a 3rd wave to the downside within the chart’s larger downtrends.

In other words, it’s a bear market, and has been since Jan. 26. The Minor degree is in a motive wave to the downside, and that means a five-wave pattern, 1, 3 and 5 in the direction of the trend, and 2 and 4 as counter-trend corrections.That means I play the 1st, 3rd and 5th waves to the downside at the Minuette degree.

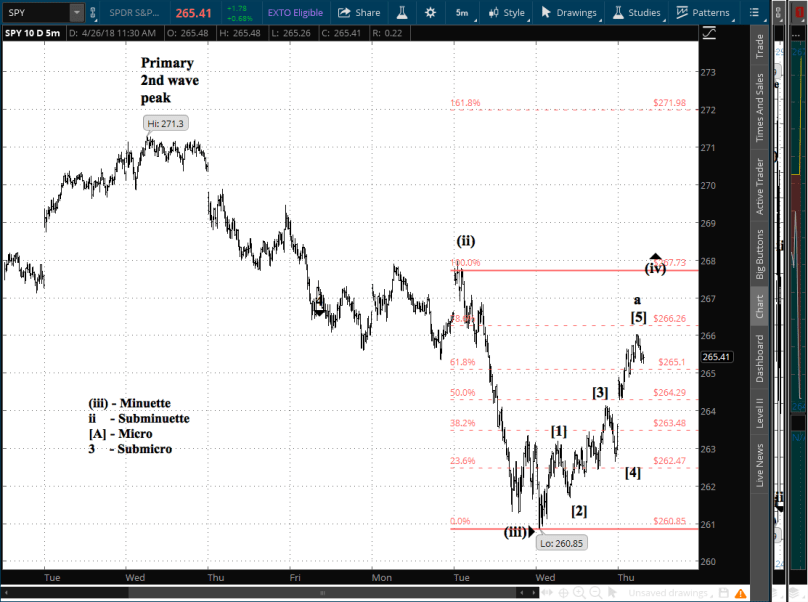
The Minuette 3rd wave ended on April 25. I didn’t recognize the end of the 3rd wave quickly enough when the present 4th wave began, and so ended up riding the A-wave of the 4th for much of its upward journey. Difficulty in recognizing transitions is a continual challenge in Elliott. There are no bells or sirens to mark the end of a wave, and often the change attains clarity only in retrospect.

Corrections in Elliott are three-wave patterns (A-B-C) and sometimes chains of triplicities. That suggests that the Minuette 4th wave continues, with the present decline being a B-wave counter-trend correction within the Minuette 4th.

Since I’m playing the Minuette degree, my proper course of action is to wait for the 4th wave to complete its run, and then trade the Minuette 5th wave to the downside.

The next movement will be a C-wave to upside. After that, things get ambiguous. Does the ensuing decline signal the beginning of the Minuette 5th wave? Or is it a continuation of a complex series of triple-wave patterns. I shall consider that question once it begins.

Elliott wave analysis is in many ways like a doctor’s diagnosis: There are rules and guidelines aplenty, but the variations within how each pattern plays out makes analysis of the current status tentative.

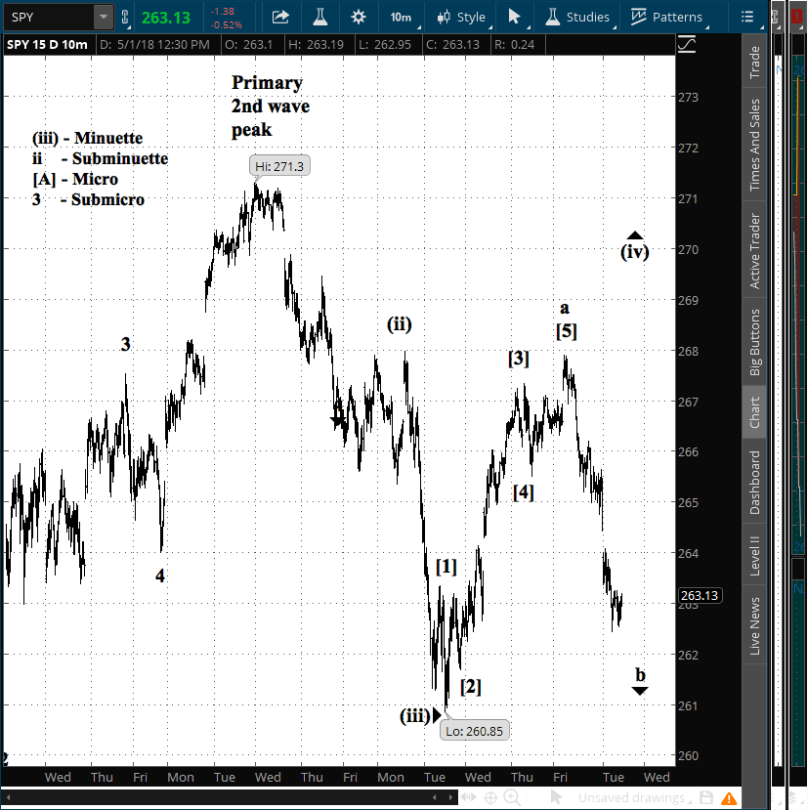
One rule is that the present B-wave to the downside cannot move past the beginning of the preceding A wave. That would be $260.85 on SPY, attained on April 25. If the present B wave moves below that level, then I shall need to reanalyze the chart to account for the new information.

Here is a 15-day chart, with 10-minute bars and my current wave count, captured at 9:38 a.m. on May 1.

SPY20180501

By Tim Bovee, Portland, Oregon, May 1, 2018

Read More »

Live: Monday, April 30, 2018

4/30 – 2:20 p.m. New York time

I have posted results for my two SPY positions,  here and here, which I exited a short time ago. This wraps up trading for today. I shall be looking for re-entry points on Tuesday.

Here’s my latest Elliott wave count, on a 15-day chart with 10-minute bars.

spy20180430

4/30 – 1:30 p.m. New York time

The 10-minute chart Fisher Transform moved to uptrending, and I have exited my SPY positions for a loss. Updates with results to come shortly.

4/30 – 11:20 a.m. New York time

The Fisher Transform on the SPY daily chart moved to uptrending, and that is my signal to exit my SPY positions, here and here.

The 10-minute chart Fisher Transform remains downtrending, and I shall use it as my guide for when to exit today or early Tuesday.

I outlined the tactical exit requirements in my 10:40 a.m. post in the April 20 live feed.

By Tim Bovee, Portland, Oregon April 30, 2018

Read More »

The Week Ahead: Jobs, money policy, income, outlays, global trade

The Federal Open Market Committee meets for two days, with any interest rate changes being announced on Wednesday at 2 p.m. New York time. And on Friday, the week’s second blockbuster hits the markets: The employment situation report, out at 8:30 a.m. New York time.

The jobs report gets a sneak preview with the ADP employment report, on Wednesday at 8:15 a.m.

Other major reports during the week: Personal income and outlays on Monday and international trade on Thursday, each at 8:30 a.m.,and the Institute of Supply Management manufacturing index, published Tuesday at 10 a.m.

Fed Vice-Chairman Randal Quarles discusses liquidity regulation and the size of the Federal Reserve’s balance sheet at the Hoover Institution’s Monetary Policy Conference on Currencies, Capital and Central Bank Balance, in Stanford, Calif. at 5:30 p.m. New York time.

Read More »

Live: Thursday, April 26, 2018

4/26 – 3:15 p.m. New York time

SPY continued to rise in an A-wave upward correction at the Subminuette level, exceeding the 78.7% Fibonacci level. I entered no new positions today and exited none of my existing positions.

4/26 – 11:35 a.m. New York time

SPY on Wednesday moved into a 4th wave correction to the upside in the Minuette degree. It has in a Subminuette A wave retraced 78% of the Minuette 3rd wave decline. Since SPY is now in a 4th wave and the 2nd wave was a zig-zag, then by the principle of alteration the present move ought to be a flat (sideways) move.

I’m uncertain about the degrees that I’m using on my count, but ultimately, it doesn’t matter for my decision. I know SPY is in a 4th of wave of some degree, and the next move is likely to be to the downside, either as a B wave of some degree or as a 5th wave in the direction of the impulse downtrend. Either one will trigger the Fisher Transform into a downtrending mode, signaling an exit.

My SPY positions were analyzed at entry here and here.

Below, a 10-day SPY chart with 5-minute bars, annotated with my Elliott wave count and the Fibonacci retracement of the Subminuette A wave correction (a) discussed above.

SPY20180426a

By Tim Bovee, Portland, Oregon April 26, 2018

Read More »

Live: Wednesday, April 25, 2018

4/25 – 3:05 p.m. New York time

No trades today. Little change in the chart from this morning.

4/25 – 11:05 a.m. New York time

SPY continues its decline, continuing the trend that began after the April 18 peak. My chart analysis of Tuesday remains valid. The Fisher Transform this morning still signals a downtrend. So at this point I see no need for action on my two bear positions on SPY, which I analyzed here and here.

By Tim Bovee, Portland, Oregon April 25, 2018

Read More »