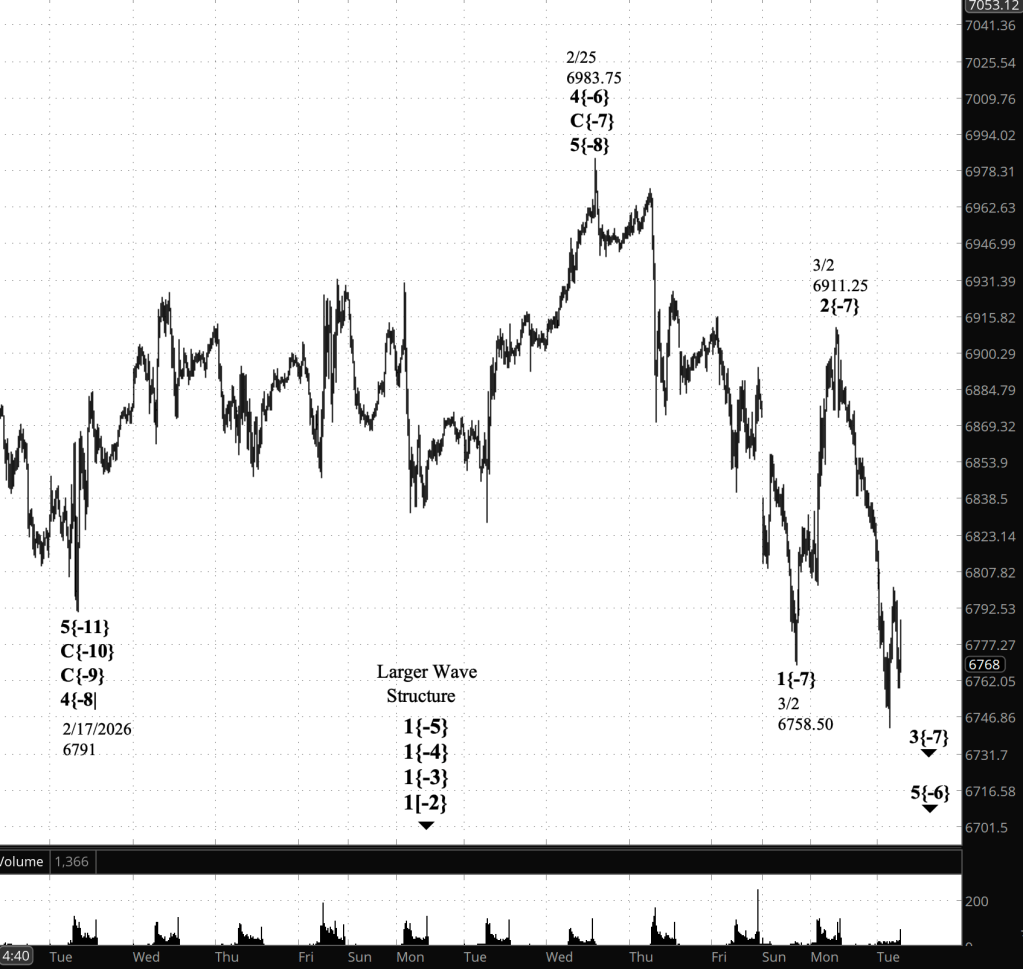
3:30 p.m. New York time
Half an hour before the closing bell. The S&P 500 futures continued to rise from the overnight low, 6584.50, reaching into the 6780s.
Elliott Wave Theory: The rise suggests that wave C{-8}, the final subwave within the rising wave 4{-7} correction, began at the overnight low. That interpretation has now been confirmed, because the price has risen above 6758.50, the end of the preceding 1st wave, establishing that C{-8} is underway.
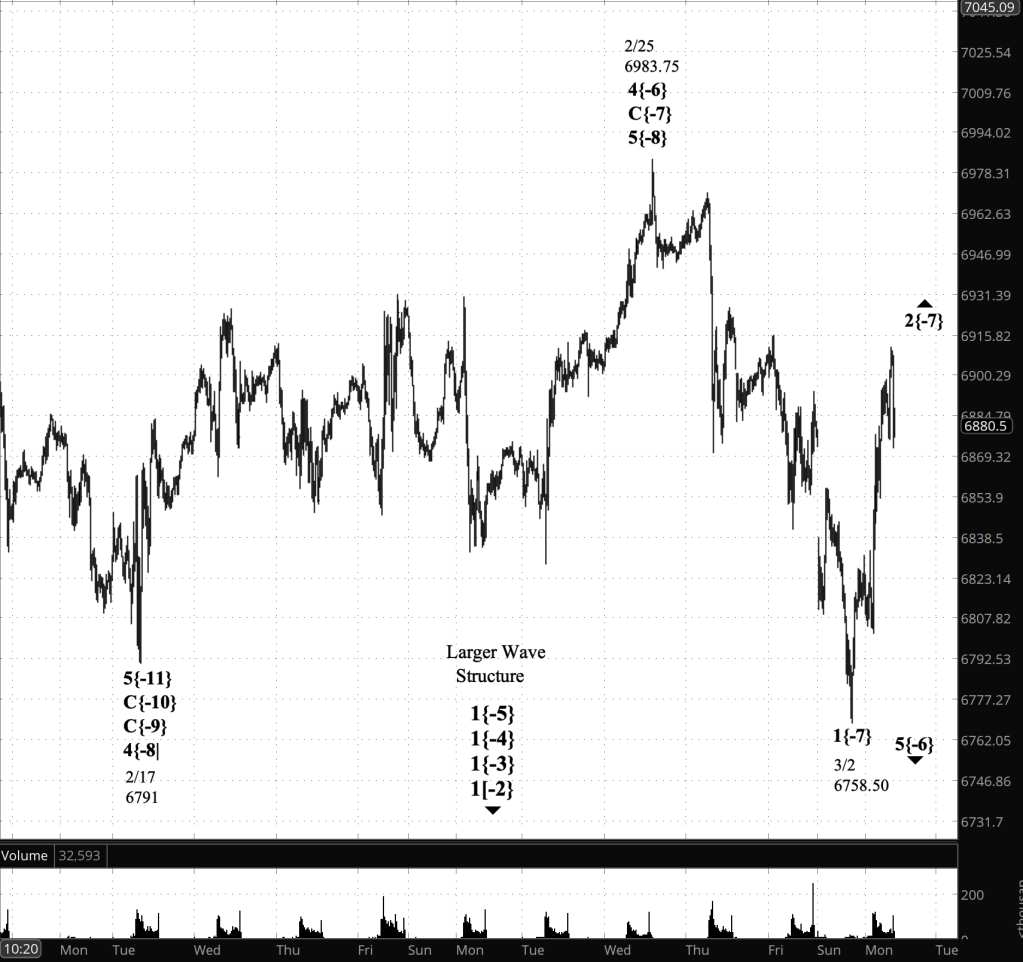
9:35 a.m. New York time
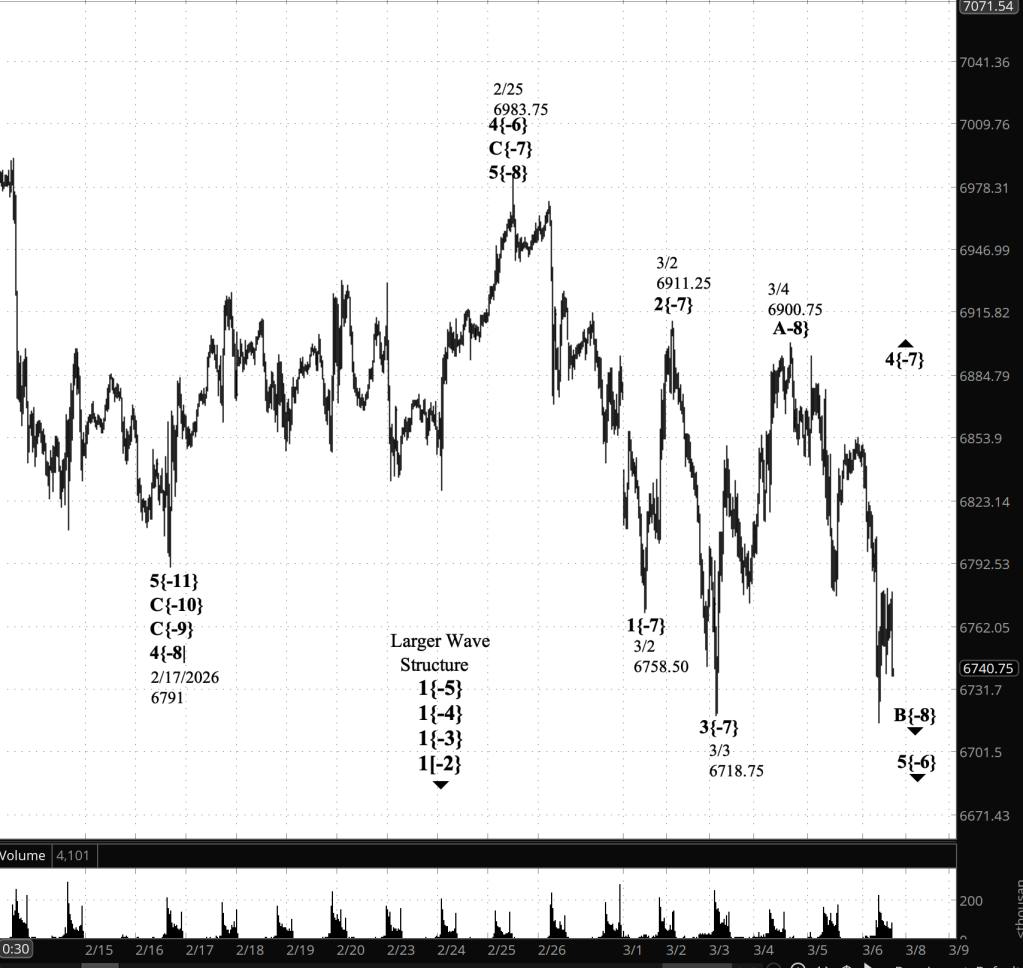
What’s happening now? When the S&P 500 E-mini futures resumed trading on Sunday, it opened 55 points lower than last week’s close. The opening gap was followed by a sharp decline that carried the price to 6584.50. From there it reversed, rising back to just above 6700.
The decline following the Sunday opening gap reached a low of 6584.50 before reversing upward. That level lies just above the 6580 decision point identified in the weekend planning session. Because the market reversed before breaking that threshold, Elliott Wave Theory interprets the decline as falling wave B{-8} within the ongoing wave 4{-7} correction.
What does it mean? The rebound suggests that the present rise is likely the beginning of wave C{-8}. However, the move has not yet advanced far enough to confirm that interpretation with confidence. For charting purposes, wave C{-8} will be considered confirmed if price rises above 6758.50, reclaiming the March 2 pivot and establishing a clearer upward structure.
Until that level is exceeded, the present rise is treated as a probable but not yet confirmed C{-8} within wave 4{-7}. A decisive break below 6584.50 would invalidate this interpretation and instead signal that downtrending wave 5{-7} is underway.
The chart remains labeled to show wave 4{-7} as underway, but that interpretation could change soon.
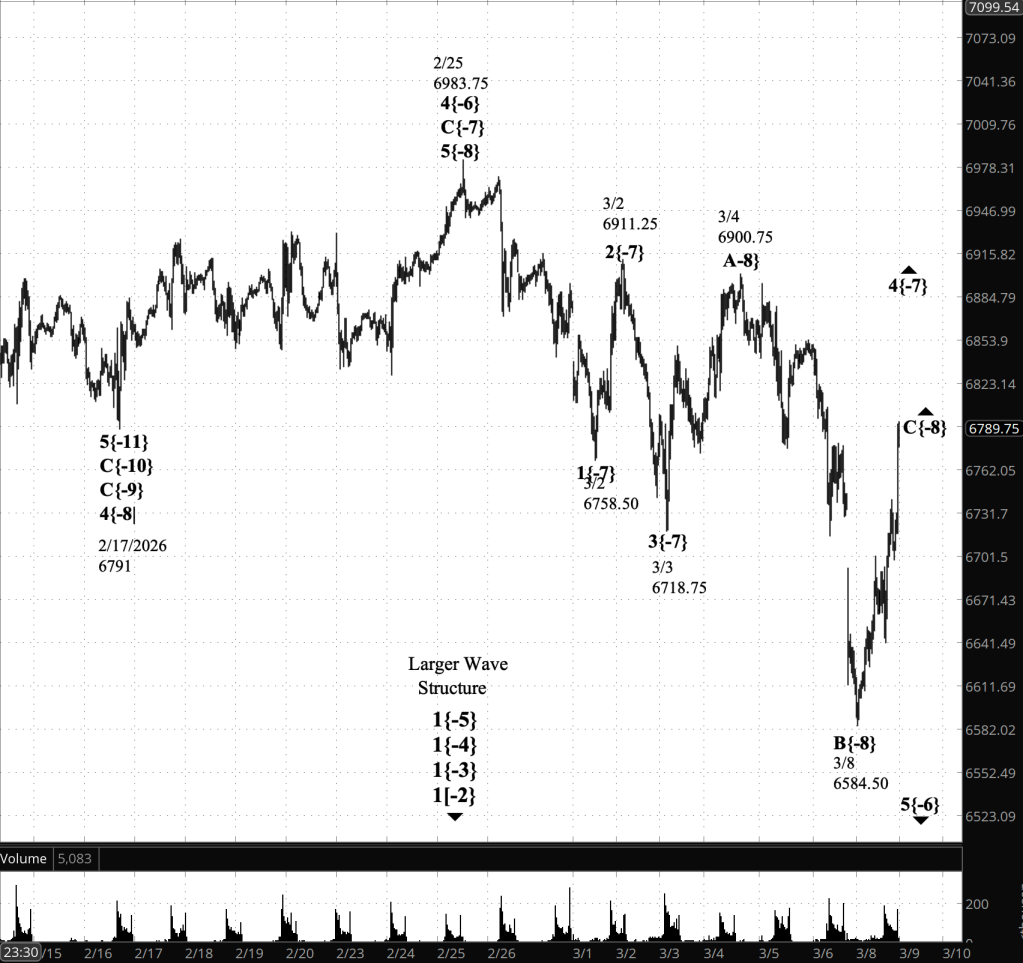
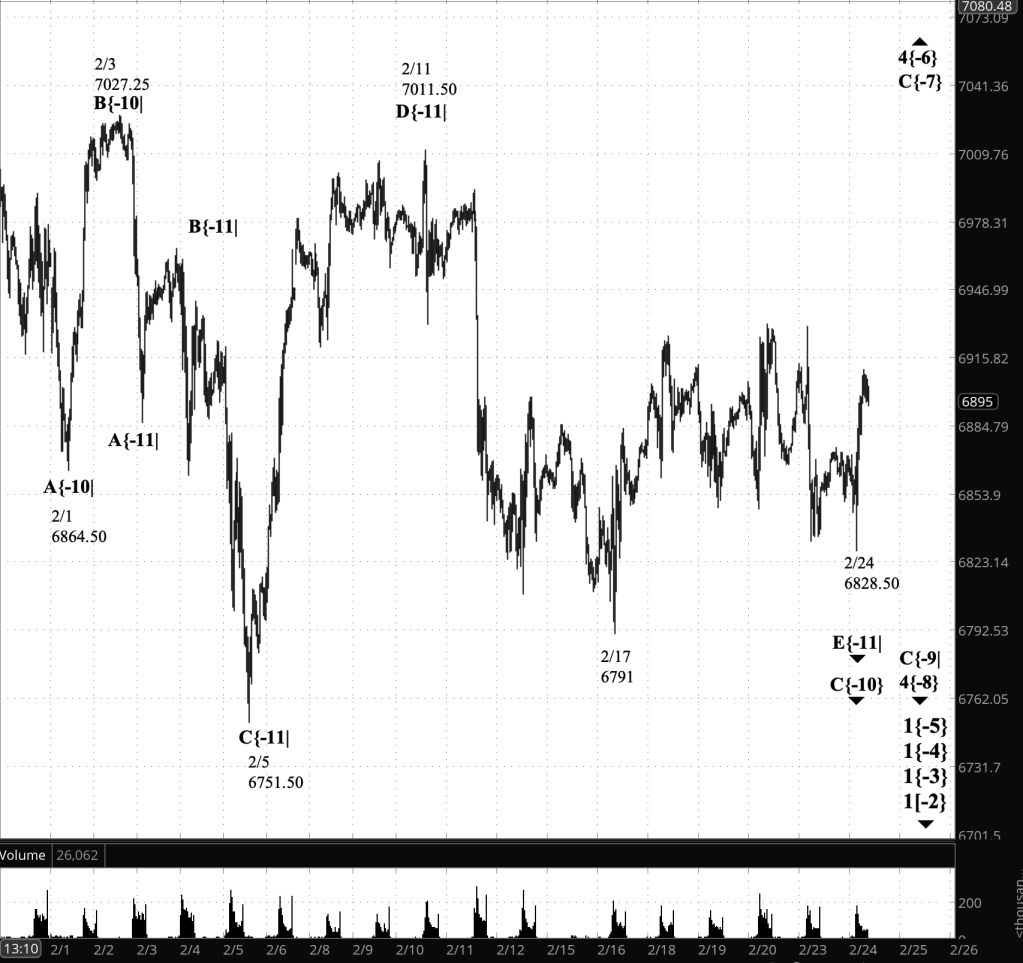
[S&P 500 E-mini futures at 3:30 p.m., 30-minute bars, with volume]
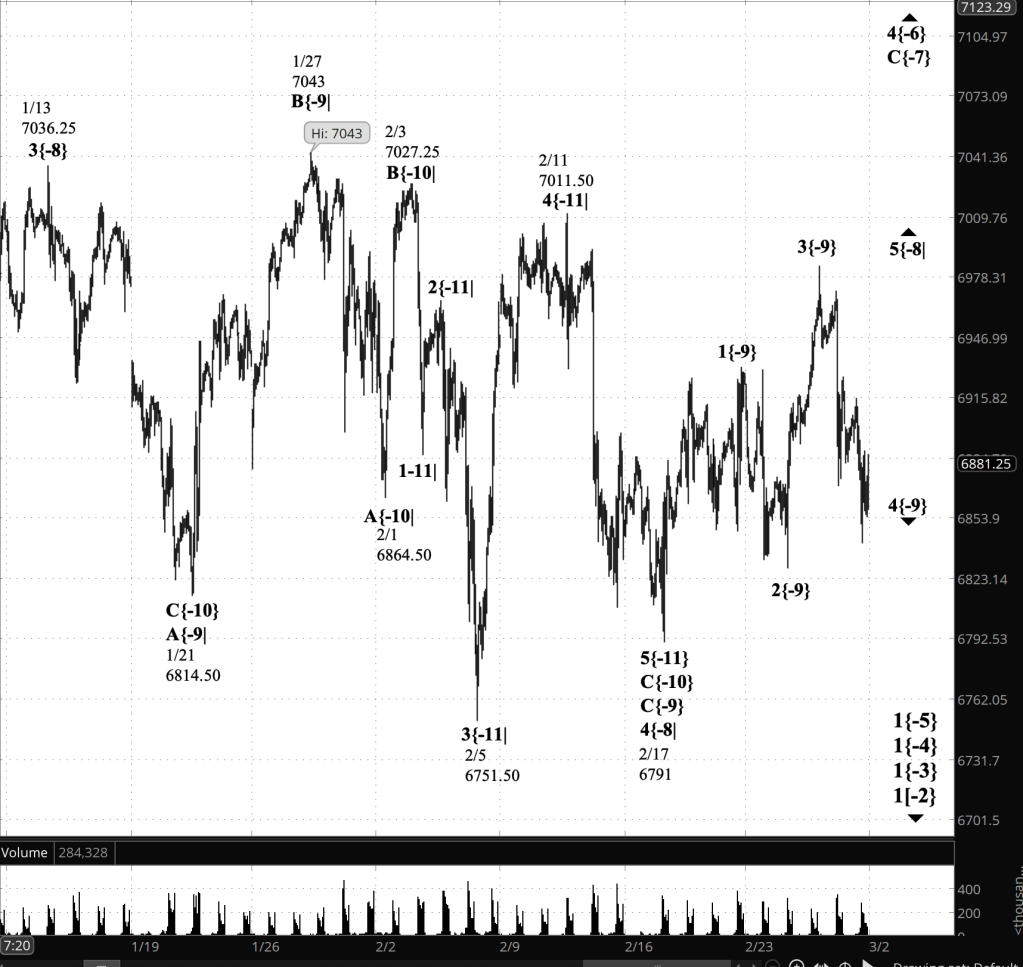
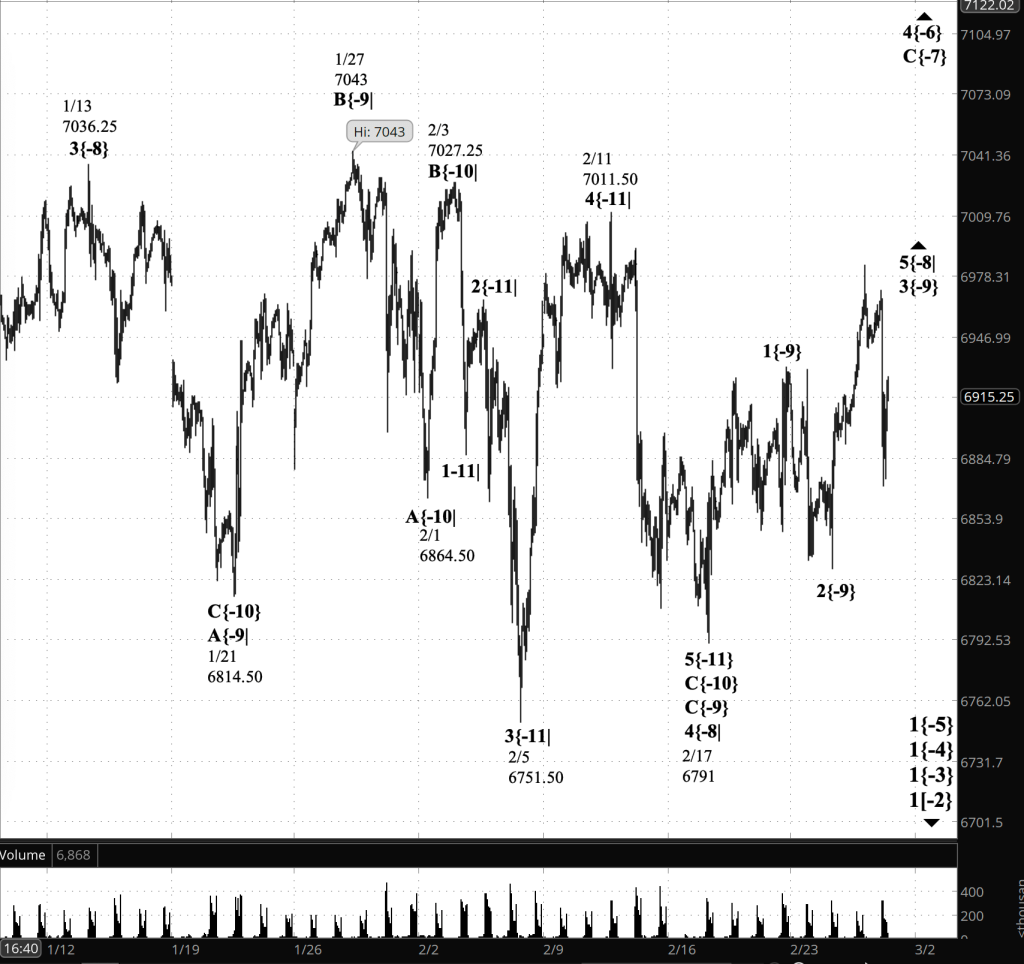
Waves Now Underway
These are the waves currently in progress under my principal analysis. Each line on the list shows the wave number, with the subscript in curly brackets, the traditional degree name, the starting date, the starting price of the S&P 500 E-mini futures, and the direction of the wave.
- 1{+4} Supermillennium, (unknown start date or start price) {down}
- A hypothetical wave one degree higher than Supercyle, needed to make the wave analysis complete.
- S&P 500 Index:
- 1{+3} Supercycle, 10/8/2025, 6812.25 (down}
- 1{+2} Cycle, 10/8/2025, 6812.25 (down}
- 1{+1} Primary, 10/8/2025, 6812.25 (down}
- 1{0} Intermediate, 10/8/2025, 6812.25 (down}
- 1{-1} Minor, 10/8/2025, 6812.25 (down}
- 1{-2} Minute, 10/8/2025, 6812.25 (down}
- S&P 500 Futures
- 1{-3} Minuette 10/8/2025, 6812.25 (down}
- 1{-4} Subminutte 10/8/2025, 6812.25 (down}
- 1{-5} Micro, 10/8/2025, 6812.25 (down}
- 5{-6} Submicro, 2/25/2026, 6983.75 (down)
- 4{-7} Minuscule, 3/3/2026, 6718.75 (up)
- C{-8} (none), 3/8/2026, 6584.50 (up)
Reading the chart. Price movements — waves – – in Elliott Wave Theory analysis are labeled with numbers within trending waves and letters with corrective waves. The subscripts — numbers in curly brackets — designate the wave’s degree, which, in Elliott Wave analysis, means the relative position of a wave within the larger and smaller structures that make up the chart. R.N. Elliott, who in the 1930s developed the form of analysis that bears his name, viewed the chart as a complex structure of smaller waves nested within larger waves, which in turn are nested within still larger waves. In mathematics it’s called a fractal structure, where at every scale the pattern is similar to the others.
Learning and other resources. Elliott Wave analysis provides context, not prophecy. As the 20th century semanticist Alfred Korzybski put it in his book Science and Sanity (1933), “The map is not the territory … The only usefulness of a map depends on similarity of structure between the empirical world and the map.” And I would add, in the ever-changing markets, we can judge that similarity of structure only after the fact.
See the menu page Analytical Methods for a rundown on where to go for information on Elliott Wave analysis.
By Tim Bovee, Portland, Oregon, March 9, 2026
Disclaimer
Tim Bovee, Private Trader tracks the analysis and trades of a private trader for his own accounts. Nothing in this blog constitutes a recommendation to buy or sell stocks, options or any other financial instrument. The only purpose of this blog is to provide education and entertainment.
No trader is ever 100 percent successful in his or her trades. Trading in the stock and option markets is risky and uncertain. Each trader must make trading decisions for his or her own account, and take responsibility for the consequences.
All content on Tim Bovee, Private Trader by Timothy K. Bovee is licensed under a Creative Commons Attribution-ShareAlike 4.0 International License.
Based on work at www.timbovee.com


You must be logged in to post a comment.