3;30 p.m. New York time
Half an hour before the closing bell. The S&P 500 began the session slightly above 4000 on the futures and has fallen into the 3920s.
- The decline provides further confirmation of this morning’s principal analysis: The upward correction, wave 2{-7}, ended on December 1, and a powerful downtrend, wave 3{-7}, is underway.
I’ve updated the chart.
9:35 a.m. New York time
What’s happening now? The S&P 500 E-mini futures traded sideways overnight after a four-day fall from 4110 to 3287.25.
What does it mean? A significant downtrend that began on December 1 continues and is in its early phase. I expect it to carry the price down into the 3200s and most likely lower.
What are the alternatives? There are two, and both assert that the downtrend has not yet begun.
- Alternative #1: The decline from December 1 is a subwave within the final wave of an upward correction that began on October 13. The price will rise again, most likely above 4110, the prior peak within the correction.
- Alternative #2: The upward correction is forming a compound correction, and the decline from December 1 is a wave linking the first corrective pattern, now complete, with a second corrective pattern, that has not yet begun. A compound correction can contain two or three corrective patterns.
- A reversal to the upside would cast doubt on the principal analysis. The higher the price rises, the greater the likelihood that the upward correction is still underway and that one of the two alternatives provides a better map of the market.
In any case, the upward correction will be followed by a significant downtrend.
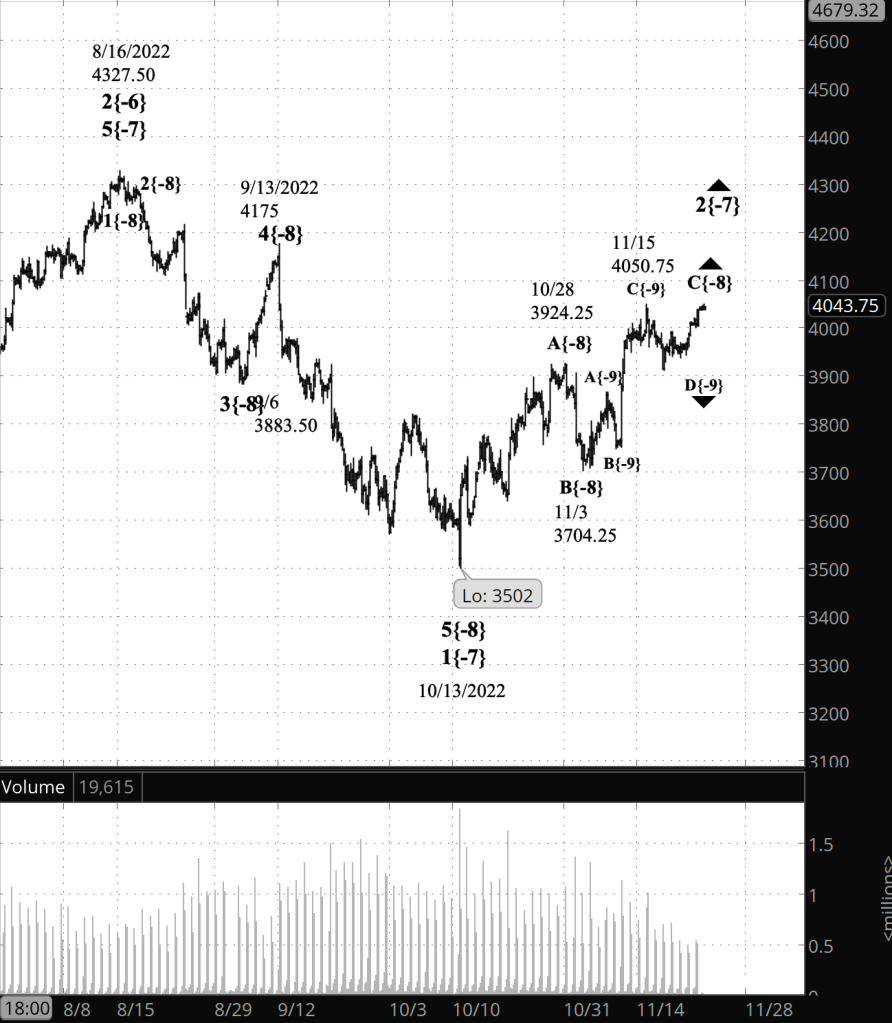
Chart note. As he was developing his method of analysis, R.N. Elliott noticed that each directional movement — each wave — stayed within a price channel, based on turning points of subwaves within the larger wave.
- The price channel sets limits on the third and final wave within the upward correction that began on October 13.
- The present analysis, that the downtrend has begun, was based on the price moving below the lower boundary of the price channel.
- The channel links the starting points of the 3rd and 5th subwaves as the lower boundary, and draws a parallel line through the end of the 3rd wave as an upper boundary.
- A preliminary version of the channel might have been been constructing by linking the starting points of the 1st and 3rd waves, with a parallel line drawn through the endpoint of the 3rd wave.
The channel is shown as a dashed line on the chart.

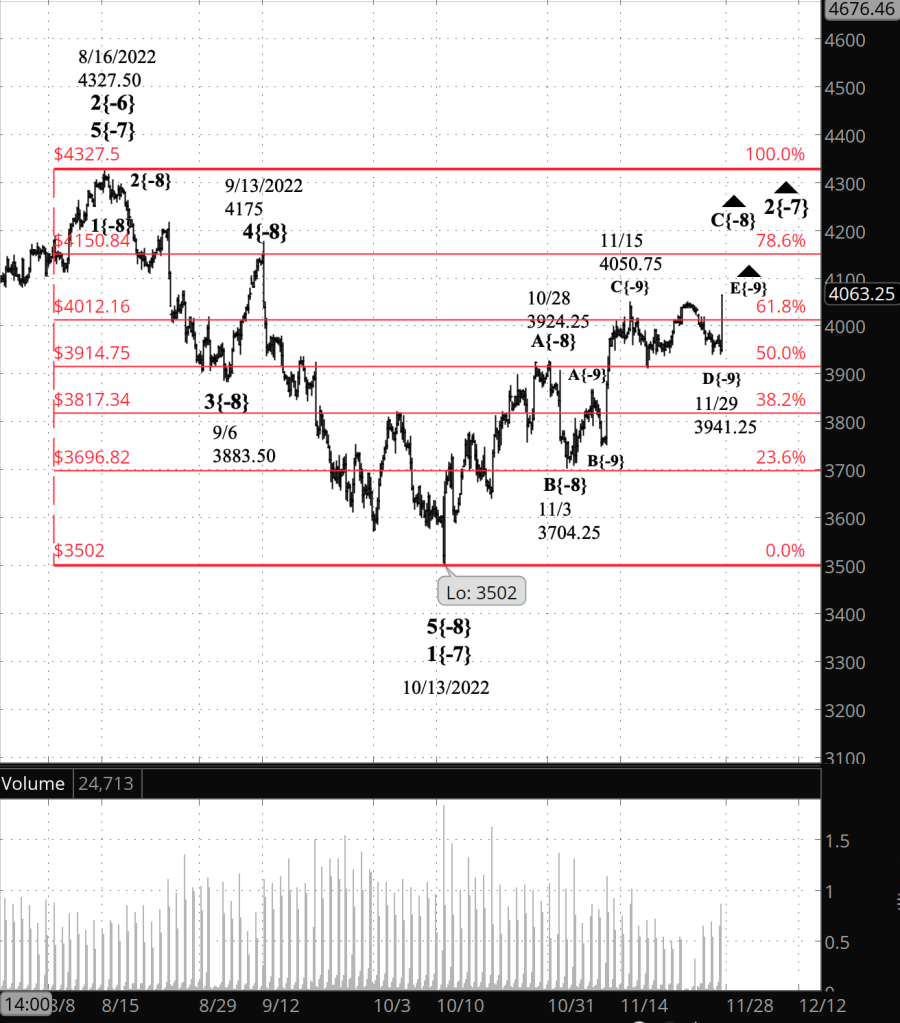
[S&P 500 E-mini futures at 3:30 p.m., 2-hour bars, with volume]
What does Elliott wave theory say? Under the principal analysis, the upward correction, wave 2{-7}, has ended, and a downtrend, wave 3{-7}, has begun.
- Both waves are subwaves of wave 3{-6}, which began on August 16.
- Third waves tend to show a great deal of energy and are usually the longest of the five waves that constitute a trend.
- Wave 3{-7} will be followed by another upward correction, wave 4{-7}, and then a final push to the downside, wave 5{-7}.
- A larger upward correction, wave 4{-6}, will then begin.
Under the alternative analysis, the upward correction is still underway and is in wave C{-8}, the third and final wave of the corrective pattern.
- Under alternative #1, the decline is a 4th wave downward correction within wave C{-8} that will be followed by a rising 5th wave that will almost certainly reach above the December 1 high, 4110, and will complete the corrective pattern.
- Under alternative #2, the decline is wave X{-8}, linking the first corrective pattern with a second corrective pattern, as wave 2{-7} forms a compound structure.
The bigger picture. Elliott’s most brilliant realization was that stock prices form fractal structures — waves drawing from sets of patterns within larger waves drawing from identical sets of patterns. The patterns are the same, from a chart with 1-minute bars to a chart with annual bars.
On my charts, following Elliott, I use numbers for the subwaves of trending waves and letters for the subwaves of corrective waves.
For the relative size of each wave — called its “degree”, its place in the fractal hierarchy — I use subscripts within curly brackets. Elliott named the degrees and used Roman numerals, upper and lower case, and circled numbers and letters to distinguish the degrees on the chart.
I find that the subscripts I use provide greater clarity in describing the relationship of one wave to another.
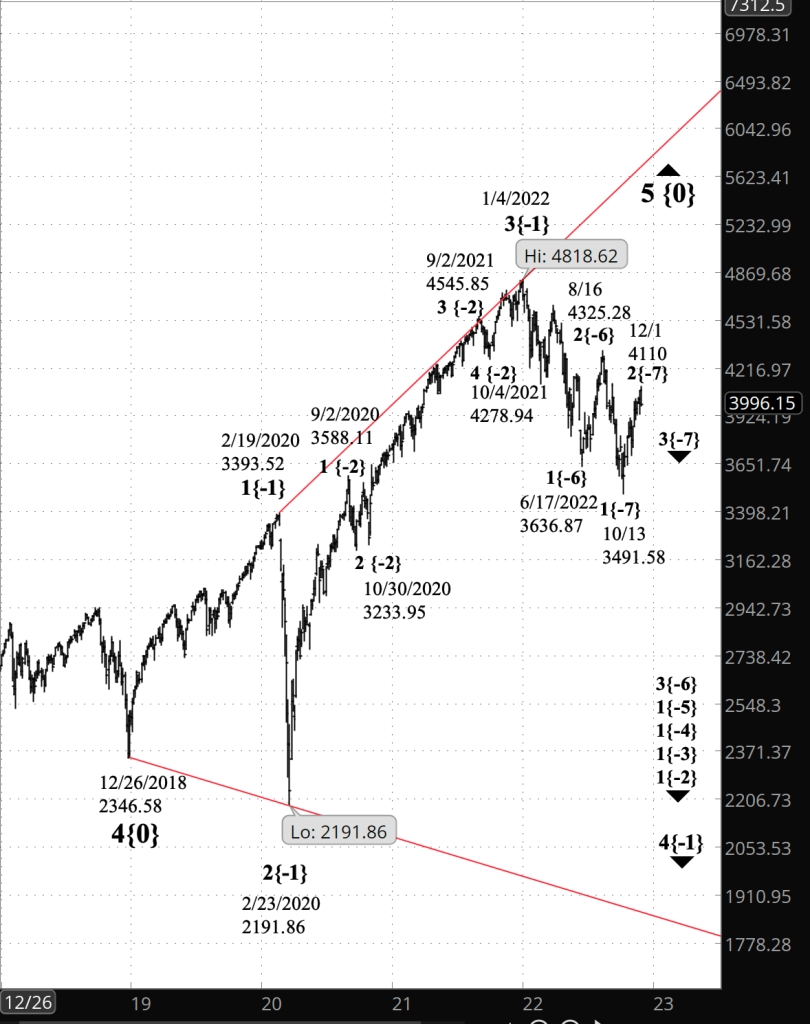
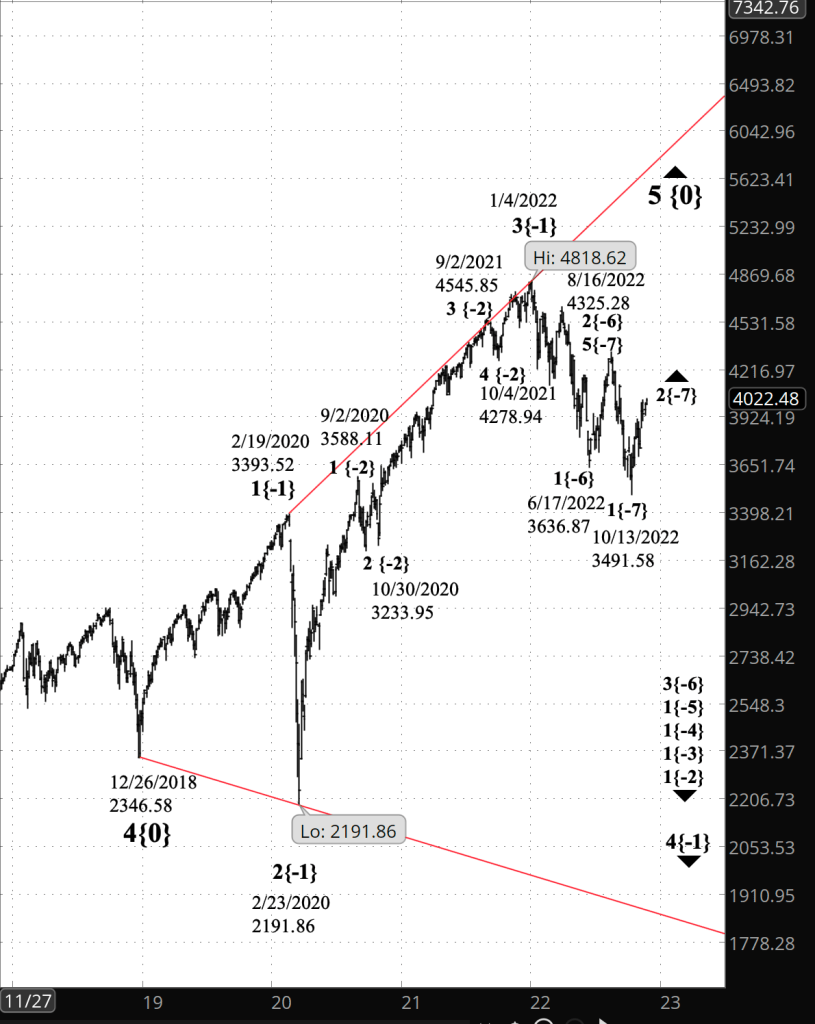
Within the fractal structures, wave 2{-7} and 3{-7} are subwaves of wave 3{-6}, which in turn is a subwave within a series of downtrending 1st waves of increasing size, reaching up to wave 1{-2}, which began on January 4. Wave 1{-2} is in turn a subwave of wave 4{-1}, the next to the last wave within an expanding Diagonal Triangle that began on December 26, 2018.
That fractal structure points to a lot of downwardness ahead, punctuated by occasional upward corrections.
We Are Here.
These are the waves currently in progress under my principal analysis. Each line on the list shows the wave number, with the subscript in curly brackets, the traditional degree name, the starting date, the starting price of the S&P 500 E-mini futures, and the direction of the wave.
- S&P 500 Index:
- 5{+3} Supercycle, 7/8/1932, 4.40 (up)
- 5{+2} Cycle, 12/9/1974, 60.96 (up)
- 5{+1} Primary, 3/6/2009, 666.79 (up)
- 5{0} Intermediate, 12/26/2018, 2346.58 (up)
- 4{-1} Minor, 1/4/2022 4818.62 (down)
- 1{-2} Minute, 1/4/2022 4818.62 (down)
- S&P 500 Futures and index:
- 1{-3} Minuette, 1/4/2022, 4808.25 (down) (futures), 4818.62 (down) (index)
- S&P 500 Futures:
- 1{-4} Subminuette, 1/4/2022, 4808.25 (down)
- 1{-5} Micro, 1/4/2022, 4808.25 (down)
- 3{-6} Submicro, 8/16/2022, 4327.50 (down)
- 3{-7} Minuscule, 12/1/2022, 4110 (down)
- 1{-8} Subminuscule, 12/1/2022, 4110 (down)
Learning and other resources. Elliott wave analysis provides context, not prophecy. As the 20th century semanticist Alfred Korzybski put it in his book Science and Sanity (1933), “The map is not the territory … The only usefulness of a map depends on similarity of structure between the empirical world and the map.” And I would add, in the ever-changing markets, we can judge that similarity of structure only after the fact.
See the menu page Analytical Methods for a rundown on where to go for information on Elliott wave analysis.
By Tim Bovee, Portland, Oregon, December 6, 2022
Disclaimer
Tim Bovee, Private Trader tracks the analysis and trades of a private trader for his own accounts. Nothing in this blog constitutes a recommendation to buy or sell stocks, options or any other financial instrument. The only purpose of this blog is to provide education and entertainment.
No trader is ever 100 percent successful in his or her trades. Trading in the stock and option markets is risky and uncertain. Each trader must make trading decisions for his or her own account, and take responsibility for the consequences.
License
All content on Tim Bovee, Private Trader by Timothy K. Bovee is licensed under a Creative Commons Attribution-ShareAlike 4.0 International License.
Based on a work at www.timbovee.com.


You must be logged in to post a comment.