Trader’s Notebook

3:30 p.m. New York time

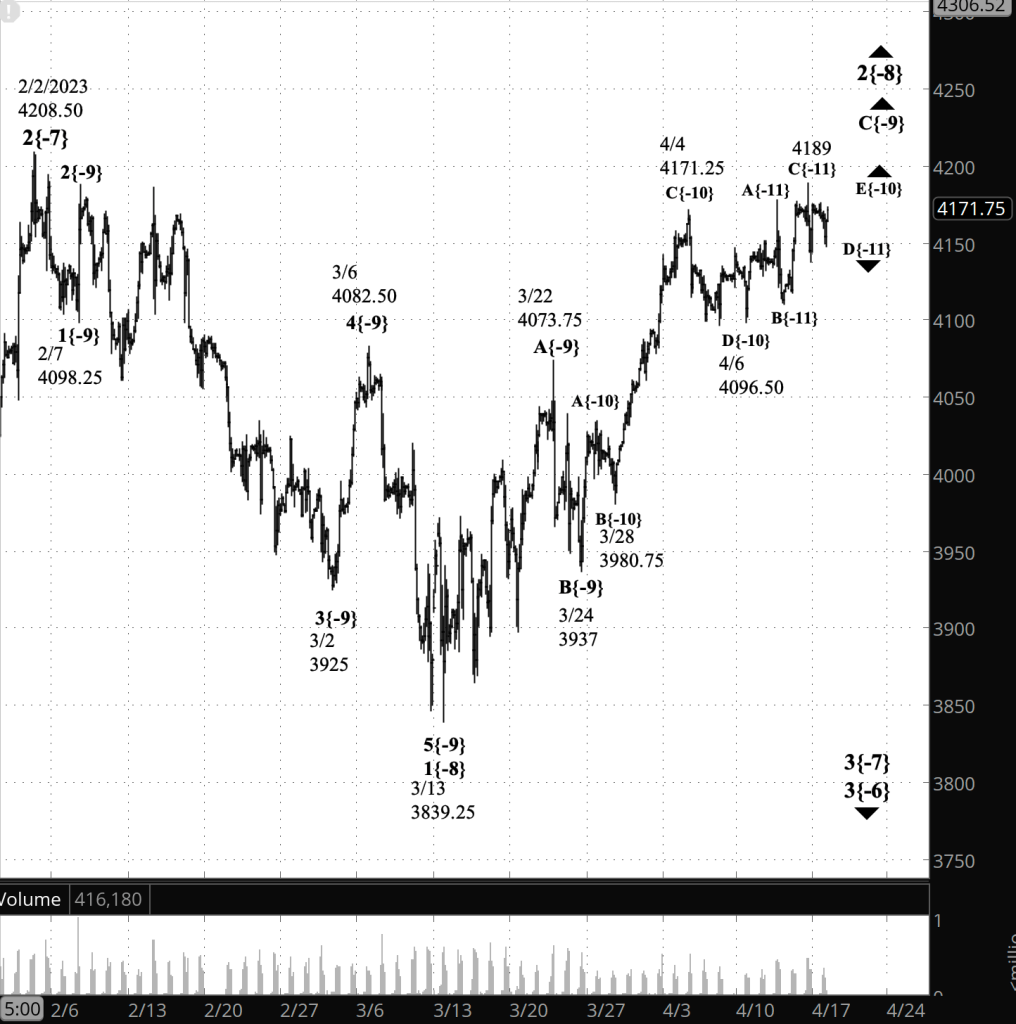
Half an hour before the closing bell. The S&P 500 futures continued to fall during the session, reaching 4164.50 and then bouncing a slightly. The further the price drops, the more likely it is that Alternative #1 is correct: The upward correction ended at the overnight high, 4198.25, and the long-anticipated downtrend has begun. Or not. If the price reverses to the upside and moves above the overnight high, then this morning’s principal analysis is correct.

I give the two possibilities equal odds at this point. I’ve updated this morning’s chart, leaving the principal analysis intact. And I’ve added a very short-term chart showing the futures since yesterday’s market close. And we shall see if tomorrow will allow a choice between the two possibilities. (Alternative #2, a compound correction, is also still in the mix.)

[S&P 500 E-mini futures, 5-minute bars, with volume]

9:35 a.m. New York time

What’s happening now? The S&P 500 E-mini futures rose overnight to 4198.25 as the opening bell approached.

What does it mean? There is very little upside left for the correction that began on March 13. This correction is a 2nd wave correction within a five-wave downtrend. Under the rules of Elliott wave analysis, a 2nd wave correction cannot move beyond the start of the 1st wave of the trend, which is 4208.50. If the price moves above that level, then the chart will be reanalyzed to eliminate the discrepancy. Ultimately, the chart is always right.

Internally, the correction is in its 3rd and final segment, which in turn in within its final subwave. So the end is very near.

The correction will be followed by an energetic downtrend that will carry the price below 3839.25 — the correction’s starting point — and most likely significantly lower.

What are the alternatives? There are two.

Alternative #1. For awhile now we’ve been in a situation where any high within the correction might be its end. The overnight high on today’s chart is no exception.

Alternative #2: Under this scenario, the overnight high marked the end of the corrective pattern but not of the correction, which is forming a compound structure, linking two or three corrective patterns together. If that’s the case, then the decline since Friday’s peak is a downward linking wave, which will be followed by a second corrective pattern.

Reading the chart. I’ve placed two red arrows on the chart, one showing the 4208.50 starting point of the 1st wave of the downtrend that began on February 2 and the other showing the overnight peak within the 2nd wave correction within the downtrend. Those two points define the possibilities of the S&P 500 futures.

Under the principal analysis, the 2nd wave correction cannot rise above that point. If it does, I’ll reanalyze the chart. When such surprises occur, it’s usually because the degrees used in the analysis don’t match the reality of the chart. The degrees of waves are difficult to assess until after a structure is complete. Before that, it’s an educated guess.

Elliott wave analysis views the chart as a complex structure of smaller waves nested within larger waves, which in turn are nested within still larger waves. My labeling system assigns numbers to the subwaves of trending waves, and letters to the subwaves of corrections. Each number or letter is followed by a subscript, in curly brackets, showing the waves position within the complex structure, called its “degree” in Elliott wave parlance. The smaller the number, the lower the degree. On this chart we’re dealing with relatively small waves, so the degree numbers are negative.

[S&P 500 E-mini futures at 9:35 a.m., 150-minute bars, with volume]

What does Elliott wave theory say? The analyses described above rely on these waves.

Principal analysis:

  • The upward correction that began on March 13 is wave 2{-8}.
  • Within it, wave C{-9}, the correction’s final wave of that degree, is in its final wave, rising wave E{-10}.
  • Under a rule of Elliott wave analysis, wave E{-10} cannot move above the starting point of the preceding wave 1{-8}, 4208.50.
  • Wave E{-10} is in its final subwave, E{-11}.
  • If wave 2{-8} and its subwaves, C{-9} and E{-10}, move above 4208.50, the starting point of wave 1{-8}, then then analysis will have broken a rule of Elliott wave analysis and a new analysis will be done.
  • Wave 2{-8} will be followed by a downtrend, wave 3{-8}, that will carry the price below the correction’s starting point, 3839.25, and most likely significantly below that level.

Alternative analysis #1:

  • Wave E{-10}, its child, wave E{-11}, and its parent, wave C{-9}, ended at the April 18 peak, bringing the upward correction, wave 2{-8} to an end.
  • Downtrending wave 3{-8} is underway.

Alternative analysis #2:

  • Wave 2{-8}, the upward correction, is forming a compound structure, linking together two or three corrective patterns.
  • Under that alternative, if it should occur, the present rising wave C{-9} will be followed by a declining connector wave, X{-9}, and then the first wave of a second corrective pattern.
  • The correction is a 2nd wave, and compounding is seen less often in 2nds. However, they do happen on occasion.

Bigger structures:

  • This is all happening within downtrending wave 3{-7}, which began on February 2.
  • Wave 3{-7} is a subwave of downtrending wave 3{-6}, which began on August 16, 2022.
  • Wave 3{-6} is encompassed by a series of larger declining waves, the smaller within the larger, stretching up five degrees to wave 4{-1}, which began on January 4, 2022.
  • Wave 4{-1} is the next-to-the-last wave within a large expanding Diagonal Triangle, wave 5{0}, that began on December 26, 2018
  • When wave 4{-1} is complete, wave 5{-1} will begin and will carry the wave above the January 4 high, 4808.25, and back to the upper boundary of the triangle, which gets higher continually and is in the 6090s.

We Are Here.

These are the waves currently in progress under my principal analysis. Each line on the list shows the wave number, with the subscript in curly brackets, the traditional degree name, the starting date, the starting price of the S&P 500 E-mini futures, and the direction of the wave.

  • S&P 500 Index:
  • 5{+3} Supercycle, 7/8/1932, 4.40 (up)
  • 5{+2} Cycle, 12/9/1974, 60.96 (up)
  • 5{+1} Primary, 3/6/2009, 666.79 (up)
  • 5{0} Intermediate, 12/26/2018, 2346.58 (up)
  • S&P 500 Futures and index:
  • 4{-1} Minor, 1/4/2022, 4808.25 (down) (futures), 4818.62 (down) (index)
  • S&P 500 Futures:
  • 1{-2} Minute, 1/4/2022, 4808.25 (down)
  • 1{-3} Minuette, 1/4/2022, 4808.25 (down)
  • 1{-4} Subminuette, 1/4/2022, 4808.25 (down)
  • 1{-5} Micro, 1/4/2022, 4808.25 (down)
  • 3{-6} Submicro, 8/16/2022, 4327.50 (down)
  • 3{-7} Minuscule, 2/2/2023, 4208.50 (down)

Learning and other resources. Elliott wave analysis provides context, not prophecy. As the 20th century semanticist Alfred Korzybski put it in his book Science and Sanity (1933), “The map is not the territory … The only usefulness of a map depends on similarity of structure between the empirical world and the map.” And I would add, in the ever-changing markets, we can judge that similarity of structure only after the fact.

See the menu page Analytical Methods for a rundown on where to go for information on Elliott wave analysis.

By Tim Bovee, Portland, Oregon, April 18, 2023

Disclaimer

Tim Bovee, Private Trader tracks the analysis and trades of a private trader for his own accounts. Nothing in this blog constitutes a recommendation to buy or sell stocks, options or any other financial instrument. The only purpose of this blog is to provide education and entertainment.

No trader is ever 100 percent successful in his or her trades. Trading in the stock and option markets is risky and uncertain. Each trader must make trading decisions for his or her own account, and take responsibility for the consequences.

License
Creative Commons License

All content on Tim Bovee, Private Trader by Timothy K. Bovee is licensed under a Creative Commons Attribution-ShareAlike 4.0 International License.

Based on a work at www.timbovee.com.
Trader’s Notebook

3:30 p.m. New York time

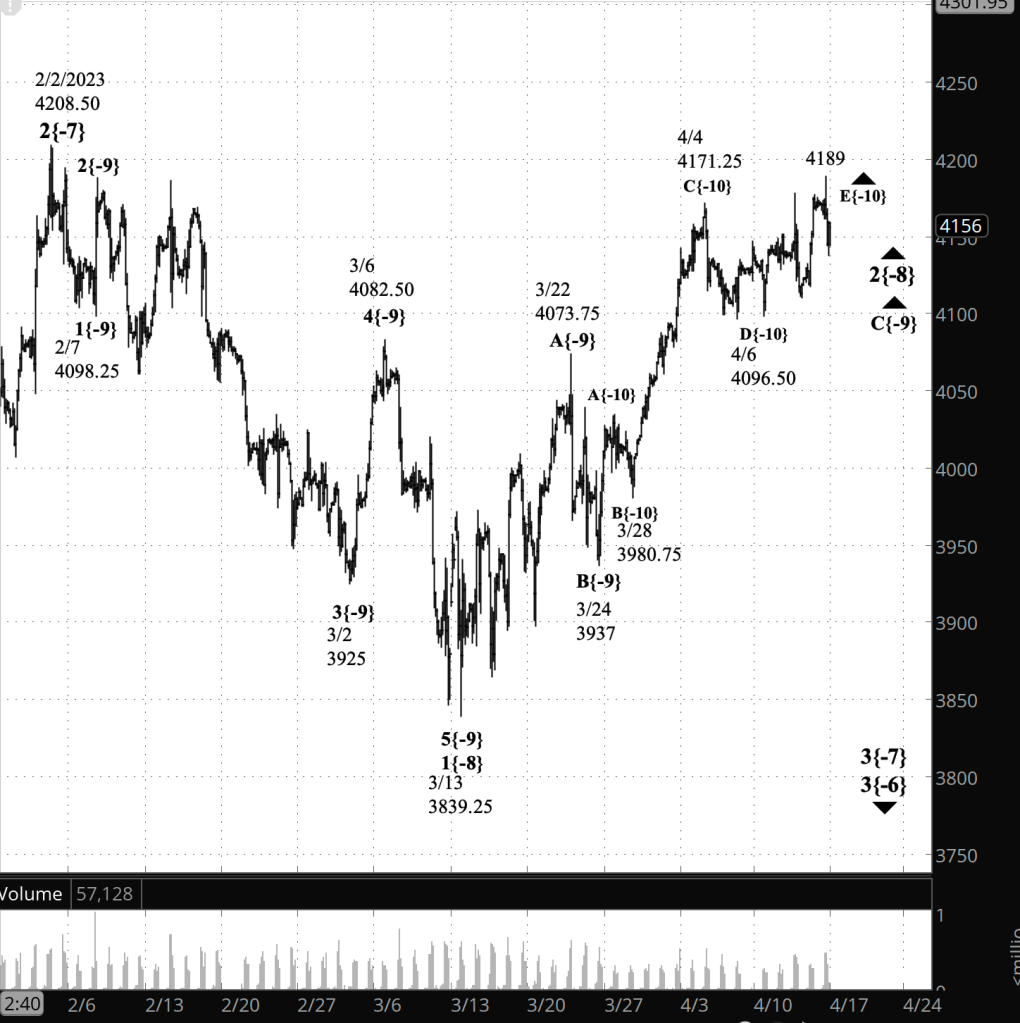
Half an hour before the closing bell. The S&P 500 futures fell during most of the session, down to 4148, and then rose sharply, reaching back into the 4170s, so far. This morning’s analysis remains unchanged. The upward correction, wave 2{-8}, that began on March 13 is still underway and is in its final segment, rising wave C{-9}. Drilling down one degree lower, wave rising E{-10} is in progress and internally is in its next to the last wave, declining wave D{-11}.

Alternatively, it’s possible that 4148 marked the end of wave D{-11} and the final wave, E{-11}, is underway. When E{-11} is complete, the correction will be complete, unless it takes a compound form, as discussed this morning.

I’ve updated the chart

9:35 a.m. New York time

What’s happening now? The S&P 500 E-mini futures traded sideways overnight, with a slight downward lean that carried it from the 4170s into the 4150s.

What does it mean? The upward correction that began on March 13 continues to work through its last leg within the correction’s 3rd and final wave . When complete, it will be followed by an energetic downtrend that will carry the price into the 3800s and likely lower.

What are the alternatives? There are two alternatives.

Alternative #1: The April 15 high, 4189, might be the end of the correction, and the decline that followed, the early steps of the downtrend. Choosing between this alternative and principal analysis depends upon how we analyze that last leg. Under the rules of Elliott wave analysis, it will have five subwaves. I count that peak as being the end of the 3rd wave. By that principal analysis, the present decline will be followed by a final push upward, likely above 4189. However, wave counts are sometimes a bit ambiguous, and I can’t rule out the alternative analysis.

Alternative #2: Under this scenario, Friday’s high marked the end of the corrective pattern but not of the correction, which is forming a compound structure, linking two or three corrective patterns together. If that’s the case, then the decline since Friday’s peak is a downward linking wave, which will be followed by a second corrective pattern.

[S&P 500 E-mini futures at 3:30 p.m., 140-minute bars, with volume]

What does Elliott wave theory say? Here’s how the waves line up, small to large.

Principal analysis:

  • The upward correction that began on March 13 is wave 2{-8}.
  • Within it, wave C{-9}, the correction’s final wave of that degree, is in its final wave, rising wave E{-10}.
  • Under a rule of Elliott wave analysis, wave E{-10} cannot move above the starting point of the preceding wave 1{-8}, 4208.50.
  • Wave E{-10} when complete will have five subwaves. It completed the 3rd wave, wave C{-11}, at the April 15 peak and is now in the next-to-the-last wave, D{-11}.
  • If wave 2{-8} and its subwaves, C{-9} and E{-10}, move above the starting point of wave 1{-8}, which was 4208.50, then then analysis will have broken a rule of Elliott wave analysis and a new analysis will be done.
  • Wave 2{-8} will be followed by a downtrend, wave 3{-8}, that will carry the price below the correction’s starting point, 3839.25, and most likely significantly below that level.

Alternative analysis #1:

  • Wave E{-10}, its child, wave E{-11}, and its parent, wave C{-9}, ended at the April 15 peak, 4189, bringing the upward correction, wave 2{-8} to an end.
  • Downtrending wave 3{-8} is underway.

Alternative analysis #2:

  • Wave 2{-8}, the upward correction, is forming a compound structure, linking together two or three corrective patterns.
  • Under that alternative, if it should occur, the present rising wave C{-9} will be followed by a declining connector wave, X{-9}, and then the first wave of a second corrective pattern.
  • The correction is a 2nd wave, and compounding is seen less often in 2nds. However, they do happen on occasion.

Bigger structures:

  • This is all happening within downtrending wave 3{-7}, which began on February 2.
  • Wave 3{-7} is a subwave of downtrending wave 3{-6}, which began on August 16, 2022.
  • Wave 3{-6} is encompassed by a series of larger declining waves, the smaller within the larger, stretching up five degrees to wave 4{-1}, which began on January 4, 2022.
  • Wave 4{-1} is the next-to-the-last wave within a large expanding Diagonal Triangle, wave 5{0}, that began on December 26, 2018
  • When wave 4{-1} is complete, wave 5{-1} will begin and will carry the wave above the January 4 high, 4808.25, and back to the upper boundary of the triangle, which gets higher continually and is in the 6090s.

Reading the chart. Elliott wave analysis views the chart as a complex structure of smaller waves nested within larger waves, which in turn are nested within still larger waves. My labeling system assigns numbers to the subwaves of trending waves, and letters to the subwaves of corrections. Each number or letter is followed by a subscript, in curly brackets, showing the waves position within the complex structure, called its “degree” in Elliott wave parlance. The smaller the number, the lower the degree. On this chart we’re dealing with relatively small waves, so the degree numbers are negative.

We Are Here.

These are the waves currently in progress under my principal analysis. Each line on the list shows the wave number, with the subscript in curly brackets, the traditional degree name, the starting date, the starting price of the S&P 500 E-mini futures, and the direction of the wave.

  • S&P 500 Index:
  • 5{+3} Supercycle, 7/8/1932, 4.40 (up)
  • 5{+2} Cycle, 12/9/1974, 60.96 (up)
  • 5{+1} Primary, 3/6/2009, 666.79 (up)
  • 5{0} Intermediate, 12/26/2018, 2346.58 (up)
  • S&P 500 Futures and index:
  • 4{-1} Minor, 1/4/2022, 4808.25 (down) (futures), 4818.62 (down) (index)
  • S&P 500 Futures:
  • 1{-2} Minute, 1/4/2022, 4808.25 (down)
  • 1{-3} Minuette, 1/4/2022, 4808.25 (down)
  • 1{-4} Subminuette, 1/4/2022, 4808.25 (down)
  • 1{-5} Micro, 1/4/2022, 4808.25 (down)
  • 3{-6} Submicro, 8/16/2022, 4327.50 (down)
  • 3{-7} Minuscule, 2/2/2023, 4208.50 (down)

Learning and other resources. Elliott wave analysis provides context, not prophecy. As the 20th century semanticist Alfred Korzybski put it in his book Science and Sanity (1933), “The map is not the territory … The only usefulness of a map depends on similarity of structure between the empirical world and the map.” And I would add, in the ever-changing markets, we can judge that similarity of structure only after the fact.

See the menu page Analytical Methods for a rundown on where to go for information on Elliott wave analysis.

By Tim Bovee, Portland, Oregon, April 17, 2023

Disclaimer

Tim Bovee, Private Trader tracks the analysis and trades of a private trader for his own accounts. Nothing in this blog constitutes a recommendation to buy or sell stocks, options or any other financial instrument. The only purpose of this blog is to provide education and entertainment.

No trader is ever 100 percent successful in his or her trades. Trading in the stock and option markets is risky and uncertain. Each trader must make trading decisions for his or her own account, and take responsibility for the consequences.

License
Creative Commons License

All content on Tim Bovee, Private Trader by Timothy K. Bovee is licensed under a Creative Commons Attribution-ShareAlike 4.0 International License.

Based on a work at www.timbovee.com.
Trader’s Notebook

3:30 p.m. New York time

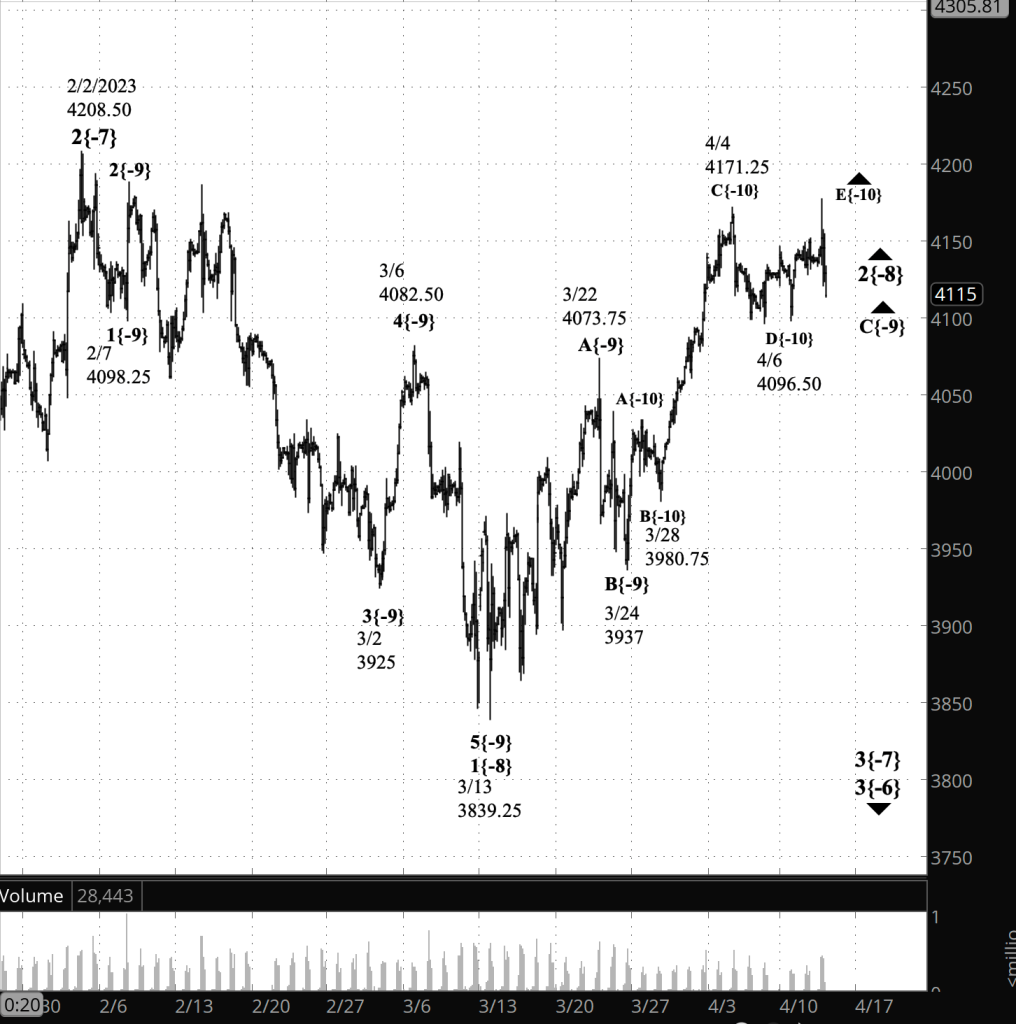
Half an hour before the closing bell. The S&P 500 futures reached a high of 4189 early in the session and then declined back into the 4140s. Wave E{-10} within wave C{-9} within the upward correction, wave 2{-8}, is still underway. Or perhaps not. The 4189 peak may well be the end of the correction and the start of a downtrend, wave 3{-8}. Given the 4208.50 upper limit for the correction under the rules of Elliott wave analysis, 4189 is a reasonable end point. Yet wave E{-10} ought to have five internal waves, and I find the count to be a bit ambiguous. So I’m holding to this morning’s scenario for now and will await with interest what Monday brings. I’ve updated the chart.

9:35 a.m. New York time

What’s happening now? The S&P 500 E-mini futures rose back into the 4170s as the opening bell approached,

What does it mean? The same as yesterday: The upward correction that began March 13 is nearing its end. An energetic downtrend will follow. At this point any high could be the end of the correction. The correction high so far is 4177.75, attained on April 12.

What are the alternatives? It’s possible that the April 12 high was the end of the correction and the tentative first steps of the downtrend are underway

It’s also possible that the correction is forming a compound structure, linking two or three corrective patterns together. If that’s the case, then the end of the 3rd wave within the correction will be followed by a downward linking wave, and then a second corrective pattern.

[S&P 500 E-mini futures at 3:30 p.m., 140-minute bars, with volume]

What does Elliott wave theory say? Here is a discussion of waves important to the analysis.

Principal analysis:

  • The upward correction that began on March 13 is wave 2{-8}.
  • Within it, wave C{-9}, the correction’s final wave of that degree, is in its final wave, rising wave E{-10}.
  • Wave E{-10} will likely rise above the preceding wave D{-10}’s starting point, 4l71.25, but under a rule of Elliott wave analysis, cannot move above the starting point of the wave 2{-8} correction itself, 4208.50.
  • Down one degree, wave C{-9} is the final wave within that correction.
  • If wave 2{-8} and its subwaves, C{-9} and E{-10}, move above the starting point of wave 1{-8}, which was 4208.50, then then analysis will have broken a rule of Elliott wave analysis and a new analysis will be done.
  • Wave 2{-8} will be followed by a downtrend, wave 3{-8}, that will carry the price below the correction’s starting point, 3839.25, and most likely significantly below that level.

Alternative analysis #1:

  • Wave E{-10} and its parent, wave C{-9}, ended at the April 12 peak, bringing the upward correction, wave 2{-8} to an end.
  • Downtrending wave 3{-8} is underway.

Alternative analysis #2:

  • Wave 2{-8}, the upward correction, will form a compound structure, linking together two or three corrective patterns.
  • Under that alternative, if it should occur, the present rising wave C{-9} will be followed by a declining connector wave, X{-9}, and then the first wave of a second corrective pattern.
  • The correction is a 2nd wave, and compounding is seen less often in 2nds. However, they do happen on occasion.

Bigger structures:

  • This is all happening within downtrending wave 3{-7}, which began on February 2.
  • Wave 3{-7} is a subwave of downtrending wave 3{-6}, which began on August 16, 2022.
  • Wave 3{-6} is encompassed by a series of larger declining waves, the smaller within the larger, stretching up five degrees to wave 4{-1}, which began on January 4, 2022.
  • Wave 4{-1} is the next-to-the-last wave within a large expanding Diagonal Triangle, wave 5{0}, that began on December 26, 2018
  • When wave 4{-1} is complete, wave 5{-1} will begin and will carry the wave above the January 4 high, 4808.25, and back to the upper boundary of the triangle, which gets higher continually and is in the 6090s.

Reading the chart. Elliott wave analysis views the chart as a complex structure of smaller waves nested within larger waves, which in turn are nested within still larger waves. My labeling system assigns numbers to the subwaves of trending waves, and letters to the subwaves of corrections. Each number or letter is followed by a subscript, in curly brackets, showing the waves position within the complex structure, called its “degree” in Elliott wave parlance. The smaller the number, the lower the degree. On this chart we’re dealing with relatively small waves, so the degree numbers are negative.

We Are Here.

These are the waves currently in progress under my principal analysis. Each line on the list shows the wave number, with the subscript in curly brackets, the traditional degree name, the starting date, the starting price of the S&P 500 E-mini futures, and the direction of the wave.

  • S&P 500 Index:
  • 5{+3} Supercycle, 7/8/1932, 4.40 (up)
  • 5{+2} Cycle, 12/9/1974, 60.96 (up)
  • 5{+1} Primary, 3/6/2009, 666.79 (up)
  • 5{0} Intermediate, 12/26/2018, 2346.58 (up)
  • S&P 500 Futures and index:
  • 4{-1} Minor, 1/4/2022, 4808.25 (down) (futures), 4818.62 (down) (index)
  • S&P 500 Futures:
  • 1{-2} Minute, 1/4/2022, 4808.25 (down)
  • 1{-3} Minuette, 1/4/2022, 4808.25 (down)
  • 1{-4} Subminuette, 1/4/2022, 4808.25 (down)
  • 1{-5} Micro, 1/4/2022, 4808.25 (down)
  • 3{-6} Submicro, 8/16/2022, 4327.50 (down)
  • 3{-7} Minuscule, 2/2/2023, 4208.50 (down)

Learning and other resources. Elliott wave analysis provides context, not prophecy. As the 20th century semanticist Alfred Korzybski put it in his book Science and Sanity (1933), “The map is not the territory … The only usefulness of a map depends on similarity of structure between the empirical world and the map.” And I would add, in the ever-changing markets, we can judge that similarity of structure only after the fact.

See the menu page Analytical Methods for a rundown on where to go for information on Elliott wave analysis.

By Tim Bovee, Portland, Oregon, April 14, 2023

Disclaimer

Tim Bovee, Private Trader tracks the analysis and trades of a private trader for his own accounts. Nothing in this blog constitutes a recommendation to buy or sell stocks, options or any other financial instrument. The only purpose of this blog is to provide education and entertainment.

No trader is ever 100 percent successful in his or her trades. Trading in the stock and option markets is risky and uncertain. Each trader must make trading decisions for his or her own account, and take responsibility for the consequences.

License
Creative Commons License

All content on Tim Bovee, Private Trader by Timothy K. Bovee is licensed under a Creative Commons Attribution-ShareAlike 4.0 International License.

Based on a work at www.timbovee.com.

Trader’s Notebook

3:30 p.m. New York time

Half an hour before the closing bell. The S&P 500 futures rose during the session, reaching in to the 4170s. The upward correction, wave 2{-8}, has shown all of the characteristics of being complete, although it may have a bit more to go. As noted in prior posts, a rise above 4208.50, the start of wave 1{-8}, would violate a rule of Elliott wave analysis, requiring a revision of the analysis. This morning’s analysis stands unchanged. I’ve updated the chart.

9:35 a.m. New York time

What’s happening now? The S&P 500 E-mini futures reached a low overnight of 4110.25 and then rose back into the 4130s.

What does it mean? The upward correction that began on March 13 continues to work through its last stage, the last subwave within the 3rd wave and final wave of the correction. The correction ends when the 3rd wave ends, and an energetic downtrend will follow, carrying the price below 3839.25, the correction’s starting point, and likely a significant distance below that level.

What are the alternatives? It’s possible that the 3rd wave will end a corrective pattern but not the correction itself. Some corrections form a compound structure, linking two or three corrective patterns together. If that happens, then the 3rd wave will be followed by a downward wave that will connect the completed first corrective pattern with a second corrective pattern.

[S&P 500 E-mini futures at 3:30 p.m., 140-minute bars, with volume]

What does Elliott wave theory say? Here is a discussion of waves important to the analysis.

Principal analysis:

  • The upward correction that began on March 13 is wave 2{-8}.
  • Within it, wave C{-9}, the correction’s final wave of that degree, is in its final wave, rising wave E{-10}.
  • Wave E{-10} will likely rise above the preceding wave D{-10}’s starting point, 4l71.25, but under a rule of Elliott wave analysis, cannot move above the starting point of the wave 2{-8} correction itself, 4208.50.
  • Down one degree, wave C{-9} is the final wave within that correction.
  • If wave 2{-8} and its subwaves, C{-9} and E{-10}, move above the starting point of wave 1{-8}, which was 4208.50, then then analysis will have broken a rule of Elliott wave analysis and a new analysis will be done.
  • Wave 2{-8} will be followed by a downtrend, wave 3{-8}, that will carry the price below the correction’s starting point, 3839.25, and most likely significantly below that level.

Alternative analysis:

  • Wave 2{-8}, the upward correction, will form a compound structure, linking together two or three corrective patterns.
  • Under that alternative, if it should occur, the present rising wave C{-9} will be followed by a declining connector wave, X{-9}, and then the first wave of a second corrective pattern.
  • The correction is a 2nd wave, and compounding is seen less often in 2nds. However, they do happen on occasion.

Bigger structures:

  • This is all happening within downtrending wave 3{-7}, which began on February 2.
  • Wave 3{-7} is a subwave of downtrending wave 3{-6}, which began on August 16, 2022.
  • Wave 3{-6} is encompassed by a series of larger declining waves, the smaller within the larger, stretching up five degrees to wave 4{-1}, which began on January 4, 2022.
  • Wave 4{-1} is the next-to-the-last wave within a large expanding Diagonal Triangle, wave 5{0}, that began on December 26, 2018
  • When wave 4{-1} is complete, wave 5{-1} will begin and will carry the wave above the January 4 high, 4808.25, and back to the upper boundary of the triangle, which gets higher continually and is in the 6090s.

Reading the chart. Elliott wave analysis views the chart as a complex structure of smaller waves nested within larger waves, which in turn are nested within still larger waves. My labeling system assigns numbers to the subwaves of trending waves, and letters to the subwaves of corrections. Each number or letter is followed by a subscript, in curly brackets, showing the waves position within the complex structure, called its “degree” in Elliott wave parlance. The smaller the number, the lower the degree. On this chart we’re dealing with relatively small waves, so the degree numbers are negative.

We Are Here.

These are the waves currently in progress under my principal analysis. Each line on the list shows the wave number, with the subscript in curly brackets, the traditional degree name, the starting date, the starting price of the S&P 500 E-mini futures, and the direction of the wave.

  • S&P 500 Index:
  • 5{+3} Supercycle, 7/8/1932, 4.40 (up)
  • 5{+2} Cycle, 12/9/1974, 60.96 (up)
  • 5{+1} Primary, 3/6/2009, 666.79 (up)
  • 5{0} Intermediate, 12/26/2018, 2346.58 (up)
  • S&P 500 Futures and index:
  • 4{-1} Minor, 1/4/2022, 4808.25 (down) (futures), 4818.62 (down) (index)
  • S&P 500 Futures:
  • 1{-2} Minute, 1/4/2022, 4808.25 (down)
  • 1{-3} Minuette, 1/4/2022, 4808.25 (down)
  • 1{-4} Subminuette, 1/4/2022, 4808.25 (down)
  • 1{-5} Micro, 1/4/2022, 4808.25 (down)
  • 3{-6} Submicro, 8/16/2022, 4327.50 (down)
  • 3{-7} Minuscule, 2/2/2023, 4208.50 (down)

Learning and other resources. Elliott wave analysis provides context, not prophecy. As the 20th century semanticist Alfred Korzybski put it in his book Science and Sanity (1933), “The map is not the territory … The only usefulness of a map depends on similarity of structure between the empirical world and the map.” And I would add, in the ever-changing markets, we can judge that similarity of structure only after the fact.

See the menu page Analytical Methods for a rundown on where to go for information on Elliott wave analysis.

By Tim Bovee, Portland, Oregon, April 13, 2023

Disclaimer

Tim Bovee, Private Trader tracks the analysis and trades of a private trader for his own accounts. Nothing in this blog constitutes a recommendation to buy or sell stocks, options or any other financial instrument. The only purpose of this blog is to provide education and entertainment.

No trader is ever 100 percent successful in his or her trades. Trading in the stock and option markets is risky and uncertain. Each trader must make trading decisions for his or her own account, and take responsibility for the consequences.

License
Creative Commons License

All content on Tim Bovee, Private Trader by Timothy K. Bovee is licensed under a Creative Commons Attribution-ShareAlike 4.0 International License.

Based on a work at www.timbovee.com.
Trader’s Notebook

3:30 p.m. New York time

Half an hour before the closing bell. The S&P 500 futures fell during the session, reaching into the 4110s as the closing bell approached. The last leg of the upward correction that began on March 13 is nearing its end. Rising wave E{-10} within rising wave C{-9} within the correction, wave 2{-9}, are underway. The end of one will be the end of all and the beginning of an energetic downtrend, wave 3{-8}. No change from this morning’s analysis. I’ve updated the chart.

9:35 a.m. New York time

What’s happening now? The S&P 500 E-mini futures rose 39 points in six minutes, to 4177.75, after new inflation numbers showed a 0.1% rise in the consumer price index in March. The price then declined to the 4160s as the opening bell approached. The last time inflation increased so little was in December 2022. Rising prices picked up speed in January, at 0.4%, and February, 0.5%.

What does it mean? The last leg of the upward correction that began on March 13 has entered its final subwave. The end of the subwave will bring the correction to a close and will begin an energetic downtrend that will carry the price below the correction’s starting point, 3839.25, and perhaps significantly below that level.

The final subwave now underway, along with the larger correction, is limited in how far can rise. Under the rules of Elliott wave analysis, the price must not move above the starting point of the preceding downtrend, which began on February 2 from 4208.50. If the price moves above that level, then the analysis no longer matches the reality on the chart and must be redone.

What are the alternatives? The rise that began overnight is the final subwave within the 3rd wave of the upward correction. It’s possible that the 3rd wave will be the end of a corrective pattern but not of the correction itself. Some corrections form a compound structure, linking two or three corrective patterns together. The present correction is the 2nd of five waves within a downtrend. Compound corrections are far more common in 4th waves. Nonetheless, 2nd-wave compound corrections aren’t unheard of.

[S&P 500 E-mini futures at 3:30 p.m., 180-minute bars, with volume]

What does Elliott wave theory say? The rise that began overnight is wave E{-10} within rising wave C{-9}, the last leg of the upward correction, wave 2{-8}, that began on March 13. Wave E{-10} is the final subwave within wave C{-9}.

Here is a discussion of waves important to the analysis.

Principal analysis:

  • The upward correction that began on March 13 is wave 2{-8}.
  • Down one degree, wave C{-9} is the final wave within that correction.
  • If wave 2{-8} and its subwavs, C{-9} and E{-10}, move above the starting point of wave 1{-8}, which was 4208.50, then then analysis will have broken a rule of Elliott wave analysis and a new analysis will be done.
  • Wave 2{-8} will be followed by a downtrend, wave 3{-8}, that will carry the price below the correction’s starting point, 3839.25, and most likely significantly below that level.

Alternative analysis:

  • Wave 2{-8}, the upward correction, will form a compound structure, linking together two or three corrective patterns.
  • Under that alternative, if it should occur, the present rising wave C{-9} will be followed by a declining connector wave, X{-9}, and then the first wave of a second corrective pattern.
  • The correction is a 2nd wave, and compounding is seen less often in 2nds. However, they do happen on occasion.

Bigger structures:

  • This is all happening within downtrending wave 3{-7}, which began on February 2.
  • Wave 3{-7} is a subwave of downtrending wave 3{-6}, which began on August 16, 2022.
  • Wave 3{-6} is encompassed by a series of larger declining waves, the smaller within the larger, stretching up five degrees to wave 4{-1}, which began on January 4, 2022.
  • Wave 4{-1} is the next-to-the-last wave within a large expanding Diagonal Triangle, wave 5{0}, that began on December 26, 2018
  • When wave 4{-1} is complete, wave 5{-1} will begin and will carry the wave above the January 4 high, 4808.25, and back to the upper boundary of the triangle, which gets higher continually and is in the 6090s.

Reading the chart. Elliott wave analysis views the chart as a complex structure of smaller waves nested within larger waves, which in turn are nested within still larger waves. My labeling system assigns numbers to the subwaves of trending waves, and letters to the subwaves of corrections. Each number or letter is followed by a subscript, in curly brackets, showing the waves position within the complex structure, called its “degree” in Elliott wave parlance. The smaller the number, the lower the degree. On this chart we’re dealing with relatively small waves, so the degree numbers are negative.

We Are Here.

These are the waves currently in progress under my principal analysis. Each line on the list shows the wave number, with the subscript in curly brackets, the traditional degree name, the starting date, the starting price of the S&P 500 E-mini futures, and the direction of the wave.

  • S&P 500 Index:
  • 5{+3} Supercycle, 7/8/1932, 4.40 (up)
  • 5{+2} Cycle, 12/9/1974, 60.96 (up)
  • 5{+1} Primary, 3/6/2009, 666.79 (up)
  • 5{0} Intermediate, 12/26/2018, 2346.58 (up)
  • S&P 500 Futures and index:
  • 4{-1} Minor, 1/4/2022, 4808.25 (down) (futures), 4818.62 (down) (index)
  • S&P 500 Futures:
  • 1{-2} Minute, 1/4/2022, 4808.25 (down)
  • 1{-3} Minuette, 1/4/2022, 4808.25 (down)
  • 1{-4} Subminuette, 1/4/2022, 4808.25 (down)
  • 1{-5} Micro, 1/4/2022, 4808.25 (down)
  • 3{-6} Submicro, 8/16/2022, 4327.50 (down)
  • 3{-7} Minuscule, 2/2/2023, 4208.50 (down)

Learning and other resources. Elliott wave analysis provides context, not prophecy. As the 20th century semanticist Alfred Korzybski put it in his book Science and Sanity (1933), “The map is not the territory … The only usefulness of a map depends on similarity of structure between the empirical world and the map.” And I would add, in the ever-changing markets, we can judge that similarity of structure only after the fact.

See the menu page Analytical Methods for a rundown on where to go for information on Elliott wave analysis.

By Tim Bovee, Portland, Oregon, April 12, 2023

Disclaimer

Tim Bovee, Private Trader tracks the analysis and trades of a private trader for his own accounts. Nothing in this blog constitutes a recommendation to buy or sell stocks, options or any other financial instrument. The only purpose of this blog is to provide education and entertainment.

No trader is ever 100 percent successful in his or her trades. Trading in the stock and option markets is risky and uncertain. Each trader must make trading decisions for his or her own account, and take responsibility for the consequences.

License
Creative Commons License

All content on Tim Bovee, Private Trader by Timothy K. Bovee is licensed under a Creative Commons Attribution-ShareAlike 4.0 International License.

Based on a work at www.timbovee.com.

Trader’s Notebook

3:30 p.m. New York time

Half an hour before the closing bell. The S&P 500 rose during the session, with the futures reaching a high so far of 4151.25. No change in this morning’s analysis. The 4th subwave, declining wave D{-10}, within the final segment, rising wave C{-9}, within the upward correction that began on March 13, wave 2{-8}, continues. I’ve updated the chart.

9:35 a.m. New York time

What’s happening now? The S&P 500 E-mini futures rose overnight to 4149, remaining below the start of the downward movement that began on April 4 from 4171.25.

What does it mean? The downward movement is the 4th of five subwaves within the final wave of an upward correction that began on March 13. It’s possible that the 4th subwave ended at the April 6 low, 4096,50. That would be a 39% retracement of the preceding subwave — disproportionally small but not by a lot. For now I’m sticking with the scenario that sees the 4th subwave as being underway, but the closer the price approaches to the 4175.25 peak, the more likely I’ll be to switching to a scenario that sees the 5th subwave as having begun from the April 6 low.

With either scenario, the end of the 5th subwave will also be the end of the entire upward correction, which will be followed by a significant downtrend that will carry the price below the correction’s starting point, 3839.25, and perhaps well below that level.

What are the alternatives? It’s possible that the third wave within the correction will be the end of a corrective pattern but not of the correction itself. Some corrections form a compound structure, linking two or three corrective patterns together. The present correction is the 2nd of five waves in a downtrend. Compound corrections are far more common in 4th waves. Nonetheless, 2nd-wave compound corrections aren’t unheard of.

[S&P 500 E-mini futures at e:30 p.m., 180-minute bars, with volume]

What does Elliott wave theory say? The decline that began on April 4 is wave D{-10} within rising wave C{-9}, the last leg of the upward correction, wave 2{-8}, that began on March 13. It’s possible that wave D{-10} ended on April 6 and that wave E{-10}, the final subwave within wave C{-9}, has begun. I’m not yet ready to switch to the wave E{-10} scenario, because of the proportionality of the retracement, discussed above in the “What does it mean?” section.

Here is the line-up waves important to the analysis.

Principal analysis:

  • The upward correction that began on March 13 is wave 2{-8}.
  • Down one degree, wave C{-9} is the final wave within that correction.
  • Within that final wave, declining wave D{-10} is underway, It will be followed by wave E{-10}, which likely will carry the price above the April 4 high, 4171.25.
  • If wave 2{-8} moves above the starting point of wave 1{-8}, from 4208.50, then then analysis will have broken a rule of Elliott wave analysis and will be redone.
  • Wave 2{-8} will be followed by a downtrend, wave 3{-8}, that will carry the price below the correction’s starting point, 3839.25, and most likely significantly below that level.

Alternative analysis:

  • Wave 2{-8}, the upward correction, will form a compound structure, linking together two or three corrective patterns.
  • Under that alternative, if it should occur, the present rising wave C{-9} will be followed by a declining connector wave, X{-9}, and then the first wave of a second corrective pattern.
  • The correction is a 2nd wave, and compounding is seen less often in 2nds. However, they do happen on occasion.

Bigger structures:

  • This is all happening within downtrending wave 3{-7}, which began on February 2.
  • Wave 3{-7} is a subwave of downtrending wave 3{-6}, which began on August 16, 2022.
  • Wave 3{-6} is encompassed by a series of larger declining waves, the smaller within the larger, stretching up five degrees to wave 4{-1}, which began on January 4, 2022.
  • Wave 4{-1} is the next-to-the-last wave within a large expanding Diagonal Triangle, wave 5{0}, that began on December 26, 2018
  • When wave 4{-1} is complete, wave 5{-1} will begin and will carry the wave above the January 4 high, 4808.25, and back to the upper boundary of the triangle, which gets higher continually and is in the 6090s.

Reading the chart. Elliott wave analysis views the chart as a complex structure of smaller waves nested within larger waves, which in turn are nested within still larger waves. My labeling system assigns numbers to the subwaves of trending waves, and letters to the subwaves of corrections. Each number or letter is followed by a subscript, in curly brackets, showing the waves position within the complex structure, called its “degree” in Elliott wave parlance. The smaller the number, the lower the degree. On this chart we’re dealing with relatively small waves, so the degree numbers are negative.

We Are Here.

These are the waves currently in progress under my principal analysis. Each line on the list shows the wave number, with the subscript in curly brackets, the traditional degree name, the starting date, the starting price of the S&P 500 E-mini futures, and the direction of the wave.

  • S&P 500 Index:
  • 5{+3} Supercycle, 7/8/1932, 4.40 (up)
  • 5{+2} Cycle, 12/9/1974, 60.96 (up)
  • 5{+1} Primary, 3/6/2009, 666.79 (up)
  • 5{0} Intermediate, 12/26/2018, 2346.58 (up)
  • S&P 500 Futures and index:
  • 4{-1} Minor, 1/4/2022, 4808.25 (down) (futures), 4818.62 (down) (index)
  • S&P 500 Futures:
  • 1{-2} Minute, 1/4/2022, 4808.25 (down)
  • 1{-3} Minuette, 1/4/2022, 4808.25 (down)
  • 1{-4} Subminuette, 1/4/2022, 4808.25 (down)
  • 1{-5} Micro, 1/4/2022, 4808.25 (down)
  • 3{-6} Submicro, 8/16/2022, 4327.50 (down)
  • 3{-7} Minuscule, 2/2/2023, 4208.50 (down)

Learning and other resources. Elliott wave analysis provides context, not prophecy. As the 20th century semanticist Alfred Korzybski put it in his book Science and Sanity (1933), “The map is not the territory … The only usefulness of a map depends on similarity of structure between the empirical world and the map.” And I would add, in the ever-changing markets, we can judge that similarity of structure only after the fact.

See the menu page Analytical Methods for a rundown on where to go for information on Elliott wave analysis.

By Tim Bovee, Portland, Oregon, April 11, 2023

Disclaimer

Tim Bovee, Private Trader tracks the analysis and trades of a private trader for his own accounts. Nothing in this blog constitutes a recommendation to buy or sell stocks, options or any other financial instrument. The only purpose of this blog is to provide education and entertainment.

No trader is ever 100 percent successful in his or her trades. Trading in the stock and option markets is risky and uncertain. Each trader must make trading decisions for his or her own account, and take responsibility for the consequences.

License
Creative Commons License

All content on Tim Bovee, Private Trader by Timothy K. Bovee is licensed under a Creative Commons Attribution-ShareAlike 4.0 International License.

Based on a work at www.timbovee.com.

Trader’s Notebook

3:30 p.m. New York time

Half an hour before the closing bell. The S&P 500 futures reached a low of 4098.75 at the session opening and rose thereafter, reaching back into the 4130s so far. The next to the last subwave, D{-10} within the final wave, C{-9}, within the upward correction that began on March 13, wave 2{-8}, continues. No change from this morning’s analysis. I’ve updated the chart.

9:35 a.m. New York time

What’s happening now? The S&P 500 E-mini futures fell overnight, from the 4140s to a low so far of 4100.

What does it mean? The rising final wave of an upward correction that began on March 13 continues and is in its declining next-to-the-last subwave. The final subwave, if it is typical, will carry the price above 4171.25, the prior high point of the correction, although it’s not a certainty.

The end of that final subwave will also be the end of the correction, which will be followed by an energetic downtrend that will carry the price below 3839.25 — the correction’s starting point — and perhaps significantly below that level.

What are the alternatives? It’s possible that the third wave within the correction will be the end of a corrective pattern but not of the correction itself. Some corrections form a compound structure, linking two or three corrective patterns together. The present correction is the 2nd of five waves in a downtrend. Compound corrections are far more common in 4th waves. Nonetheless, 2nd-wave compound corrections aren’t unheard of.

[S&P 500 E-mini futures at 3:30 p.m., 180-minute bars, with volume]

What does Elliott wave theory say? The decline that began on April 4 is wave D{-10} within rising wave C{-9}, the last leg of the upward correction, wave 2{-8}, that began on March 13. .

Here are the other waves that underly the analysis.

Principal analysis:

  • The upward correction that began on March 13 is wave 2{-8}.
  • Down one degree, wave C{-9} is the final wave within that correction.
  • Within that final wave, declining wave D{-10} is underway, It will be followed by wave E{-10}, which likely will carry the price above the April 4 high, 4171.25.
  • If wave 2{-8} moves above the starting point of wave 1{-8}, from 4208.50, then then analysis will have broken a rule of Elliott wave analysis and will be redone.
  • Wave 2{-8} will be followed by a downtrend, wave 3{-8}, that will carry the price below the correction’s starting point, 3839.25, and most likely significantly below that level.

Alternative analysis:

  • Wave 2{-8}, the upward correction, will form a compound structure, linking together two or three corrective patterns.
  • Under that alternative, if it should occur, the present rising wave C{-9} will be followed by a declining connector wave, X{-9}, and then the first wave of a second corrective pattern.
  • The correction is a 2nd wave, and compounding is seen less often in 2nds. However, they do happen on occasion.

Bigger structures:

  • This is all happening within downtrending wave 3{-7}, which began on February 2.
  • Wave 3{-7} is a subwave of downtrending wave 3{-6}, which began on August 16, 2022.
  • Wave 3{-6} is encompassed by a series of larger declining waves, the smaller within the larger, stretching up five degrees to wave 4{-1}, which began on January 4, 2022.
  • Wave 4{-1} is the next-to-the-last wave within a large expanding Diagonal Triangle, wave 5{0}, that began on December 26, 2018
  • When wave 4{-1} is complete, wave 5{-1} will begin and will carry the wave above the January 4 high, 4808.25, and back to the upper boundary of the triangle, which gets higher continually and is in the 6090s.

Reading the chart. Elliott wave analysis views the chart as a complex structure of smaller waves nested within larger waves, which in turn are nested within still larger waves. My labeling system assigns numbers to the subwaves of trending waves, and letters to the subwaves of corrections. Each number or letter is followed by a subscript, in curly brackets, showing the waves position within the complex structure, called its “degree” in Elliott wave parlance. The smaller the number, the lower the degree. On this chart we’re dealing with relatively small waves, so the degree numbers are negative.

We Are Here.

These are the waves currently in progress under my principal analysis. Each line on the list shows the wave number, with the subscript in curly brackets, the traditional degree name, the starting date, the starting price of the S&P 500 E-mini futures, and the direction of the wave.

  • S&P 500 Index:
  • 5{+3} Supercycle, 7/8/1932, 4.40 (up)
  • 5{+2} Cycle, 12/9/1974, 60.96 (up)
  • 5{+1} Primary, 3/6/2009, 666.79 (up)
  • 5{0} Intermediate, 12/26/2018, 2346.58 (up)
  • S&P 500 Futures and index:
  • 4{-1} Minor, 1/4/2022, 4808.25 (down) (futures), 4818.62 (down) (index)
  • S&P 500 Futures:
  • 1{-2} Minute, 1/4/2022, 4808.25 (down)
  • 1{-3} Minuette, 1/4/2022, 4808.25 (down)
  • 1{-4} Subminuette, 1/4/2022, 4808.25 (down)
  • 1{-5} Micro, 1/4/2022, 4808.25 (down)
  • 3{-6} Submicro, 8/16/2022, 4327.50 (down)
  • 3{-7} Minuscule, 2/2/2023, 4208.50 (down)

Learning and other resources. Elliott wave analysis provides context, not prophecy. As the 20th century semanticist Alfred Korzybski put it in his book Science and Sanity (1933), “The map is not the territory … The only usefulness of a map depends on similarity of structure between the empirical world and the map.” And I would add, in the ever-changing markets, we can judge that similarity of structure only after the fact.

See the menu page Analytical Methods for a rundown on where to go for information on Elliott wave analysis.

By Tim Bovee, Portland, Oregon, April 10, 2023

Disclaimer

Tim Bovee, Private Trader tracks the analysis and trades of a private trader for his own accounts. Nothing in this blog constitutes a recommendation to buy or sell stocks, options or any other financial instrument. The only purpose of this blog is to provide education and entertainment.

No trader is ever 100 percent successful in his or her trades. Trading in the stock and option markets is risky and uncertain. Each trader must make trading decisions for his or her own account, and take responsibility for the consequences.

License
Creative Commons License

All content on Tim Bovee, Private Trader by Timothy K. Bovee is licensed under a Creative Commons Attribution-ShareAlike 4.0 International License.

Based on a work at www.timbovee.com.

Trader’s Notebook

9:35 a.m. New York time

Market holiday. Stock and option markets in the United States will be closed today in observance of the Christian Good Friday holiday. Bond markets will close early, at noon. The S&P 500 E-mini futures continued to trade overnight.

What’s happening now? The S&P 500 E-mini futures traded sideways overnight until the release the monthly employment situation report, when price rose sharply, moving in four minutes from 4121 to 4146.75. The price then pulled back slightly, settling in the 4130s.

What does it mean? The final leg of the present upward correction continues and has covered 234.25 points since beginning on March 24.

The market continues to search for the bottom of the next-to-the-last subwave within that final leg. When it comes to bottom-fishing, proportionality is key.The pullback that began from the April 4 peak, 4171.25, has so far covered 50.25 points. That’s a 17.5% retracement, which seems overly small to be the entire pull back before the final upward push that will end the correction. For that reason, I’m retaining yesterday’s analysis.

What are the alternatives? It’s possible that the third wave within the correction will be the end of a corrective pattern but not of the correction itself. Some corrections form a compound structure, linking two or three corrective patterns together. The present correction is the 2nd of five waves in a downtrend. Compound corrections are far more common in 4th waves. Nonetheless, 2nd-wave compound corrections aren’t unheard of.

[S&P 500 E-mini futures at 9:35 a.m., 180-minute bars, with volume]

What does Elliott wave theory say? The decline that began on April 4 is wave D{-10} within rising wave C{-9}, the last leg of the upward correction, wave 2{-8}, that began on March 13. In analyzing the chart, wave D{-10}’s 17.5% retracement of the preceding wave, C{-10}, seems disproportionally small. It doesn’t break any rules of Elliott wave analysis. It could indeed be the entirety of wave D{-10} and wave E{-10} might well have begun from the April 6 low. But it seems more likely to me that the upward reversal lis a subwave within wave D{-10} and that the downward movement will soon resume.

Here’s a rundown of other waves that underly the analysis.

Principal analysis:

  • The upward correction that began on March 13 is wave 2{-8}.
  • Down one degree, wave C{-9} is the final wave within that correction.
  • Within that final wave, declining wave D{-10} is underway, It will be followed by wave E{-10}, which likely will carry the price above the April 4 high, 4171.25.
  • If wave 2{-8} moves above the starting point of wave 1{-8}, from 4208.50, then then analysis will have broken a rule of Elliott wave analysis and will be redone.
  • Wave 2{-8} will be followed by a downtrend, wave 3{-8}, that will carry the price below the correction’s starting point, 3839.25, and most likely significantly below that level.

Alternative analysis:

  • Wave 2{-8}, the upward correction, will form a compound structure, linking together two or three corrective patterns.
  • Under that alternative, if it should occur, the present rising wave C{-9} will be followed by a declining connector wave, X{-9}, and then the first wave of a second corrective pattern.
  • The correction is a 2nd wave, and compounding is seen less often in 2nds. However, they do happen on occasion.

Bigger structures:

  • This is all happening within downtrending wave 3{-7}, which began on February 2.
  • Wave 3{-7} is a subwave of downtrending wave 3{-6}, which began on August 16, 2022.
  • Wave 3{-6} is encompassed by a series of larger declining waves, the smaller within the larger, stretching up five degrees to wave 4{-1}, which began on January 4, 2022.
  • Wave 4{-1} is the next-to-the-last wave within a large expanding Diagonal Triangle, wave 5{0}, that began on December 26, 2018
  • When wave 4{-1} is complete, wave 5{-1} will begin and will carry the wave above the January 4 high, 4808.25, and back to the upper boundary of the triangle, which gets higher continually and is in the 6090s.

Reading the chart. Elliott wave analysis views the chart as a complex structure of smaller waves nested within larger waves, which in turn are nested within still larger waves. My labeling system assigns numbers to the subwaves of trending waves, and letters to the subwaves of corrections. Each number or letter is followed by a subscript, in curly brackets, showing the waves position within the complex structure, called its “degree” in Elliott wave parlance. The smaller the number, the lower the degree. On this chart we’re dealing with relatively small waves, so the degree numbers are negative.

We Are Here.

These are the waves currently in progress under my principal analysis. Each line on the list shows the wave number, with the subscript in curly brackets, the traditional degree name, the starting date, the starting price of the S&P 500 E-mini futures, and the direction of the wave.

  • S&P 500 Index:
  • 5{+3} Supercycle, 7/8/1932, 4.40 (up)
  • 5{+2} Cycle, 12/9/1974, 60.96 (up)
  • 5{+1} Primary, 3/6/2009, 666.79 (up)
  • 5{0} Intermediate, 12/26/2018, 2346.58 (up)
  • S&P 500 Futures and index:
  • 4{-1} Minor, 1/4/2022, 4808.25 (down) (futures), 4818.62 (down) (index)
  • S&P 500 Futures:
  • 1{-2} Minute, 1/4/2022, 4808.25 (down)
  • 1{-3} Minuette, 1/4/2022, 4808.25 (down)
  • 1{-4} Subminuette, 1/4/2022, 4808.25 (down)
  • 1{-5} Micro, 1/4/2022, 4808.25 (down)
  • 3{-6} Submicro, 8/16/2022, 4327.50 (down)
  • 3{-7} Minuscule, 2/2/2023, 4208.50 (down)

Learning and other resources. Elliott wave analysis provides context, not prophecy. As the 20th century semanticist Alfred Korzybski put it in his book Science and Sanity (1933), “The map is not the territory … The only usefulness of a map depends on similarity of structure between the empirical world and the map.” And I would add, in the ever-changing markets, we can judge that similarity of structure only after the fact.

See the menu page Analytical Methods for a rundown on where to go for information on Elliott wave analysis.

By Tim Bovee, Portland, Oregon, April 7, 2023

Disclaimer

Tim Bovee, Private Trader tracks the analysis and trades of a private trader for his own accounts. Nothing in this blog constitutes a recommendation to buy or sell stocks, options or any other financial instrument. The only purpose of this blog is to provide education and entertainment.

No trader is ever 100 percent successful in his or her trades. Trading in the stock and option markets is risky and uncertain. Each trader must make trading decisions for his or her own account, and take responsibility for the consequences.

License
Creative Commons License

All content on Tim Bovee, Private Trader by Timothy K. Bovee is licensed under a Creative Commons Attribution-ShareAlike 4.0 International License.

Based on a work at www.timbovee.com.

Trader’s Notebook

3:30 p.m. New York time

Half an hour before the closing bell. The S&P 500 futures rose during the session, reaching into the 4130s, well below the high set so far by the upward correction that began on March 13. It’s possible that the overnight low, 4096.50, was the end of wave D{-10}, the downward next-to-the-last leg of the final wave, C{-9}, within the correction, wave 2{-8}. The low came on the third day since wave D{-10} began, which is proportional to what has come before.

If that low is indeed the end of wave D{-10}, then wave E{-10}, the final wave within wave C{-9}, has begun. I’m not at all certain that E{-10} has begun, so for now I’m sticking with this morning’s analysis: Wave D{-10} continues its journey within wave C{-9} within wave 2{-8}.

I’ve updated the chart.

10:20 a.m. New York time

MKC options play exercise and exit. I’ve exited my short bear call options spread on MKC after the short calls were exercised as the stock went ex-dividend. I’ve updated the trade analysis with details.

9:35 a.m. New York time

What’s happening now? The S&P 500 E-mini futures remained above the April 5 low, 4099, in overnight trading.

What does it mean? From smaller to larger, the next-to-the-last subwave, which is declining, within the final wave of an upward correction that began on March 13 is fishing for its end point. Once it is complete, the subwave will be followed by the rising final wave that will bring the correction to an end.

A tendency and a rule govern how high the final wave within the correction will go.

First, within that final wave, the last of five subwaves will tend to move above the prior high within the final wave, which means above 4171.25. It’s a tendency not a rule, so the final rise might come up short.

Second, the upward correction, a 2nd wave, cannot move above the start of the preceding 1st wave, which sets a maximum of 4208.50.

So under the principal analysis, the correction’s peak must be no higher than 4208.50 but might go higher than 4171.25. If the rule is violated, then I’ll redo the analysis. If the tendency is violated, no action required.

What are the alternatives? It’s possible that the third wave within the correction will be the end of a corrective pattern but not of the correction itself. Some corrections form a compound structure, linking two or three corrective patterns together. The present correction is the 2nd of five waves in a downtrend. Compound corrections are far more common in 4th waves. Nonetheless, 2nd-wave compound corrections aren’t unheard of.

[S&P 500 E-mini futures at 3:30 p.m., 180-minute bars, with volume]

What does Elliott wave theory say? Here’s the Elliott wave terminology.

Principal analysis:

  • The upward correction that began on March 13 is wave 2{-8}.
  • Down one degree, wave C{-9} is the final wave within that correction.
  • Within that final wave, declining wave D{-10} is underway, It will be followed by wave E{-10}, which likely will carry the price above the April 4 high, 4171.25.
  • If wave 2{-8} moves above the starting point of wave 1{-8}, from 4208.50, then then analysis will have broken a rule of Elliott wave analysis and will be redone.
  • Wave 2{-8} will be followed by a downtrend, wave 3{-8}, that will carry the price below the correction’s starting point, 3839.25, and most likely significantly below that level.

Alternative analysis:

  • Wave 2{-8}, the upward correction, will form a compound structure, linking together two or three corrective patterns.
  • Under that alternative, if it should occur, the present rising wave C{-9} will be followed by a declining connector wave, X{-9}, and then the first wave of a second corrective pattern.
  • The correction is a 2nd wave, and compounding is seen less often in 2nds. However, they do happen on occasion.

Bigger structures:

  • This is all happening within downtrending wave 3{-7}, which began on February 2.
  • Wave 3{-7} is a subwave of downtrending wave 3{-6}, which began on August 16, 2022.
  • Wave 3{-6} is encompassed by a series of larger declining waves, the smaller within the larger, stretching up five degrees to wave 4{-1}, which began on January 4, 2022.
  • Wave 4{-1} is the next-to-the-last wave within a large expanding Diagonal Triangle, wave 5{0}, that began on December 26, 2018
  • When wave 4{-1} is complete, wave 5{-1} will begin and will carry the wave above the January 4 high, 4808.25, and back to the upper boundary of the triangle, which gets higher continually and is in the 6090s.

Reading the chart. Elliott wave analysis views the chart as a complex structure of smaller waves nested within larger waves, which in turn are nested within still larger waves. My labeling system assigns numbers to the subwaves of trending waves, and letters to the subwaves of corrections. Each number or letter is followed by a subscript, in curly brackets, showing the waves position within the complex structure, called its “degree” in Elliott wave parlance. The smaller the number, the lower the degree. On this chart we’re dealing with relatively small waves, so the degree numbers are negative.

We Are Here.

These are the waves currently in progress under my principal analysis. Each line on the list shows the wave number, with the subscript in curly brackets, the traditional degree name, the starting date, the starting price of the S&P 500 E-mini futures, and the direction of the wave.

  • S&P 500 Index:
  • 5{+3} Supercycle, 7/8/1932, 4.40 (up)
  • 5{+2} Cycle, 12/9/1974, 60.96 (up)
  • 5{+1} Primary, 3/6/2009, 666.79 (up)
  • 5{0} Intermediate, 12/26/2018, 2346.58 (up)
  • S&P 500 Futures and index:
  • 4{-1} Minor, 1/4/2022, 4808.25 (down) (futures), 4818.62 (down) (index)
  • S&P 500 Futures:
  • 1{-2} Minute, 1/4/2022, 4808.25 (down)
  • 1{-3} Minuette, 1/4/2022, 4808.25 (down)
  • 1{-4} Subminuette, 1/4/2022, 4808.25 (down)
  • 1{-5} Micro, 1/4/2022, 4808.25 (down)
  • 3{-6} Submicro, 8/16/2022, 4327.50 (down)
  • 3{-7} Minuscule, 2/2/2023, 4208.50 (down)

Learning and other resources. Elliott wave analysis provides context, not prophecy. As the 20th century semanticist Alfred Korzybski put it in his book Science and Sanity (1933), “The map is not the territory … The only usefulness of a map depends on similarity of structure between the empirical world and the map.” And I would add, in the ever-changing markets, we can judge that similarity of structure only after the fact.

See the menu page Analytical Methods for a rundown on where to go for information on Elliott wave analysis.

By Tim Bovee, Portland, Oregon, April 6, 2023

Disclaimer

Tim Bovee, Private Trader tracks the analysis and trades of a private trader for his own accounts. Nothing in this blog constitutes a recommendation to buy or sell stocks, options or any other financial instrument. The only purpose of this blog is to provide education and entertainment.

No trader is ever 100 percent successful in his or her trades. Trading in the stock and option markets is risky and uncertain. Each trader must make trading decisions for his or her own account, and take responsibility for the consequences.

License
Creative Commons License

All content on Tim Bovee, Private Trader by Timothy K. Bovee is licensed under a Creative Commons Attribution-ShareAlike 4.0 International License.

Based on a work at www.timbovee.com.
Trader’s Notebook

3:30 p.m. New York time

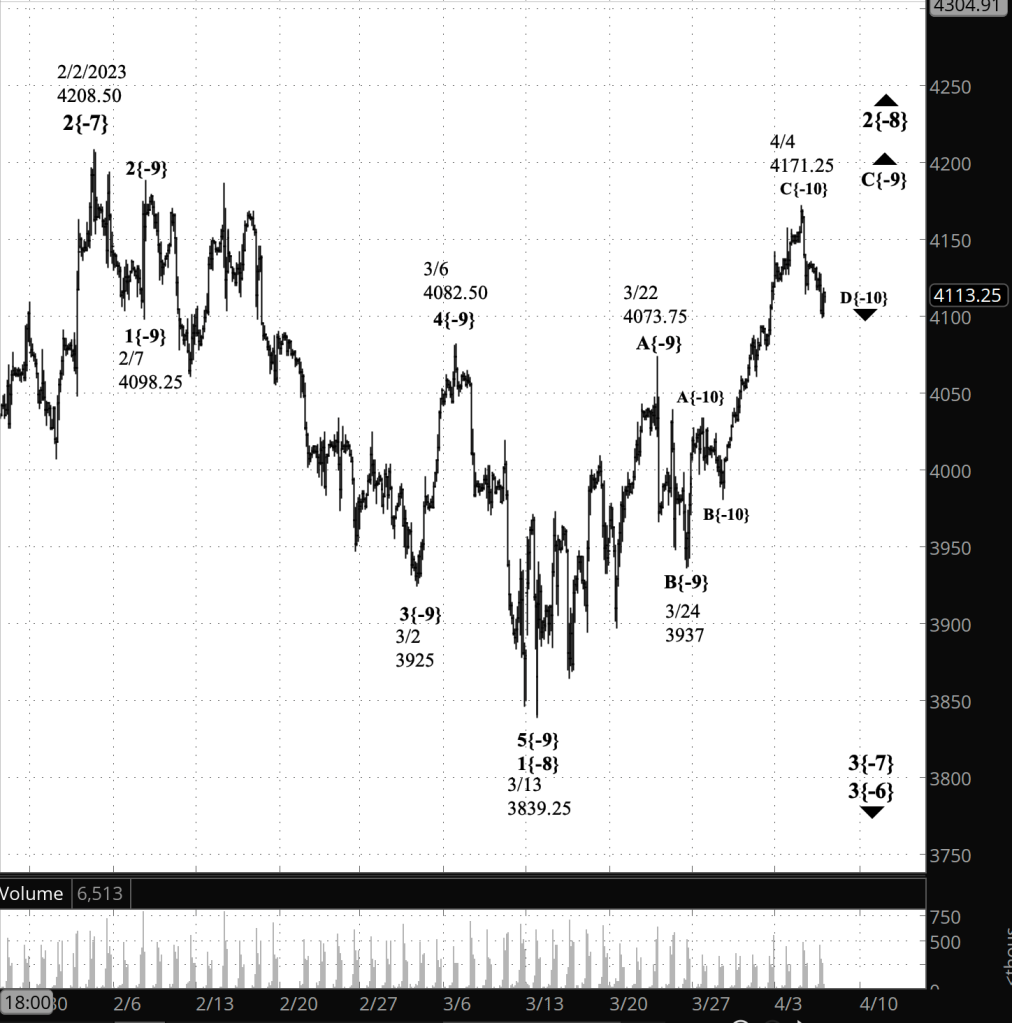
Half an hour before the closing bell. The S&P 500 worked its way lower during the session, reaching a low of 4099 on the futures as the closing bell approached. The decline is the next-to-the-last wave, D{-10}, within the final wave, C{-9}, within the upward correction that began on March 13, wave 2{-8}. No change from this morning’s analysis. I’ve updated the chart.

9:35 a.m. New York time

What’s happening now? The S&P 500 E-mini futures traded sideways overnight, remaining above the April 4 low, 4115.25.

What does it mean? The downward correction that began on March 13 in in its final wave, which in turn is in its next-to-the-last subwave. The correction is nearing its end and will be followed by a downtrend that will carry the price below the correction’s starting point, 3839.25, and likely significantly below that level.

What are the alternatives? It’s possible that the third wave within the correction will be the end of a corrective pattern but not of the correction itself. Some corrections form a compound structure, linking two or three corrective patterns together. The present correction is the 2nd of five waves in a downtrend. Compound corrections are far more common in 4th waves. Nonetheless, 2nd-wave compound corrections aren’t unheard of.

[S&P 500 E-mini futures at 3:30 p.m., 180-minute bars, with volume]

What does Elliott wave theory say? The waves behind the analysis:

Principal analysis:

  • The upward correction that began on March 13 is wave 2{-8}.
  • Down one degree, wave C{-9} is the final wave within that correction.
  • Within that final wave, declining wave D{-10} is underway, It will be followed by wave E{-10}, which likely will carry the price above the April 4 high, 4171.25.
  • If wave 2{-8} moves above the starting point of wave 1{-8}, from 4208.50, then then analysis will have broken a rule of Elliott wave analysis and will be redone.
  • Wave 2{-8} will be followed by a downtrend, wave 3{-8}, that will carry the price below the correction’s starting point, 3839.25, and most likely significantly below that level.

Alternative analysis:

  • Wave 2{-8}, the upward correction, will form a compound structure, linking together two or three corrective patterns.
  • Under that alternative, if it should occur, the present rising wave C{-9} will be followed by a declining connector wave, X{-9}, and then the first wave of a second corrective pattern.
  • The correction is a 2nd wave, and compounding is seen less often in 2nds. However, they do happen on occasion.

Bigger structures:

  • This is all happening within downtrending wave 3{-7}, which began on February 2.
  • Wave 3{-7} is a subwave of downtrending wave 3{-6}, which began on August 16, 2022.
  • Wave 3{-6} is encompassed by a series of larger declining waves, the smaller within the larger, stretching up five degrees to wave 4{-1}, which began on January 4, 2022.
  • Wave 4{-1} is the next-to-the-last wave within a large expanding Diagonal Triangle, wave 5{0}, that began on December 26, 2018
  • When wave 4{-1} is complete, wave 5{-1} will begin and will carry the wave above the January 4 high, 4808.25, and back to the upper boundary of the triangle, which gets higher continually and is in the 6090s.

Reading the chart. Elliott wave analysis views the chart as a complex structure of smaller waves nested within larger waves, which in turn are nested within still larger waves. My labeling system assigns numbers to the subwaves of trending waves, and letters to the subwaves of corrections. Each number or letter is followed by a subscript, in curly brackets, showing the waves position within the complex structure, called its “degree” in Elliott wave parlance. The smaller the number, the lower the degree. On this chart we’re dealing with relatively small waves, so the degree numbers are negative.

We Are Here.

These are the waves currently in progress under my principal analysis. Each line on the list shows the wave number, with the subscript in curly brackets, the traditional degree name, the starting date, the starting price of the S&P 500 E-mini futures, and the direction of the wave.

  • S&P 500 Index:
  • 5{+3} Supercycle, 7/8/1932, 4.40 (up)
  • 5{+2} Cycle, 12/9/1974, 60.96 (up)
  • 5{+1} Primary, 3/6/2009, 666.79 (up)
  • 5{0} Intermediate, 12/26/2018, 2346.58 (up)
  • S&P 500 Futures and index:
  • 4{-1} Minor, 1/4/2022, 4808.25 (down) (futures), 4818.62 (down) (index)
  • S&P 500 Futures:
  • 1{-2} Minute, 1/4/2022, 4808.25 (down)
  • 1{-3} Minuette, 1/4/2022, 4808.25 (down)
  • 1{-4} Subminuette, 1/4/2022, 4808.25 (down)
  • 1{-5} Micro, 1/4/2022, 4808.25 (down)
  • 3{-6} Submicro, 8/16/2022, 4327.50 (down)
  • 3{-7} Minuscule, 2/2/2023, 4208.50 (down)

Learning and other resources. Elliott wave analysis provides context, not prophecy. As the 20th century semanticist Alfred Korzybski put it in his book Science and Sanity (1933), “The map is not the territory … The only usefulness of a map depends on similarity of structure between the empirical world and the map.” And I would add, in the ever-changing markets, we can judge that similarity of structure only after the fact.

See the menu page Analytical Methods for a rundown on where to go for information on Elliott wave analysis.

By Tim Bovee, Portland, Oregon, April 5, 2023

Disclaimer

Tim Bovee, Private Trader tracks the analysis and trades of a private trader for his own accounts. Nothing in this blog constitutes a recommendation to buy or sell stocks, options or any other financial instrument. The only purpose of this blog is to provide education and entertainment.

No trader is ever 100 percent successful in his or her trades. Trading in the stock and option markets is risky and uncertain. Each trader must make trading decisions for his or her own account, and take responsibility for the consequences.

License
Creative Commons License

All content on Tim Bovee, Private Trader by Timothy K. Bovee is licensed under a Creative Commons Attribution-ShareAlike 4.0 International License.

Based on a work at www.timbovee.com.