Trader’s Notebook

3:30 p.m. New York time

Half an hour before the closing bell. The S&P 500 futures headed south during the session, dropping into the 4110s, well below the overnight high, 4171.25. The sharp decline reduces for the present the potential violation of the rules of Elliott wave analysis, discussed in this morning’s “What does it mean?” section.

I’ve revised this morning principal analysis as follows.

  • The overnight peak marks the end of the middle subwave, C{-10}, within the final wave, C{-9}, of the upward correction that began on March 13, wave 2{-8}.
  • Within wave C{-9}, the 4th subwaves of five, wave D{-10}, is now underway.
  • Wave D{-10}, which is declining, will be followed by rising wave E{-10}, which will complete the upward correction, unless it forms a compound structure, as discussed this morning in the “What are the alternatives section?”.
  • Wave E{-10} cannot carry the upward correction above the beginning of preceding 1st wave, 4208.50. If it does exceed that level, then the chart will be reanalyzed.

I’ve retained this morning’s chart and am posting a new one showing this afternoon’s changes in the principal analysis.

[S&P 500 E-mini futures at 3:30 p.m., 180-minute bars, with volume]

9:35 a.m. New York time

What’s happening now? The S&P 500 E-mini futures rose overnight, reaching a high so far of 4171.25 as the opening bell approached.

What does it mean? The upward correction that began on March 13 continues and is in its final wave. The correction is a 2nd wave within a five-wave downtrend. A strict rule of Elliott wave analysis says that a 2nd wave can’t move beyond the starting point of the preceding 1st wave. If it does, then it’s not a 2nd wave and something else is going on. In this case, the 1st wave began on February 2 from 4208.50. If the present upward correction reaches above that level, then the wave count will be revised.

The futures are derivatives of the S&P 500 index, whose comparable 1st wave began from 4195.44 and whose 2nd wave has reached a high so far of 4127.66.

The index moves in one-cent increments, and the futures in 25-cent increments. The index moves only during the session, and the futures trade every day except for Saturday. So it’s possible for the futures to go above the start of the 1st wave while the index remains below. Another way of putting it is that the futures are vulnerable to rounding error. On the other hand, the futures provide a more detailed pictures of investor sentiment, since it is traded while markets around the world are open. The index reflects only the American market sessions.

And meanwhile…

The Elliott wave rule has not been broken, yet, so the analysis remains what it was yesterday. Here is that analysis, word-for-word, along with the alternative identified yesterday:

There are three levels of nested waves in play — three “degrees”, in Elliott wave terminology. The largest is the ongoing upward correction that began on March 13. Next down is the final wave within the correction, which began on March 24. And down one more is the 3rd of five waves, which may have ended at the March 31 peak, or may not have. We’ll know when we see what happens next.

When the smallest of those three waves is complete, it will be followed by a downward movement and then by a rise above the March 31 high. That rise will be the final wave within the final wave of the upward correction. When that smallest final wave is complete, the correction will be over and a powerful downtrend will begin, carrying the price below 3839.25 — the starting point of the upward correction, and most likely significantly below that level.

What are the alternatives? The ambiguity lies in whether the end of the final wave of the correction will actually be the final wave. Most corrections have three waves internally. But not always. Some corrections form a compound structure, linking two or three corrective patterns together. The present correction is the 2nd of five waves in a downtrend. Compound corrections are far more common in 4th waves. Nonetheless, 2nd-wave compound corrections aren’t unheard of.

[Updated by the chart above]

[S&P 500 E-mini futures at 9:35 a.m., 180-minute bars, with volume]

What does Elliott wave theory say? Here are the waves in play at this point, as updated based on this afternoon’s revision of the principal analysios..

Principal analysis:

  • The upward correction that began on March 13 is wave 2{-8}.
  • Down one degree, wave C{-9} is the final wave within that correction.
  • Within that final wave, declining wave D{-10} is underway, It will be followed by wave E{-10}, which likely will carry the price above the April 4 high, 4171.25.
  • If wave 2{-8} moves above the starting point of wave 1{-8}, from 4208.50, then then analysis will have broken a rule of Elliott wave analysis and will be redone.
  • Wave 2{-8} will be followed by a downtrend, wave 3{-8}, that will carry the price below the correction’s starting point, 3839.25, and most likely significantly below that level.

Alternative analysis:

  • Wave 2{-8}, the upward correction, will form a compound structure, linking together two or three corrective patterns.
  • Under that alternative, if it should occur, the present rising wave C{-9} will be followed by a declining connector wave, X{-9}, and then the first wave of a second corrective pattern.
  • The correction is a 2nd wave, and compounding is seen less often in 2nds. However, they do happen on occasion.

Bigger structures:

  • This is all happening within downtrending wave 3{-7}, which began on February 2.
  • Wave 3{-7} is a subwave of downtrending wave 3{-6}, which began on August 16, 2022.
  • Wave 3{-6} is encompassed by a series of larger declining waves, the smaller within the larger, stretching up five degrees to wave 4{-1}, which began on January 4, 2022.
  • Wave 4{-1} is the next-to-the-last wave within a large expanding Diagonal Triangle, wave 5{0}, that began on December 26, 2018
  • When wave 4{-1} is complete, wave 5{-1} will begin and will carry the wave above the January 4 high, 4808.25, and back to the upper boundary of the triangle, which gets higher continually and is in the 6090s.

Reading the chart. Elliott wave analysis views the chart as a complex structure of smaller waves nested within larger waves, which in turn are nested within still larger waves. My labeling system assigns numbers to the subwaves of trending waves, and letters to the subwaves of corrections. Each number or letter is followed by a subscript, in curly brackets, showing the waves position within the complex structure, called its “degree” in Elliott wave parlance. The smaller the number, the lower the degree. On this chart we’re dealing with relatively small waves, so the degree numbers are negative.

We Are Here.

These are the waves currently in progress under my principal analysis. Each line on the list shows the wave number, with the subscript in curly brackets, the traditional degree name, the starting date, the starting price of the S&P 500 E-mini futures, and the direction of the wave.

  • S&P 500 Index:
  • 5{+3} Supercycle, 7/8/1932, 4.40 (up)
  • 5{+2} Cycle, 12/9/1974, 60.96 (up)
  • 5{+1} Primary, 3/6/2009, 666.79 (up)
  • 5{0} Intermediate, 12/26/2018, 2346.58 (up)
  • S&P 500 Futures and index:
  • 4{-1} Minor, 1/4/2022, 4808.25 (down) (futures), 4818.62 (down) (index)
  • S&P 500 Futures:
  • 1{-2} Minute, 1/4/2022, 4808.25 (down)
  • 1{-3} Minuette, 1/4/2022, 4808.25 (down)
  • 1{-4} Subminuette, 1/4/2022, 4808.25 (down)
  • 1{-5} Micro, 1/4/2022, 4808.25 (down)
  • 3{-6} Submicro, 8/16/2022, 4327.50 (down)
  • 3{-7} Minuscule, 2/2/2023, 4208.50 (down)

Learning and other resources. Elliott wave analysis provides context, not prophecy. As the 20th century semanticist Alfred Korzybski put it in his book Science and Sanity (1933), “The map is not the territory … The only usefulness of a map depends on similarity of structure between the empirical world and the map.” And I would add, in the ever-changing markets, we can judge that similarity of structure only after the fact.

See the menu page Analytical Methods for a rundown on where to go for information on Elliott wave analysis.

By Tim Bovee, Portland, Oregon, April 4, 2023

Disclaimer

Tim Bovee, Private Trader tracks the analysis and trades of a private trader for his own accounts. Nothing in this blog constitutes a recommendation to buy or sell stocks, options or any other financial instrument. The only purpose of this blog is to provide education and entertainment.

No trader is ever 100 percent successful in his or her trades. Trading in the stock and option markets is risky and uncertain. Each trader must make trading decisions for his or her own account, and take responsibility for the consequences.

License
Creative Commons License

All content on Tim Bovee, Private Trader by Timothy K. Bovee is licensed under a Creative Commons Attribution-ShareAlike 4.0 International License.

Based on a work at www.timbovee.com.
Trader’s Notebook

3:30 p.m. New York time

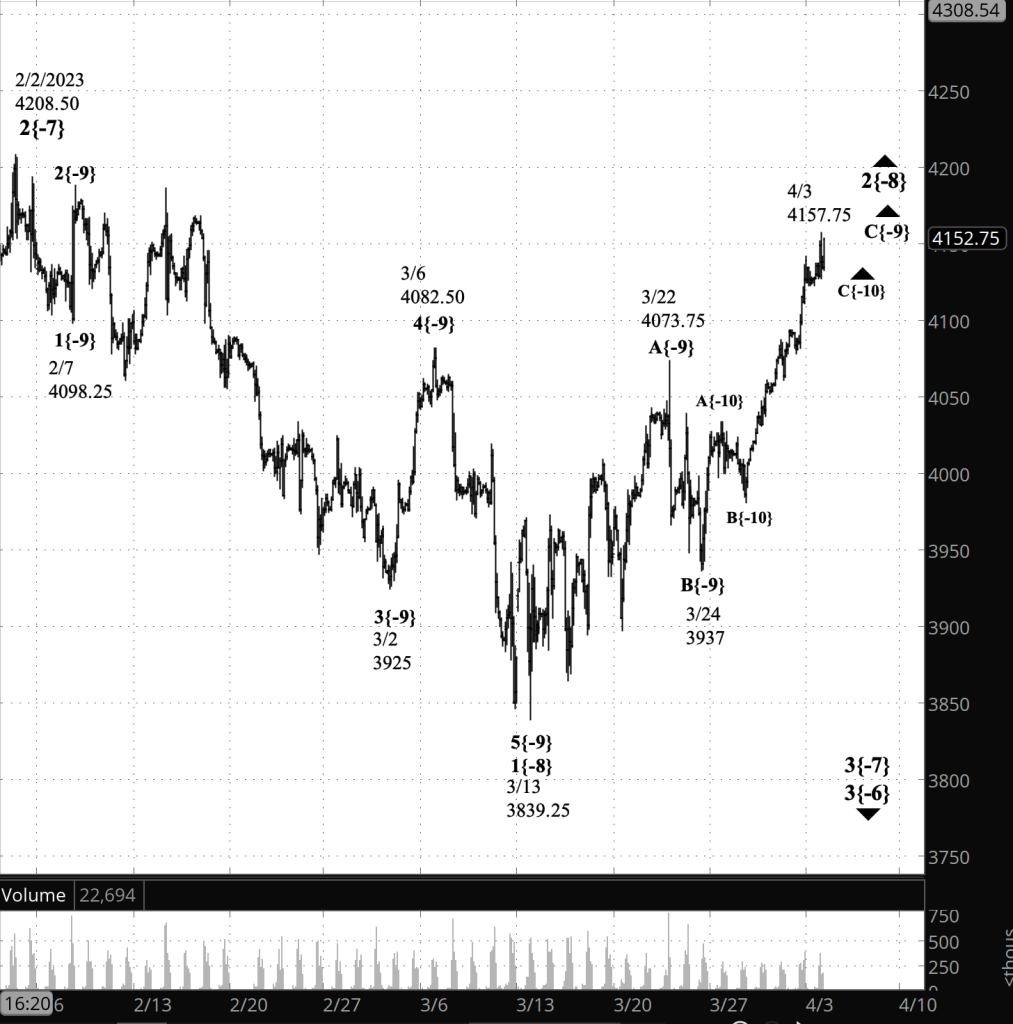
Half an hour before the closing bell. The S&P 500 futures quickly rose to a new high, 4157.75, early in the session and just as quickly fell back into the 4120s. As was the case with the March 31 high, the peak could mark the end of the middle wave, C{-10}, within the final wave, C{-9}, of the upward correction that began on March 13, or not. We’re fishing for a top, and when we’re fishing, we never know if we’ve caught anything until after the fish bites. I’ve updated the chart.

9:35 a.m. New York time

What’s happening now? The S&P 500 E-mini futures kept to a narrow range after trading resumed overnight, remaining below the March 31 peak of 4142.50 and reaching into the 4120s.

What does it mean? There are three levels of nested waves in play — three “degrees”, in Elliott wave terminology. The largest is the ongoing upward correction that began on March 13. Next down is the final wave within the correction, which began on March 24. And down one more is the 3rd of five waves, which may have ended at the March 31 peak, or may not have. We’ll know when we see what happens next.

When the smallest of those three waves is complete, it will be followed by a downward movement and then by a rise above the March 31 high. That rise will be the final wave within the final wave of the upward correction. When that smallest final wave is complete, the correction will be over and a powerful downtrend will begin, carrying the price below 3839.25 — the starting point of the upward correction, and most likely significantly below that level.

What are the alternatives? The ambiguity lies in whether the end of the final wave of the correction will actually be the final wave. Most corrections have three waves internally. But not always. Some corrections form a compound structure, linking two or three corrective patterns together. The present correction is the 2nd of five waves in a downtrend. Compound corrections are far more common in 4th waves. Nonetheless, 2nd-wave compound corrections aren’t unheard of.

[S&P 500 E-mini futures at 3:30 p.m., 110-minute bars, with volume]

What does Elliott wave theory say? I’ll begin with the Elliott wave terminology for the three nested waves described above in the “What does it mean?” section, from larger to smaller,

Principal analysis:

  • The upward correction that began on March 13 is wave 2{-8}.
  • Down one degree, wave C{-9} is the final wave within that correction.
  • Within that final wave, wave C{-10} is underway, It will be followed by a decline, wave D{-10}, and then by a wave E{-10}, which will carry the price above the March 31 high, 4142.50.

Wave 2{-8} will be followed by a downtrend, wave 3{-8}, that will carry the price below the correction’s starting point, 3839.25, and most likely significantly below that level.

Alternative analysis:

  • Wave 2{-8}, the upward correction, will form a compound structure, linking together two or three corrective patterns.
  • Under that alternative, if it should occur, the present rising wave C{-9} will be followed by a declining connector wave, X{-9}, and then the first wave of a second corrective pattern.
  • The correction is a 2nd wave, and compounding is seen less often in 2nds. However, they do happen on occasion.

Bigger structures:

  • This is all happening within downtrending wave 3{-7}, which began on February 2.
  • Wave 3{-7} is a subwave of downtrending wave 3{-6}, which began on August 16, 2022.
  • Wave 3{-6} is encompassed by a series of larger declining waves, the smaller within the larger, stretching up five degrees to wave 4{-1}, which began on January 4, 2022.
  • Wave 4{-1} is the next-to-the-last wave within a large expanding Diagonal Triangle, wave 5{0}, that began on December 26, 2018
  • When wave 4{-1} is complete, wave 5{-1} will begin and will carry the wave above the January 4 high, 4808.25, and back to the upper boundary of the triangle, which gets higher continually and is in the 6090s.

Reading the chart. Elliott wave analysis views the chart as a complex structure of smaller waves nested within larger waves, which in turn are nested within still larger waves. My labeling system assigns numbers to the subwaves of trending waves, and letters to the subwaves of corrections. Each number or letter is followed by a subscript, in curly brackets, showing the waves position within the complex structure, called its “degree” in Elliott wave parlance. The smaller the number, the lower the degree. On this chart we’re dealing with relatively small waves, so the degree numbers are negative.

We Are Here.

These are the waves currently in progress under my principal analysis. Each line on the list shows the wave number, with the subscript in curly brackets, the traditional degree name, the starting date, the starting price of the S&P 500 E-mini futures, and the direction of the wave.

  • S&P 500 Index:
  • 5{+3} Supercycle, 7/8/1932, 4.40 (up)
  • 5{+2} Cycle, 12/9/1974, 60.96 (up)
  • 5{+1} Primary, 3/6/2009, 666.79 (up)
  • 5{0} Intermediate, 12/26/2018, 2346.58 (up)
  • S&P 500 Futures and index:
  • 4{-1} Minor, 1/4/2022, 4808.25 (down) (futures), 4818.62 (down) (index)
  • S&P 500 Futures:
  • 1{-2} Minute, 1/4/2022, 4808.25 (down)
  • 1{-3} Minuette, 1/4/2022, 4808.25 (down)
  • 1{-4} Subminuette, 1/4/2022, 4808.25 (down)
  • 1{-5} Micro, 1/4/2022, 4808.25 (down)
  • 3{-6} Submicro, 8/16/2022, 4327.50 (down)
  • 3{-7} Minuscule, 2/2/2023, 4208.50 (down)

Learning and other resources. Elliott wave analysis provides context, not prophecy. As the 20th century semanticist Alfred Korzybski put it in his book Science and Sanity (1933), “The map is not the territory … The only usefulness of a map depends on similarity of structure between the empirical world and the map.” And I would add, in the ever-changing markets, we can judge that similarity of structure only after the fact.

See the menu page Analytical Methods for a rundown on where to go for information on Elliott wave analysis.

By Tim Bovee, Portland, Oregon, April 3, 2023

Disclaimer

Tim Bovee, Private Trader tracks the analysis and trades of a private trader for his own accounts. Nothing in this blog constitutes a recommendation to buy or sell stocks, options or any other financial instrument. The only purpose of this blog is to provide education and entertainment.

No trader is ever 100 percent successful in his or her trades. Trading in the stock and option markets is risky and uncertain. Each trader must make trading decisions for his or her own account, and take responsibility for the consequences.

License
Creative Commons License

All content on Tim Bovee, Private Trader by Timothy K. Bovee is licensed under a Creative Commons Attribution-ShareAlike 4.0 International License.

Based on a work at www.timbovee.com.
Trader’s Notebook

3:30 p.m. New York time

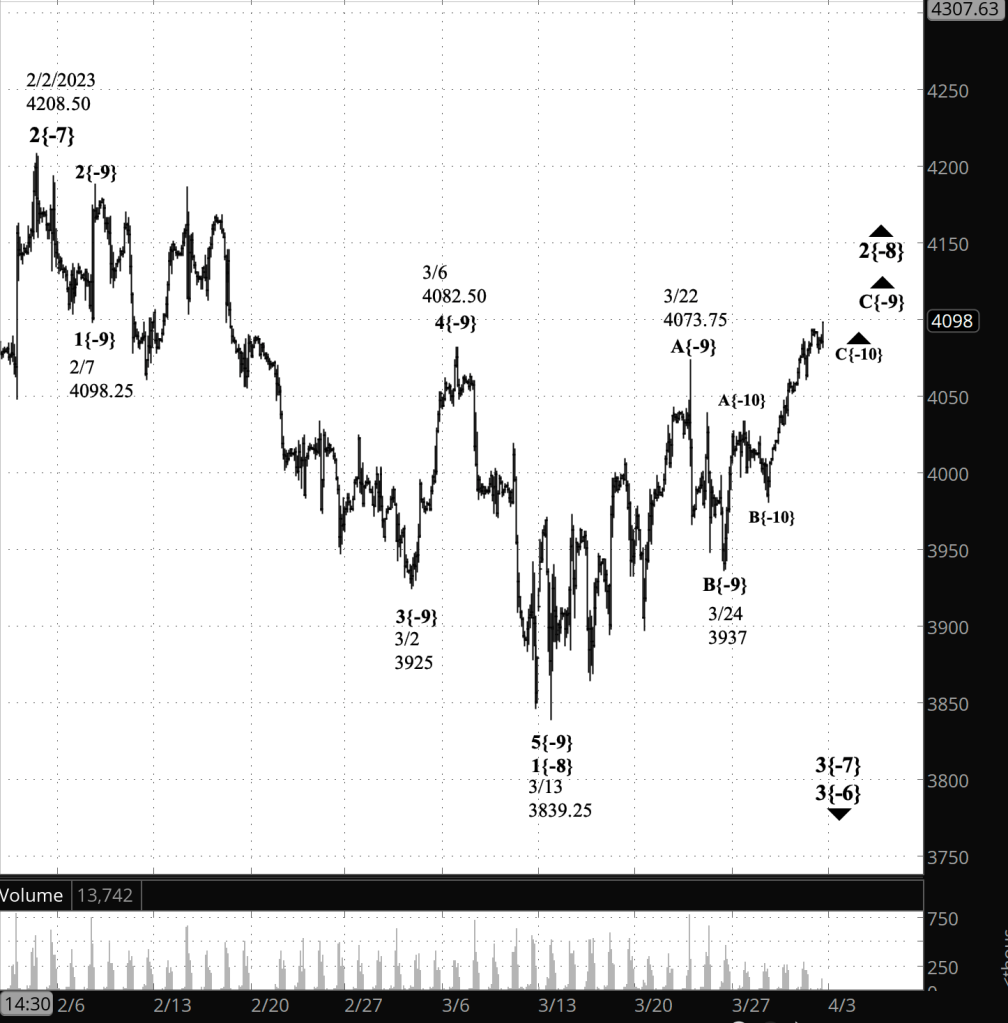
Half an hour before the closing bell. The S&P 500 futures moved to a higher high, reaching into the 4130s so far, within the present upward correction, and then pulled back, rising again but staying below the peak. The pattern is consistent with the principal analysis, below. I’ve updated the chart.

9:35 a.m. New York time

What’s happening now? The S&P 500 E-mini futures zigzagged sideways overnight, reaching a low of 4078 and then spiking to a high of 4098.50 after the Personal Income and Outlays report for February was released. After the spike, the price immediately dropped back to where it had been before the data release.

What does it mean? The sharp rise is consistent with the analysis that has been in place since the March 24 low: The third of three waves within the upward correction that began on March 13 is underway. Internally, that 3rd wave is in the 3rd of five subwaves. At this point, any peak could potentially be the end of that 3rd subwave, but we won’t know it until we see what happens next.

What are the alternatives? Unchanged from the last few days. The 3rd subwave is the final wave of a correction. But not always. Some corrections form a compound structure, linking two or three corrective patterns together. The present correction is the 2nd of five waves in a downtrend. Compound corrections are far more common in 4th waves. Nonetheless, 2nd-wave compound corrections aren’t unheard of.

[S&P 500 E-mini futures at 3:30 p.m., 110-minute bars, with volume]

What does Elliott wave theory say? Also unchanged. Wave C{-9} within the upward correction that began on March 13, wave 2{-8}, is underway. Wave C{-9} will have five subwaves one degree lower and is in the 3rd subwave, rising wave C{-10}.

Here are other waves that are important to the analysis:

Principal analysis:

  • The upward correction that began on March 13, wave 2{-8}, continues.
  • It is in the third of three subwaves, rising wave C{-9}.
  • Wave 2{-8} will be followed by a downtrend, wave 3{-8}, that will carry the price below the correction’s starting point, 3839.25, and most likely significantly below that level.

Alternative analysis:

  • Wave 2{-8}, the upward correction, will form a compound structure, linking together two or three corrective patterns.
  • Under that alternative, if it should occur, the present rising wave C{-9} will be followed by a declining connector wave, X{-9}, and then the first wave of a second corrective pattern.
  • The correction is a 2nd wave, and compounding is seen less often in 2nds. However, they do happen on occasion.

Bigger structures:

  • This is all happening within downtrending wave 3{-7}, which began on February 2.
  • Wave 3{-7} is a subwave of downtrending wave 3{-6}, which began on August 16, 2022.
  • Wave 3{-6} is encompassed by a series of larger declining waves, the smaller within the larger, stretching up five degrees to wave 4{-1}, which began on January 4, 2022.
  • Wave 4{-1} is the next-to-the-last wave within a large expanding Diagonal Triangle, wave 5{0}, that began on December 26, 2018
  • When wave 4{-1} is complete, wave 5{-1} will begin and will carry the wave above the January 4 high, 4808.25, and back to the upper boundary of the triangle, which gets higher continually and is in the 6090s.

Reading the chart. Elliott wave analysis views the chart as a complex structure of smaller waves nested within larger waves, which in turn are nested within still larger waves. My labeling system assigns numbers to the subwaves of trending waves, and letters to the subwaves of corrections. Each number or letter is followed by a subscript, in curly brackets, showing the waves position within the complex structure, called its “degree” in Elliott wave parlance. The smaller the number, the lower the degree. On this chart we’re dealing with relatively small waves, so the degree numbers are negative.

We Are Here.

These are the waves currently in progress under my principal analysis. Each line on the list shows the wave number, with the subscript in curly brackets, the traditional degree name, the starting date, the starting price of the S&P 500 E-mini futures, and the direction of the wave.

  • S&P 500 Index:
  • 5{+3} Supercycle, 7/8/1932, 4.40 (up)
  • 5{+2} Cycle, 12/9/1974, 60.96 (up)
  • 5{+1} Primary, 3/6/2009, 666.79 (up)
  • 5{0} Intermediate, 12/26/2018, 2346.58 (up)
  • S&P 500 Futures and index:
  • 4{-1} Minor, 1/4/2022, 4808.25 (down) (futures), 4818.62 (down) (index)
  • S&P 500 Futures:
  • 1{-2} Minute, 1/4/2022, 4808.25 (down)
  • 1{-3} Minuette, 1/4/2022, 4808.25 (down)
  • 1{-4} Subminuette, 1/4/2022, 4808.25 (down)
  • 1{-5} Micro, 1/4/2022, 4808.25 (down)
  • 3{-6} Submicro, 8/16/2022, 4327.50 (down)
  • 3{-7} Minuscule, 2/2/2023, 4208.50 (down)

Learning and other resources. Elliott wave analysis provides context, not prophecy. As the 20th century semanticist Alfred Korzybski put it in his book Science and Sanity (1933), “The map is not the territory … The only usefulness of a map depends on similarity of structure between the empirical world and the map.” And I would add, in the ever-changing markets, we can judge that similarity of structure only after the fact.

See the menu page Analytical Methods for a rundown on where to go for information on Elliott wave analysis.

By Tim Bovee, Portland, Oregon, March 31, 2023

Disclaimer

Tim Bovee, Private Trader tracks the analysis and trades of a private trader for his own accounts. Nothing in this blog constitutes a recommendation to buy or sell stocks, options or any other financial instrument. The only purpose of this blog is to provide education and entertainment.

No trader is ever 100 percent successful in his or her trades. Trading in the stock and option markets is risky and uncertain. Each trader must make trading decisions for his or her own account, and take responsibility for the consequences.

License
Creative Commons License

All content on Tim Bovee, Private Trader by Timothy K. Bovee is licensed under a Creative Commons Attribution-ShareAlike 4.0 International License.

Based on a work at www.timbovee.com.
Trader’s Notebook

3:30 p.m. New York time

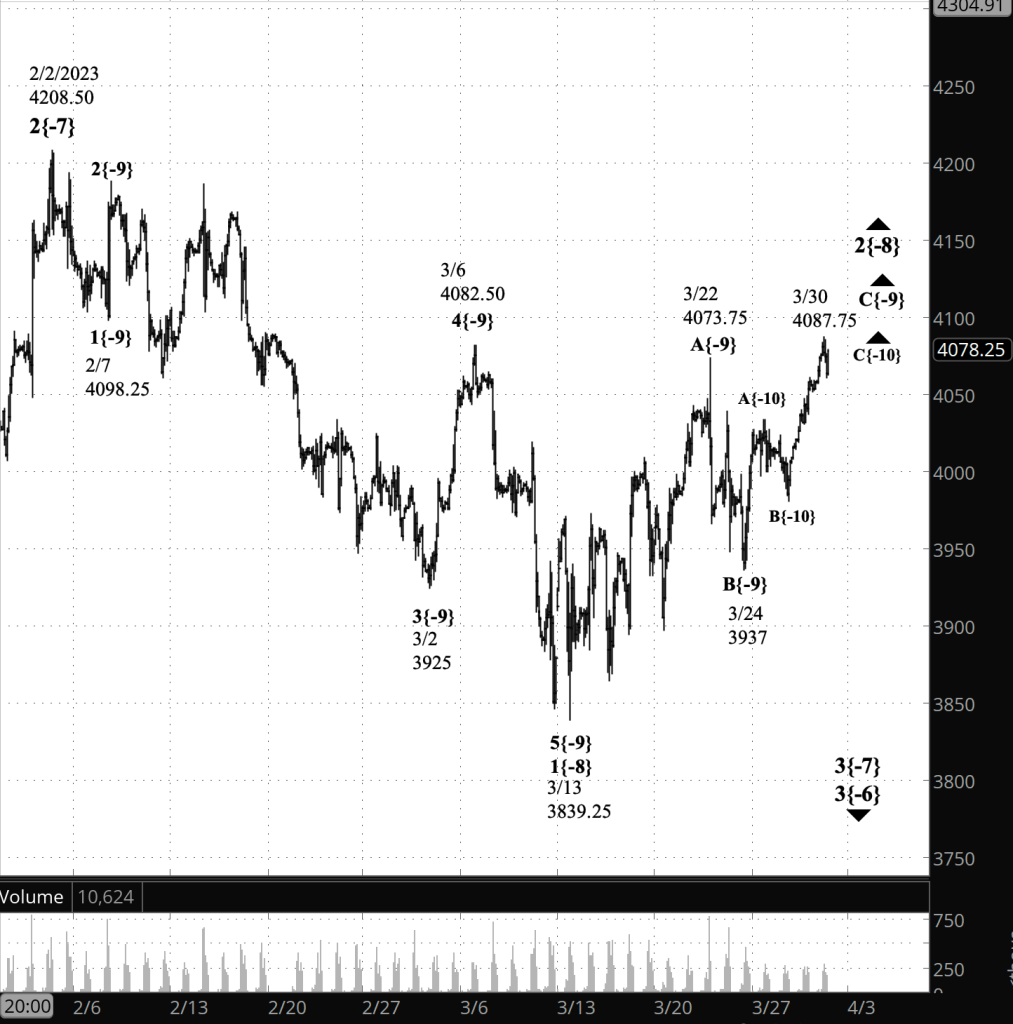
Half an hour before the closing bell. The S&P 500 futures peaked at 4087.75 early in the session and then fell back to the 4060s. It’s possible the peak marked the end of the 3rd of five waves within the final wave of the upward correction that began on March 13. Or perhaps not.

In Elliott wave terminology, the peak may have marked the end of rising wave C{-10} and the beginning of declining wave D{-10} within rising wave C{-9}. The corrective pattern will end with rising wave E{-10} within wave C{-9}. It’s also possible that the price will quickly reverse and continue pushing wave C{-10} upward.

For the moment, I shall stay with this morning’s analysis, that wave C{-10} is underway. Nonetheless, I’ll be unsurprised if Wave D{-10} began from that point.

I’ve updated the chart.

9:35 a.m. New York time

What’s happening now? The S&P 500 E-mini futures rose steadily into the 4080s overnight.

What does it mean? The upward correction that began on March 13 continues and is in the corrective pattern’s third and final leg. The correction will be followed by a downtrend that will carry the price back to the 3830s and most likely significantly below that level.

What are the alternatives? The 3rd subwave is the final wave of a correction. But not always. Some corrections form a compound structure, linking two or three corrective patterns together. The present correction is the 2nd of five waves in a downtrend. Compound corrections are far more common in 4th waves. Nonetheless, 2nd-wave compound corrections aren’t unheard of.

Reading the chart. Elliott wave analysis views the chart as a complex structure of smaller waves nested within larger waves, which in turn are nested within still larger waves. My labeling system assigns numbers to the subwaves of trending waves, and letters to the subwaves of corrections. Each number or letter is followed by a subscript, in curly brackets, showing the waves position within the complex structure, called its “degree” in Elliott wave parlance. The smaller the number, the lower the degree. On this chart we’re dealing with relatively small waves, so the degree numbers are negative.

[S&P 500 E-mini futures at 3:30 p.m., 110-minute bars, with volume]

What does Elliott wave theory say? The configuration is unchanged from yesterday. Wave C{-9} within the upward correction that began on March 13, wave 2{-8}, is underway. Wave C{-9} will have five subwaves one degree lower and is in the 3rd subwave, rising wave C{-10}.

Here are other waves that are important to the analysis:

Principal analysis:

  • The upward correction that began on March 13, wave 2{-8}, continues.
  • It is in the third of three subwaves, rising wave C{-9}.
  • Wave 2{-8} will be followed by a downtrend, wave 3{-8}, that will carry the price below the correction’s starting point, 3839.25, and most likely significantly below that level.

Alternative analysis:

  • Wave 2{-8}, the upward correction, will form a compound structure, linking together two or three corrective patterns.
  • Under that alternative, if it should occur, the present rising wave C{-9} will be followed by a declining connector wave, X{-9}, and then the first wave of a second corrective pattern.
  • The correction is a 2nd wave, and compounding is seen less often in 2nds. However, they do happen on occasion.

Bigger structures:

  • This is all happening within downtrending wave 3{-7}, which began on February 2.
  • Wave 3{-7} is a subwave of downtrending wave 3{-6}, which began on August 16, 2022.
  • Wave 3{-6} is encompassed by a series of larger declining waves, the smaller within the larger, stretching up five degrees to wave 4{-1}, which began on January 4, 2022.
  • Wave 4{-1} is the next-to-the-last wave within a large expanding Diagonal Triangle, wave 5{0}, that began on December 26, 2018
  • When wave 4{-1} is complete, wave 5{-1} will begin and will carry the wave above the January 4 high, 4808.25, and back to the upper boundary of the triangle, which gets higher continually and is in the 6090s.

We Are Here.

These are the waves currently in progress under my principal analysis. Each line on the list shows the wave number, with the subscript in curly brackets, the traditional degree name, the starting date, the starting price of the S&P 500 E-mini futures, and the direction of the wave.

  • S&P 500 Index:
  • 5{+3} Supercycle, 7/8/1932, 4.40 (up)
  • 5{+2} Cycle, 12/9/1974, 60.96 (up)
  • 5{+1} Primary, 3/6/2009, 666.79 (up)
  • 5{0} Intermediate, 12/26/2018, 2346.58 (up)
  • S&P 500 Futures and index:
  • 4{-1} Minor, 1/4/2022, 4808.25 (down) (futures), 4818.62 (down) (index)
  • S&P 500 Futures:
  • 1{-2} Minute, 1/4/2022, 4808.25 (down)
  • 1{-3} Minuette, 1/4/2022, 4808.25 (down)
  • 1{-4} Subminuette, 1/4/2022, 4808.25 (down)
  • 1{-5} Micro, 1/4/2022, 4808.25 (down)
  • 3{-6} Submicro, 8/16/2022, 4327.50 (down)
  • 3{-7} Minuscule, 2/2/2023, 4208.50 (down)

Learning and other resources. Elliott wave analysis provides context, not prophecy. As the 20th century semanticist Alfred Korzybski put it in his book Science and Sanity (1933), “The map is not the territory … The only usefulness of a map depends on similarity of structure between the empirical world and the map.” And I would add, in the ever-changing markets, we can judge that similarity of structure only after the fact.

See the menu page Analytical Methods for a rundown on where to go for information on Elliott wave analysis.

By Tim Bovee, Portland, Oregon, March 30, 2023

Disclaimer

Tim Bovee, Private Trader tracks the analysis and trades of a private trader for his own accounts. Nothing in this blog constitutes a recommendation to buy or sell stocks, options or any other financial instrument. The only purpose of this blog is to provide education and entertainment.

No trader is ever 100 percent successful in his or her trades. Trading in the stock and option markets is risky and uncertain. Each trader must make trading decisions for his or her own account, and take responsibility for the consequences.

License
Creative Commons License

All content on Tim Bovee, Private Trader by Timothy K. Bovee is licensed under a Creative Commons Attribution-ShareAlike 4.0 International License.

Based on a work at www.timbovee.com.
Trader’s Notebook

3:30 p.m. New York time

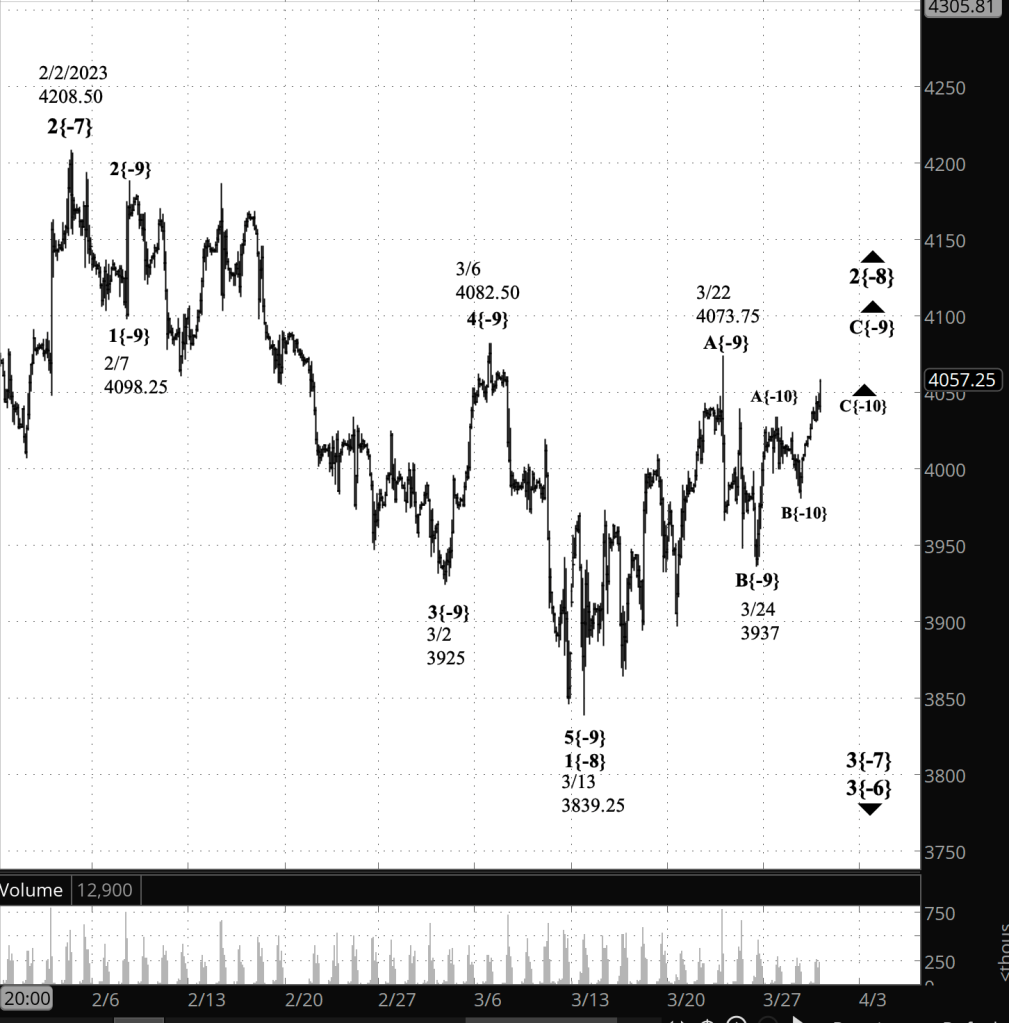
Half an hour before the closing bell. The S&P 500 futures continued to rise during the session, returning to the 4050s. No change in this morning’s analysis. I’ve updated the chart.

9:35 a.m. New York time

What’s happening now? The S&P 500 E-mini futures rose into the 4040s overnight.

What does it mean? The rise is the 3rd of five subwaves within the 3rd and perhaps final wave within an upward correction that began on March 13. When the correction is complete, it will be followed by an energetic decline into the 3930s and likely significantly below that level.

What are the alternatives? In most cases, the 3rd wave is the final wave of a correction. There are, however, exceptions. Some corrections form a compound structure, linking two or three corrective patterns together. The present correction is the 2nd of five waves in a downtrend. Compound corrections are far more common in 4th waves. Nonetheless, 2nd-wave compound corrections sometimes happen.

Reading the chart. Elliott wave analysis views the chart as a complex structure of smaller waves nested within larger waves, which in turn are nested within still larger waves. My labeling system assigns numbers to the subwaves of trending waves, and letters to the subwaves of corrections. Each number or letter is followed by a subscript, in curly brackets, showing the waves position within the complex structure, called its “degree” in Elliott wave parlance. The smaller the number, the lower the degree. On this chart we’re dealing with relatively small waves, so the degree numbers are negative.

[S&P 500 E-mini futures at 3:30 p.m., 110-minute bars, with volume]

What does Elliott wave theory say? Wave C{-9} within the upward correction that began on March 13, wave 2{-8}, is underway. Wave C{-9} will have five subwaves one degree lower and is in the 3rd subwave, rising wave C{-10}.

Here are other waves that are important to the analysis:

Principal analysis:

  • The upward correction that began on March 13, wave 2{-8}, continues.
  • It is in the third of three subwaves, rising wave C{-9}.
  • Wave 2{-8} will be followed by a downtrend, wave 3{-8}, that will carry the price below the correction’s starting point, 3839.25, and most likely significantly below that level.

Alternative analysis:

  • Wave 2{-8}, the upward correction, will form a compound structure, linking together two or three corrective patterns.
  • Under that alternative, if it should occur, the present rising wave C{-9} will be followed by a declining connector wave, X{-9}, and then the first wave of a second corrective pattern.
  • The correction is a 2nd wave, and compounding is seen less often in 2nds. However, they do happen on occasion.

Bigger structures:

  • This is all happening within downtrending wave 3{-7}, which began on February 2.
  • Wave 3{-7} is a subwave of downtrending wave 3{-6}, which began on August 16, 2022.
  • Wave 3{-6} is encompassed by a series of larger declining waves, the smaller within the larger, stretching up five degrees to wave 4{-1}, which began on January 4, 2022.
  • Wave 4{-1} is the next-to-the-last wave within a large expanding Diagonal Triangle, wave 5{0}, that began on December 26, 2018
  • When wave 4{-1} is complete, wave 5{-1} will begin and will carry the wave above the January 4 high, 4808.25, and back to the upper boundary of the triangle, which gets higher continually and is in the 6090s.

We Are Here.

These are the waves currently in progress under my principal analysis. Each line on the list shows the wave number, with the subscript in curly brackets, the traditional degree name, the starting date, the starting price of the S&P 500 E-mini futures, and the direction of the wave.

  • S&P 500 Index:
  • 5{+3} Supercycle, 7/8/1932, 4.40 (up)
  • 5{+2} Cycle, 12/9/1974, 60.96 (up)
  • 5{+1} Primary, 3/6/2009, 666.79 (up)
  • 5{0} Intermediate, 12/26/2018, 2346.58 (up)
  • S&P 500 Futures and index:
  • 4{-1} Minor, 1/4/2022, 4808.25 (down) (futures), 4818.62 (down) (index)
  • S&P 500 Futures:
  • 1{-2} Minute, 1/4/2022, 4808.25 (down)
  • 1{-3} Minuette, 1/4/2022, 4808.25 (down)
  • 1{-4} Subminuette, 1/4/2022, 4808.25 (down)
  • 1{-5} Micro, 1/4/2022, 4808.25 (down)
  • 3{-6} Submicro, 8/16/2022, 4327.50 (down)
  • 3{-7} Minuscule, 2/2/2023, 4208.50 (down)

Learning and other resources. Elliott wave analysis provides context, not prophecy. As the 20th century semanticist Alfred Korzybski put it in his book Science and Sanity (1933), “The map is not the territory … The only usefulness of a map depends on similarity of structure between the empirical world and the map.” And I would add, in the ever-changing markets, we can judge that similarity of structure only after the fact.

See the menu page Analytical Methods for a rundown on where to go for information on Elliott wave analysis.

By Tim Bovee, Portland, Oregon, March 29, 2023

Disclaimer

Tim Bovee, Private Trader tracks the analysis and trades of a private trader for his own accounts. Nothing in this blog constitutes a recommendation to buy or sell stocks, options or any other financial instrument. The only purpose of this blog is to provide education and entertainment.

No trader is ever 100 percent successful in his or her trades. Trading in the stock and option markets is risky and uncertain. Each trader must make trading decisions for his or her own account, and take responsibility for the consequences.

License
Creative Commons License

All content on Tim Bovee, Private Trader by Timothy K. Bovee is licensed under a Creative Commons Attribution-ShareAlike 4.0 International License.

Based on a work at www.timbovee.com.

Trader’s Notebook

3:30 p.m. New York time

Half an hour before the closing bell. The S&P 500 futures tick-tocked along with no drama during the session and so far has declined into the 3980s. The downward correction that began on March 13, wave 2{-8}, continues. No change from this morning’s analysis. I’ve updated the chart.

9:35 a.m. New York time

What’s happening now? The S&P 500 E-mini futures fell overnight, reaching into the 3990s.

What does it mean? The upward correction that began on March 13 continues and is in its 3rd and probably final subwave. There’s a lack of clarity regarding how far along the final subwave is through its internal waves.

What are the alternatives? A couple of alternatives today.

In describing the principal analysis I hedged — “probably” — whether the 3rd subwave will when complete be the end of the correction. For most corrections, the 3rd subwave wave will be the end. However, sometimes corrections take a compound form, linking together two or three corrective patterns. If that happens here, then the present 3rd subwave will end the first corrective pattern but the compound correction will continue.

At a smaller level, there is some ambiguity regarding the internal waves within the 3rd subwave, which will have five internal waves altogether. As my principal analysis, reflected on the chart, I’ve chosen to treat the overnight decline as a correction within the 1st internal wave. It’s also quite possible that the 1st internal wave ended with the March 27 high, 4034.25, and the that the 2nd internal wave is now underway.

Reading the chart. Elliott wave analysis views the chart as a complex structure of smaller waves nested within larger waves, which in turn are nested within still larger waves. My labeling system assigns numbers to the subwaves of trending waves, and letters to the subwaves of corrections. Each number or letter is followed by a subscript, in curly brackets, showing the waves position within the complex structure, called its “degree” in Elliott wave parlance. The smaller the number, the lower the degree. On this chart we’re dealing with relatively small waves, so the degree numbers are negative.

[S&P 500 E-mini futures at 3:30 p.m., 100-minute bars, with volume]

What does Elliott wave theory say? Wave C{-9} within the upward correction that began on March 13, wave 2{-8}, is underway. Wave C{-9} will have five subwaves one degree lower and is in the first subwave, A{-10}.

Here are other waves that are important to the analysis:

Principal analysis:

  • The upward correction that began on March 13, wave 2{-8}, continues.
  • It is in the third of three subwaves, rising wave C{-9}.
  • Wave 2{-8} will be followed by a downtrend, wave 3{-8}, that will carry the price below the correction’s starting point, 3839.25, and most likely significantly below that level.

Alternative analysis #1:

  • Wave 2{-8}, the upward correction, will form a compound structure, linking together two or three corrective patterns.
  • Under that alternative, if it should occur, the present rising wave C{-9} will be followed by a declining connector wave, X{-9}, and then the first wave of a second corrective pattern.
  • The correction is a 2nd wave, and compounding is seen less often in 2nds. However, they do happen on occasion.

Alternative analysis #2:

  • Within wave 2{-8}, the second subwave, wave B{-10} with wave C{-9}, began with the overnight decline.

Bigger structures:

  • This is all happening within downtrending wave 3{-7}, which began on February 2.
  • Wave 3{-7} is a subwave of downtrending wave 3{-6}, which began on August 16, 2022.
  • Wave 3{-6} is encompassed by a series of larger declining waves, the smaller within the larger, stretching up five degrees to wave 4{-1}, which began on January 4, 2022.
  • Wave 4{-1} is the next-to-the-last wave within a large expanding Diagonal Triangle, wave 5{0}, that began on December 26, 2018
  • When wave 4{-1} is complete, wave 5{-1} will begin and will carry the wave above the January 4 high, 4808.25, and back to the upper boundary of the triangle, which gets higher continually and is approaching the 6000s.

We Are Here.

These are the waves currently in progress under my principal analysis. Each line on the list shows the wave number, with the subscript in curly brackets, the traditional degree name, the starting date, the starting price of the S&P 500 E-mini futures, and the direction of the wave.

  • S&P 500 Index:
  • 5{+3} Supercycle, 7/8/1932, 4.40 (up)
  • 5{+2} Cycle, 12/9/1974, 60.96 (up)
  • 5{+1} Primary, 3/6/2009, 666.79 (up)
  • 5{0} Intermediate, 12/26/2018, 2346.58 (up)
  • S&P 500 Futures and index:
  • 4{-1} Minor, 1/4/2022, 4808.25 (down) (futures), 4818.62 (down) (index)
  • S&P 500 Futures:
  • 1{-2} Minute, 1/4/2022, 4808.25 (down)
  • 1{-3} Minuette, 1/4/2022, 4808.25 (down)
  • 1{-4} Subminuette, 1/4/2022, 4808.25 (down)
  • 1{-5} Micro, 1/4/2022, 4808.25 (down)
  • 3{-6} Submicro, 8/16/2022, 4327.50 (down)
  • 3{-7} Minuscule, 2/2/2023, 4208.50 (down)

Learning and other resources. Elliott wave analysis provides context, not prophecy. As the 20th century semanticist Alfred Korzybski put it in his book Science and Sanity (1933), “The map is not the territory … The only usefulness of a map depends on similarity of structure between the empirical world and the map.” And I would add, in the ever-changing markets, we can judge that similarity of structure only after the fact.

See the menu page Analytical Methods for a rundown on where to go for information on Elliott wave analysis.

By Tim Bovee, Portland, Oregon, March 28, 2023

Disclaimer

Tim Bovee, Private Trader tracks the analysis and trades of a private trader for his own accounts. Nothing in this blog constitutes a recommendation to buy or sell stocks, options or any other financial instrument. The only purpose of this blog is to provide education and entertainment.

No trader is ever 100 percent successful in his or her trades. Trading in the stock and option markets is risky and uncertain. Each trader must make trading decisions for his or her own account, and take responsibility for the consequences.

License
Creative Commons License

All content on Tim Bovee, Private Trader by Timothy K. Bovee is licensed under a Creative Commons Attribution-ShareAlike 4.0 International License.

Based on a work at www.timbovee.com.

Trader’s Notebook

3:30 p.m. New York time

Half an hour before the closing bell. The S&P 500 futures traced a fluctuating sideways pattern during the session, reaching a high so far of 4034.25. The pause is a low-degree correction within the rising final wave, C{-9} within a larger upward correction, wave 2{-8}, that began on March 13. No change in this morning’s analysis. I’ve updated the chart.

9:35 a.m. New York time

What’s happening now? The S&P 500 E-mini futures rose after trading resumed overnight, reaching into the 4030s as the opening bell approached.

What does it mean? The upward correction that began on March 13 is in its 3rd and final leg. The price is almost certain to rise above the end of the 1st leg, 4073.75. The end of the present rise will most likely be the end of the upward correction and the start of an energetic decline that will carry the price below the correction’s starting point, 3839.25, and typically a significant distance below that level.

What are the alternatives? The end of present rise won’t be the end of the upward correction if it takes a compound form. A compound correction links two or three corrective patterns together. If the correction is compound, then the present 3rd-leg rise will be followed by a declining connecting wave, and then by a second corrective pattern.

Reading the chart. Elliott wave analysis views the chart as a complex structure of smaller waves nested within larger waves, which in turn are nested within still larger waves. My labeling system assigns numbers to the subwaves of trending waves, and letters to the subwaves of corrections. Each number or letter is followed by a subscript, in curly brackets, showing the waves position within the complex structure, called its “degree” in Elliott wave parlance. The smaller the number, the lower the degree. On this chart we’re dealing with relatively small waves, so the degree numbers are negative.

[S&P 500 E-mini futures at 3:30 p.m., 100-minute bars, with volume]

What does Elliott wave theory say? Wave B{-9} within the upward correction that began on March 13, wave 2{-8}, ended at the March 24 low, 3937. Wave C{-9}, now underway, will have three subwaves one degree lower and is in the first subwave, A{-10}.

Here are other waves that are important to the analysis:

Principal analysis:

  • The upward correction that began on March 13, wave 2{-8}, continues.
  • It is in the third of three subwaves, rising wave C{-9}.
  • Wave 2{-8} will be followed by a downtrend, wave 3{-8}, that will carry the price below the correction’s starting point, 3839.25, and most likely significantly below that level.

Alternative analysis:

  • Wave 2{-8}, the upward correction, will form a compound structure, linking together two or three corrective patterns.
  • Under that alternative, if it should occur, the present rising wave C{-9} will be followed by a declining connector wave, X{-9}, and then the first wave of a second corrective pattern.
  • The correction is a 2nd wave, and compounding is seen less often in 2nds. However, they do happen on occasion.

Bigger structures:

  • This is all happening within downtrending wave 3{-7}, which began on February 2.
  • Wave 3{-7} is a subwave of downtrending wave 3{-6}, which began on August 16, 2022.
  • Wave 3{-6} is encompassed by a series of larger declining waves, the smaller within the larger, stretching up five degrees to wave 4{-1}, which began on January 4, 2022.
  • Wave 4{-1} is the next-to-the-last wave within a large expanding Diagonal Triangle, wave 5{0}, that began on December 26, 2018
  • When wave 4{-1} is complete, wave 5{-1} will begin and will carry the wave above the January 4 high, 4808.25, and back to the upper boundary of the triangle, which gets higher continually and is approaching the 6000s.

We Are Here.

These are the waves currently in progress under my principal analysis. Each line on the list shows the wave number, with the subscript in curly brackets, the traditional degree name, the starting date, the starting price of the S&P 500 E-mini futures, and the direction of the wave.

  • S&P 500 Index:
  • 5{+3} Supercycle, 7/8/1932, 4.40 (up)
  • 5{+2} Cycle, 12/9/1974, 60.96 (up)
  • 5{+1} Primary, 3/6/2009, 666.79 (up)
  • 5{0} Intermediate, 12/26/2018, 2346.58 (up)
  • S&P 500 Futures and index:
  • 4{-1} Minor, 1/4/2022, 4808.25 (down) (futures), 4818.62 (down) (index)
  • S&P 500 Futures:
  • 1{-2} Minute, 1/4/2022, 4808.25 (down)
  • 1{-3} Minuette, 1/4/2022, 4808.25 (down)
  • 1{-4} Subminuette, 1/4/2022, 4808.25 (down)
  • 1{-5} Micro, 1/4/2022, 4808.25 (down)
  • 3{-6} Submicro, 8/16/2022, 4327.50 (down)
  • 3{-7} Minuscule, 2/2/2023, 4208.50 (down)

Learning and other resources. Elliott wave analysis provides context, not prophecy. As the 20th century semanticist Alfred Korzybski put it in his book Science and Sanity (1933), “The map is not the territory … The only usefulness of a map depends on similarity of structure between the empirical world and the map.” And I would add, in the ever-changing markets, we can judge that similarity of structure only after the fact.

See the menu page Analytical Methods for a rundown on where to go for information on Elliott wave analysis.

By Tim Bovee, Portland, Oregon, March 27, 2023

Disclaimer

Tim Bovee, Private Trader tracks the analysis and trades of a private trader for his own accounts. Nothing in this blog constitutes a recommendation to buy or sell stocks, options or any other financial instrument. The only purpose of this blog is to provide education and entertainment.

No trader is ever 100 percent successful in his or her trades. Trading in the stock and option markets is risky and uncertain. Each trader must make trading decisions for his or her own account, and take responsibility for the consequences.

License
Creative Commons License

All content on Tim Bovee, Private Trader by Timothy K. Bovee is licensed under a Creative Commons Attribution-ShareAlike 4.0 International License.

Based on a work at www.timbovee.com.
Trader’s Notebook

3:30 p.m. New York time

Half an hour before the closing bell. The S&P 500 futures rose during the session, breaking above the overnight high but remaining well below the starting point of the present middle wave within the final wave of the upward correction that began on March 13. No change in this morning’s analysis. I’ve updated the chart.

9:35 a.m. New York time

What’s happening now? The S&P 500 E-mini futures fell overnight, reaching into the 3930s so far.

What does it mean? The declining middle wave of a three-wave upward correction is underway and is in its 2nd of three subwaves. When the middle wave has reached its end, the rising final wave will begin, likely carrying the price back to the 4070s and perhaps above. The correction began on March 13 from 3839.25. The upward correction is a 2nd wave, meaning that it cannot, under the rules of Elliott Wave Theory, move beyond the start ing point of the correction, setting a limit on how far the present declining middle wave can travel. The correction will be followed by a downtrending wave that will drop below 3839.25 and perhaps significantly so.

What are the alternatives? None at present. Yesterday’s Trader’s Notebook noted that the present decline might be a subwave within the rising first wave of the correction. The price has fallen far enough that I no longer consider that to be a likely alternative.

Reading the chart. Elliott wave analysis views the chart as a complex structure of smaller waves nested within larger waves, which in turn are nested within still larger waves. My labeling system assigns numbers to the subwaves of trending waves, and letters to the subwaves of corrections. Each number or letter is followed by a subscript, in curly brackets, showing the waves position within the complex structure, called its “degree” in Elliott wave parlance. The smaller the number, the lower the degree. On this chart we’re dealing with relatively small waves, so the degree numbers are negative.

[S&P 500 E-mini futures at 3:30 p.m., 100-minute bars, with volume]

What does Elliott wave theory say? Wave B{-9} within the upward correction, wave 2{-8}, is in progress and will have three subwaves one degree lower. It is presently in the middle subwave, wave B{-9}. Under the rules of Elliott wave theory, wave B{-9} cannot move below 3839.25, the starting point of wave 2{-8}. If the price drops below that level, then the analysis will no longer match the chart and will be reanalyzed.

Here are the waves that are important to the analysis:

Principal analysis:

  • The upward correction that began on March 13, wave 2{-8}, continues.
  • It is in the second of three subwaves, declining wave B{-9}.
  • Wave 2{-8} will be followed by a downtrend, wave 3{-8}, that will carry the price below the correction’s starting point, 3839.25, and most likely significantly below that level.
  • This is all happening within downtrending wave 3{-7}, which began on February 2.
  • Wave 3{-7} is a subwave of downtrending wave 3{-6}, which began on August 16, 2022.

Bigger structures:

  • Wave 3{-6} is encompassed by a series of larger declining waves, the smaller within the larger, stretching up five degrees to wave 4{-1}, which began on January 4, 2022.
  • Wave 4{-1} is the next-to-the-last wave within a large expanding Diagonal Triangle, wave 5{0}, that began on December 26, 2018
  • When wave 4{-1} is complete, wave 5{-1} will begin and will carry the wave above the January 4 high, 4808.25, and back to the upper boundary of the triangle, which gets higher continually and is approaching the 6000s.

We Are Here.

These are the waves currently in progress under my principal analysis. Each line on the list shows the wave number, with the subscript in curly brackets, the traditional degree name, the starting date, the starting price of the S&P 500 E-mini futures, and the direction of the wave.

  • S&P 500 Index:
  • 5{+3} Supercycle, 7/8/1932, 4.40 (up)
  • 5{+2} Cycle, 12/9/1974, 60.96 (up)
  • 5{+1} Primary, 3/6/2009, 666.79 (up)
  • 5{0} Intermediate, 12/26/2018, 2346.58 (up)
  • S&P 500 Futures and index:
  • 4{-1} Minor, 1/4/2022, 4808.25 (down) (futures), 4818.62 (down) (index)
  • S&P 500 Futures:
  • 1{-2} Minute, 1/4/2022, 4808.25 (down)
  • 1{-3} Minuette, 1/4/2022, 4808.25 (down)
  • 1{-4} Subminuette, 1/4/2022, 4808.25 (down)
  • 1{-5} Micro, 1/4/2022, 4808.25 (down)
  • 3{-6} Submicro, 8/16/2022, 4327.50 (down)
  • 3{-7} Minuscule, 2/2/2023, 4208.50 (down)

Learning and other resources. Elliott wave analysis provides context, not prophecy. As the 20th century semanticist Alfred Korzybski put it in his book Science and Sanity (1933), “The map is not the territory … The only usefulness of a map depends on similarity of structure between the empirical world and the map.” And I would add, in the ever-changing markets, we can judge that similarity of structure only after the fact.

See the menu page Analytical Methods for a rundown on where to go for information on Elliott wave analysis.

By Tim Bovee, Portland, Oregon, March 24, 2023

Disclaimer

Tim Bovee, Private Trader tracks the analysis and trades of a private trader for his own accounts. Nothing in this blog constitutes a recommendation to buy or sell stocks, options or any other financial instrument. The only purpose of this blog is to provide education and entertainment.

No trader is ever 100 percent successful in his or her trades. Trading in the stock and option markets is risky and uncertain. Each trader must make trading decisions for his or her own account, and take responsibility for the consequences.

License
Creative Commons License

All content on Tim Bovee, Private Trader by Timothy K. Bovee is licensed under a Creative Commons Attribution-ShareAlike 4.0 International License.

Based on a work at www.timbovee.com.

Trader’s Notebook

3:30 p.m. New York time

Half an hour before the closing bell. The S&P 500 futures fell to the 3940s during the session.

The decline was the first subwave of the middle portion of the upward correction that began on March 13, and the rise was the second subwave. The third subwave is now in progress. That is how I have marked the chart.

Alternatively, all three waves after the March 22 peak are parts of the first subwave.

In Elliott wave terms, the principal analysis is that declining wave C{-10} within wave B{-9} within the upward correction, wave 2{-9}, is underway. The alternative moves the waves within wave B{-9} down one degree. Under that scenario, wave C{-11} within wave A{-10} within wave B{-9} is underway. Future events will clarify the degrees.

I’ve updated the chart.

9:35 a.m. New York time

What’s happening now? The S&P 500 E-mini futures reached a high overnight of 4001.25 and then fell into the 3970s before retracing part of the decline.

What does it mean? The first segment of an upward correction that began on March 13 ended on March 22 at 4073.75. The decline was an early subwave of the second of three segments.

What are the alternatives? It’s possible the overnight decline is a subwave of the correction’s first segment.

Under both the principal analysis and the alternative, the price will decline and then move above the March 22 high, 4073.75. The decline will be shallower under the alternative, deeper under the principal analysis.

Reading the chart. Elliott wave analysis views the chart as a complex structure of smaller waves nested within larger waves, which in turn are nested within still larger waves. My labeling system assigns numbers to the subwaves of trending waves, and letters to the subwaves of corrections. Each number or letter is followed by a subscript, in curly brackets, showing the waves position within the complex structure, called its “degree” in Elliott wave parlance. The smaller the number, the lower the degree. On this chart we’re dealing with relatively small waves, so the degree numbers are negative.

Wait a minute. Why are the chart’s wave numbers wildly different from yesterday morning? For those who didn’t see yesterday afternoon’s Trader’s Notebook, the price moved contrary to a rule of Elliott wave theory, and I reanalyzed the chart. The upward correction that began on March 13 is still there, but it is a larger degree compared to the former analysis. See the analysis and my reasoning here.

[S&P 500 E-mini futures at 3:30 p.m., 90-minute bars, with volume]

What does Elliott wave theory say? Wave A{-9} within the upward correction, wave 2{-8} ended on March 22, and wave B{-9} has begun. Wave A{-9} had five subwaves, meaning that the correction is taking the form of a Zigzag. Wave B{-9} will have three subwaves, and wave C{-9} will have five.

Here is a discussion of waves that are important to the analysis.

Principal analysis:

  • The upward correction that began on March 13, wave 2{-8}, continues.
  • It is in the second of three subwaves, wave B{-9}, which in turn is in its first subwave, wave A{-10}.
  • Wave 2{-8} will be followed by a downtrend, wave 3{-8}, that will carry the price below the correction’s starting point, 3839.25, and most likely significantly below that level.

Alternative analysis:

  • Wave A{-9} is still underway and the overnight decline is a subwave within it.

Bigger structures:

  • This is all happening within wave 3{-7}, which began on February 2.
  • Wave 3{-7} is a subwave of wave 3{-6}, which began on August 16, 2022.
  • Wave 3{-6} is encompassed by a series of larger waves, the smaller within the larger, stretching up five degrees to wave 4{-1}, which began on January 4, 2022.
  • Wave 4{-1} is the next-to-the-last wave within a large expanding Diagonal Triangle, wave 5{0}, that began on December 26, 2018
  • When wave 4{-1} is complete, wave 5{-1} will begin and will carry the wave above the January 4 high, 4808.25, and into the 6000s, where the present upper boundary of the triangle lies. The expanding part means that each day that upper boundary moves higher.

We Are Here.

These are the waves currently in progress under my principal analysis. Each line on the list shows the wave number, with the subscript in curly brackets, the traditional degree name, the starting date, the starting price of the S&P 500 E-mini futures, and the direction of the wave.

  • S&P 500 Index:
  • 5{+3} Supercycle, 7/8/1932, 4.40 (up)
  • 5{+2} Cycle, 12/9/1974, 60.96 (up)
  • 5{+1} Primary, 3/6/2009, 666.79 (up)
  • 5{0} Intermediate, 12/26/2018, 2346.58 (up)
  • S&P 500 Futures and index:
  • 4{-1} Minor, 1/4/2022, 4808.25 (down) (futures), 4818.62 (down) (index)
  • S&P 500 Futures:
  • 1{-2} Minute, 1/4/2022, 4808.25 (down)
  • 1{-3} Minuette, 1/4/2022, 4808.25 (down)
  • 1{-4} Subminuette, 1/4/2022, 4808.25 (down)
  • 1{-5} Micro, 1/4/2022, 4808.25 (down)
  • 3{-6} Submicro, 8/16/2022, 4327.50 (down)
  • 3{-7} Minuscule, 2/2/2023, 4208.50 (down)

Learning and other resources. Elliott wave analysis provides context, not prophecy. As the 20th century semanticist Alfred Korzybski put it in his book Science and Sanity (1933), “The map is not the territory … The only usefulness of a map depends on similarity of structure between the empirical world and the map.” And I would add, in the ever-changing markets, we can judge that similarity of structure only after the fact.

See the menu page Analytical Methods for a rundown on where to go for information on Elliott wave analysis.

By Tim Bovee, Portland, Oregon, March 23, 2023

Disclaimer

Tim Bovee, Private Trader tracks the analysis and trades of a private trader for his own accounts. Nothing in this blog constitutes a recommendation to buy or sell stocks, options or any other financial instrument. The only purpose of this blog is to provide education and entertainment.

No trader is ever 100 percent successful in his or her trades. Trading in the stock and option markets is risky and uncertain. Each trader must make trading decisions for his or her own account, and take responsibility for the consequences.

License
Creative Commons License

All content on Tim Bovee, Private Trader by Timothy K. Bovee is licensed under a Creative Commons Attribution-ShareAlike 4.0 International License.

Based on a work at www.timbovee.com.

Trader’s Notebook

3:30 p.m. New York time

Half an hour before the closing bell. The S&P 500 futures shot up to 4073.75 after the Federal Open Market Committee raised the Federal Funds Rate by 0.25% to a range of 4.5% to 4.75%. It then fell sharply, reaching close to 4000 as the closing bell approached.

The high price broke a rule of Elliott wave analysis, discussed this morning (below) before the Fed announcement. Because of the magnitude of the rise, this morning’s analysis no longer matches the reality of the market — the map doesn’t match the territory — and I have performed a reanalysis.

The new analysis:

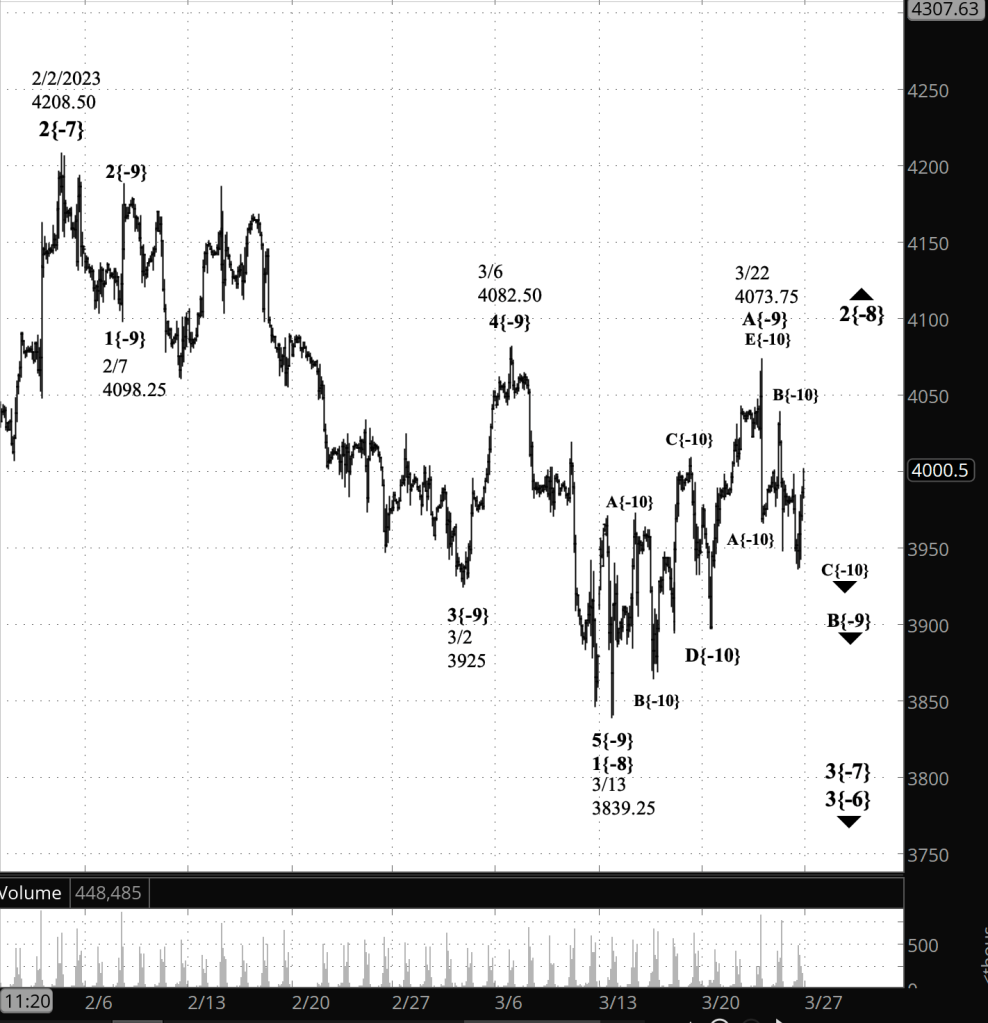
An upward correction that began on March 13 continues and is in its initial wave. The wave is a 2nd wave, and the rules of Elliott wave analysis set an upper limit on 2nd waves: They don’t move beyond the starting point of the preceding 1st wave. In this case, the 1st wave began from 4208.50, and that is the firm upper limit to the upward correction.

In Elliott wave terminology, the upward correction is wave 2{-8}, the second wave within wave 3{-7}, a downtrend that began on February 2. Wave 2{-8} is in its first internal wave, A{-9}, which in turn is in its final wave, E{-10}. The preceding 1st wave, which sets an upper limit on the correction, is wave 1{-8}, which began on February 2 from 4208.50.

I’ve retained the chart of the old analysis from this morning. Here is a chart of the revised analysis:

[S&P 500 E-mini futures at 3:30 p.m., 90-minute bars, with volume]

9:35 a.m. New York time

Outdated. The analysis below has been made obsolete by events. See this afternoon’s analysis, above.

What’s happening now? The S&P 500 E-mini futures rose to 4043.25 at the end of yesterday’s session and spent the night trading sideways slightly below that level.

What does it mean? Traders are fishing for a top with very little room on the upside to achieve one. Under a rule of Elliott wave analysis, the March 21 peak was 4.75 points below the upper limit of the upward correction that began on March 13.

The Federal Open Market Committee will release a statement at 2 this afternoon, announcing their decision on raising the Federal Funds Rate. Generally such announcements are met with several minutes of wild swings by the S&P 500 and its derivatives. If a swing moves beyond the upper limit and then declines the rest of the day and into tomorrow, how should the chart be interpreted?

The present upward correction is the 4th wave of a downtrend. Under the Elliott rules, a 4th wave can’t move into the territory of the preceding 1st wave. That 1st wave ended at 4043.25 on the futures, 3959.79 on the index. The price on the index has already exceeded that level. The futures price has not, so we’re already ensnared in a discrepancy.

Futures move in 25-cent increments, and the index moves in one-cent increments. So that difference means that the index could move above the level and the futures remain below, as long as the discrepancy was within 25 cents. Under those circumstances, it wouldn’t necessarily count as triggering the rule. But in this case, the index is 50 cents above the futures, so the rule really has been triggered.

Moreover, Elliott wave theory treats the markets as being a reflection of the public’s opinion and mood, as expressed by traders. Does a wild swing in response to a Fed announcement really represent the consensus opinion and mood of traders and the wider public? I’ve always figured that a good portion of those swings are driven by AI trading computers, along with day traders. Does the opinion and mood of a machine that mimics intelligence count in an analysis of the public’s opinion and mood?

Unanswerable questions. The markets of 2023 are far more complex than the markets analyzed by R.N. Elliott when he developed Elliott wave analysis. Given the pattern on the chart, a re-analysis won’t be a simple matter. Today, my plan is to ignore the rule, call the top if it happens, and deal with the rule and labelling problem today and possibly tonight.

What are the alternatives? The main alternative is a product of the game called “Find the Top”. Any higher high is potentially the top at this point, but we really won’t know for sure until the price has fallen far enough to the the top call a degree of credibility.

Reading the chart. Elliott wave analysis views the chart as a complex structure of smaller waves nested within larger waves, which in turn are nested within still larger waves. My labeling system assigns numbers to the subwaves of trending waves, and letters to the subwaves of corrections. Each number or letter is followed by a subscript, in curly brackets, showing the waves position within the complex structure, called its “degree” in Elliott wave parlance. The smaller the number, the lower the degree. On this chart we’re dealing with relatively small waves, so the degree numbers are negative.

[The former analysis: S&P 500 E-mini futures at 9:35 a.m., 40-minute bars, with volume]

What does Elliott wave theory say? Rising wave E{-16} continues. It is the final wave within the larger final wave, C{-15), of the upward correction, wave 4{-14}. It’s completion will bring wave 4{-14} to an end.

Here is a discussion of waves that are important to the analysis.

Principal analysis:

  • The downward correction that began on February 2, wave 3{-7}, continues.
  • It is in the first of five subwaves, wave 1{-8}.
  • Within wave 1{-8}, wave 1{-9} is underway and is in the final subwave within a five-wave structure, downtrending wave 5{-10}.
  • Wave 5{-10}, in turn, is in its middle wave, 3{-11}, which is in its final wave, 5{-12}..
  • The end of wave 5{-12} will also be the end of wave 3{-11}, a subwave of downtrending wave 5{-10}.
  • When wave 5{-10} is complete, it will also mark the end of wave 1{-9} and the beginning of a low-degree upward correction, wave 2{-9}.
  • Within wave 5{-12}, downtrending wave 1{-13} is underway and internally is in wave 4{-14}, an upward correction.
  • Wave 4{-14} is in its final internal wave, C{-15}, which in turn is in its final subwave, E{-16}.
  • Under the rules of Elliott wave analysis, wave 4{-14} cannot exceed the end of the preceding 1st wave of the same degree, wave 1{-14}, which ended at 4048.
  • Wave 4{-14} will be followed by downtrending wave 5{-14}, which will complete its parent, wave 1{-13}
  • Wave 1{-13} and the start of an upward correction, wave 2{-13}.
  • Wave 3{-7} is still taking its tentative first steps and will develop into a powerful downtrend that will carry the price below 3502, the starting point of the preceding upward correction, wave 2{-7}, and most likely significantly below that level.

Bigger structures:

  • This is all happening within wave 3{-6}, which began on August 16, 2022.
  • Wave 3{-6} is encompassed by a series of larger waves, the smaller within the larger, stretching up five degrees to wave 4{-1}, which began on January 4, 2022.
  • Wave 4{-1} is the next-to-the-last wave within a large expanding Diagonal Triangle, wave 5{0}, that began on December 26, 2018
  • When wave 4{-1} is complete, wave 5{-1} will begin and will carry the wave above the January 4 high, 4808.25, and into the 6000s, where the present upper boundary of the triangle lies. The expanding part means that each day that upper boundary moves higher.

We Are Here.

These are the waves currently in progress under my principal analysis. Each line on the list shows the wave number, with the subscript in curly brackets, the traditional degree name, the starting date, the starting price of the S&P 500 E-mini futures, and the direction of the wave.

  • S&P 500 Index:
  • 5{+3} Supercycle, 7/8/1932, 4.40 (up)
  • 5{+2} Cycle, 12/9/1974, 60.96 (up)
  • 5{+1} Primary, 3/6/2009, 666.79 (up)
  • 5{0} Intermediate, 12/26/2018, 2346.58 (up)
  • S&P 500 Futures and index:
  • 4{-1} Minor, 1/4/2022, 4808.25 (down) (futures), 4818.62 (down) (index)
  • S&P 500 Futures:
  • 1{-2} Minute, 1/4/2022, 4808.25 (down)
  • 1{-3} Minuette, 1/4/2022, 4808.25 (down)
  • 1{-4} Subminuette, 1/4/2022, 4808.25 (down)
  • 1{-5} Micro, 1/4/2022, 4808.25 (down)
  • 3{-6} Submicro, 8/16/2022, 4327.50 (down)
  • 3{-7} Minuscule, 2/2/2023, 4208.50 (down)

Learning and other resources. Elliott wave analysis provides context, not prophecy. As the 20th century semanticist Alfred Korzybski put it in his book Science and Sanity (1933), “The map is not the territory … The only usefulness of a map depends on similarity of structure between the empirical world and the map.” And I would add, in the ever-changing markets, we can judge that similarity of structure only after the fact.

See the menu page Analytical Methods for a rundown on where to go for information on Elliott wave analysis.

By Tim Bovee, Portland, Oregon, March 22, 2023

Disclaimer

Tim Bovee, Private Trader tracks the analysis and trades of a private trader for his own accounts. Nothing in this blog constitutes a recommendation to buy or sell stocks, options or any other financial instrument. The only purpose of this blog is to provide education and entertainment.

No trader is ever 100 percent successful in his or her trades. Trading in the stock and option markets is risky and uncertain. Each trader must make trading decisions for his or her own account, and take responsibility for the consequences.

License
Creative Commons License

All content on Tim Bovee, Private Trader by Timothy K. Bovee is licensed under a Creative Commons Attribution-ShareAlike 4.0 International License.

Based on a work at www.timbovee.com.