Trader’s Notebook

3:30 p.m. New York time

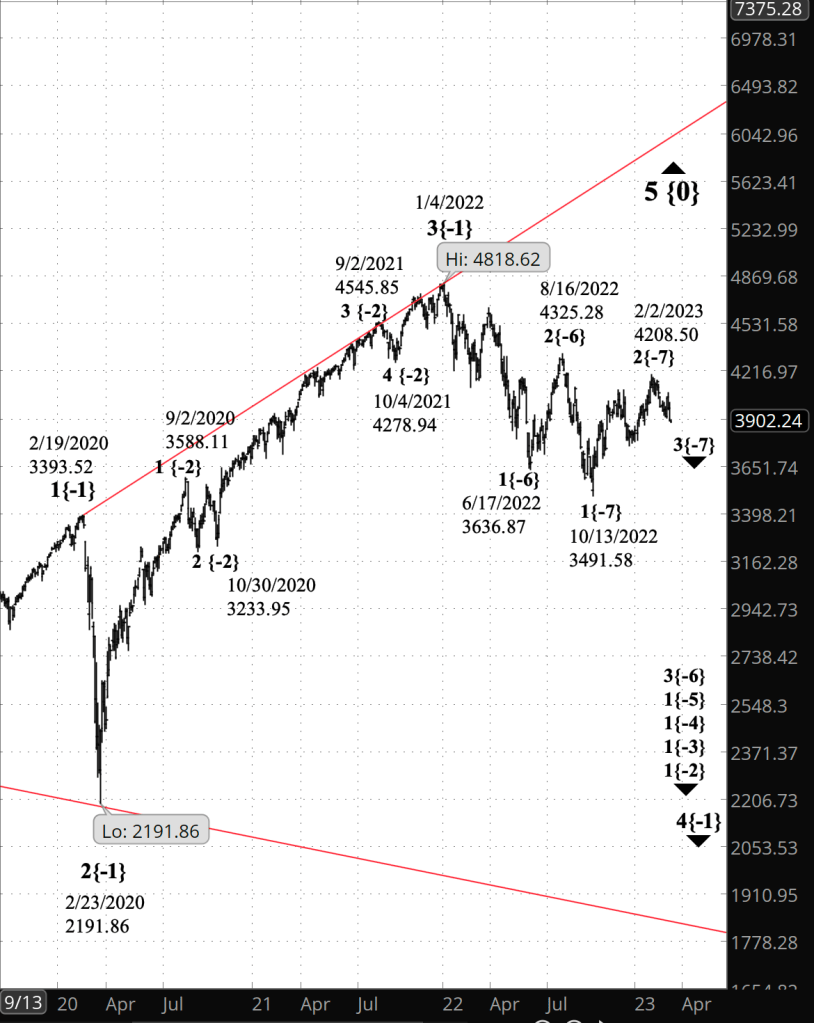
Half an hour before the closing bell. The S&P 500 futures continued to rise during the session, reaching a high so far of 4033.75. The last wave, {E-16}, within the larger last wave, {C-15}, within the upward correction, 4{-14}, is underway. I count E{-16} as also being in its last wave, E{-17}, although the pattern in a bit muddy at that low degree.

This morning’s analysis stands. I’ve updated the chart.

9:35 a.m. New York time

What’s happening now? The S&P 500 E-mini futures rose overnight, reaching into the 4020s.

What does it mean? The upward correction that began on March 13 is nearing its end. The correction is the 4th wave in a five-wave downtrend that began on March 6. Elliott wave analysis has very few rules. One is that 4th wave cannot move beyond the start of the preceding 1st wave in the series. In this case, the first wave ended at 4080, and if the present upward correction rises above that price, then the analysis no longer matches the chart and must be redone.

What are the alternatives? There are none. The three alternatives laid out in yesterday’s analysis have all been knocked out by rise above 4009.25, the March 17 high.

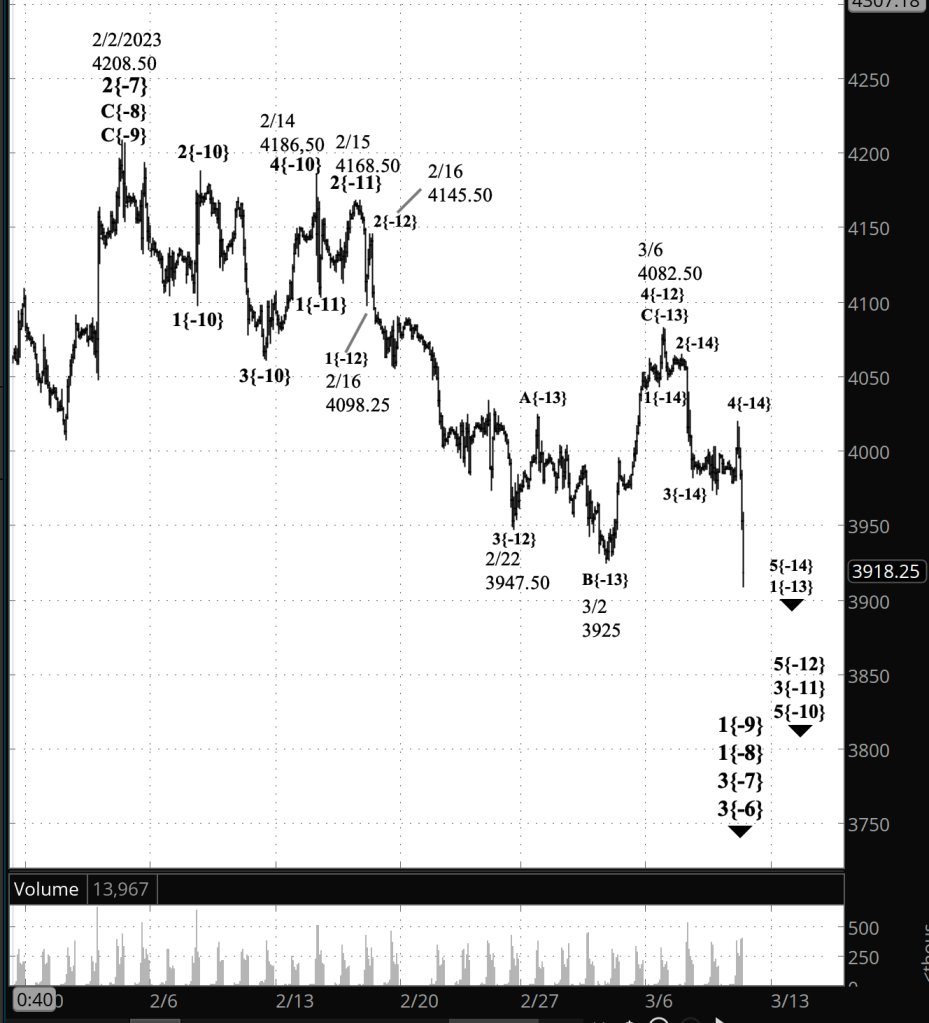
Reading the chart. Elliott wave analysis views the chart as a complex structure of smaller waves nested within larger waves, which in turn are nested within still larger waves. My labeling system assigns numbers to the subwaves of trending waves, and letters to the subwaves of corrections. Each number or letter is followed by a subscript, in curly brackets, showing the waves position within the complex structure, called its “degree” in Elliott wave parlance. The smaller the number, the lower the degree. On this chart we’re dealing with relatively small waves, so the degree numbers are negative.

[S&P 500 E-mini futures at 3:30 p.m., 40-minute bars, with volume]

What does Elliott wave theory say? Rising wave E{-16} has begun. It is the final wave within the larger final wave, C{-15), of the upward correction, wave 4{-14}. It’s completion will bring wave 4{-14} to an end.

Here is a discussion of waves that are important to the analysis.

Principal analysis:

  • The downward correction that began on February 2, wave 3{-7}, continues.
  • It is in the first of five subwaves, wave 1{-8}.
  • Within wave 1{-8}, wave 1{-9} is underway and is in the final subwave within a five-wave structure, downtrending wave 5{-10}.
  • Wave 5{-10}, in turn, is in its middle wave, 3{-11}, which is in its final wave, 5{-12}..
  • The end of wave 5{-12} will also be the end of wave 3{-11}, a subwave of downtrending wave 5{-10}.
  • When wave 5{-10} is complete, it will also mark the end of wave 1{-9} and the beginning of a low-degree upward correction, wave 2{-9}.
  • Within wave 5{-12}, downtrending wave 1{-13} is underway and internally is in wave 4{-14}, an upward correction.
  • Wave 4{-14} is in its final internal wave, C{-15}, which in turn is in its final subwave, E{-16}.
  • Wave 4{-14} cannot exceed the end of the preceding 1st wave of the same degree, wave 1{-14}, which ended at 4048.
  • Wave 4{-14} will be followed by downtrending wave 5{-14}, which will complete its parent, wave 1{-13}
  • Wave 1{-13} and the start of an upward correction, wave 2{-13}.
  • Wave 3{-7} is still taking its tentative first steps and will develop into a powerful downtrend that will carry the price below 3502, the starting point of the preceding upward correction, wave 2{-7}, and most likely significantly below that level.

Bigger structures:

  • This is all happening within wave 3{-6}, which began on August 16, 2022.
  • Wave 3{-6} is encompassed by a series of larger waves, the smaller within the larger, stretching up five degrees to wave 4{-1}, which began on January 4, 2022.
  • Wave 4{-1} is the next-to-the-last wave within a large expanding Diagonal Triangle, wave 5{0}, that began on December 26, 2018
  • When wave 4{-1} is complete, wave 5{-1} will begin and will carry the wave above the January 4 high, 4808.25, and into the 6000s, where the present upper boundary of the triangle lies. The expanding part means that each day that upper boundary moves higher.

We Are Here.

These are the waves currently in progress under my principal analysis. Each line on the list shows the wave number, with the subscript in curly brackets, the traditional degree name, the starting date, the starting price of the S&P 500 E-mini futures, and the direction of the wave.

  • S&P 500 Index:
  • 5{+3} Supercycle, 7/8/1932, 4.40 (up)
  • 5{+2} Cycle, 12/9/1974, 60.96 (up)
  • 5{+1} Primary, 3/6/2009, 666.79 (up)
  • 5{0} Intermediate, 12/26/2018, 2346.58 (up)
  • S&P 500 Futures and index:
  • 4{-1} Minor, 1/4/2022, 4808.25 (down) (futures), 4818.62 (down) (index)
  • S&P 500 Futures:
  • 1{-2} Minute, 1/4/2022, 4808.25 (down)
  • 1{-3} Minuette, 1/4/2022, 4808.25 (down)
  • 1{-4} Subminuette, 1/4/2022, 4808.25 (down)
  • 1{-5} Micro, 1/4/2022, 4808.25 (down)
  • 3{-6} Submicro, 8/16/2022, 4327.50 (down)
  • 3{-7} Minuscule, 2/2/2023, 4208.50 (down)

Learning and other resources. Elliott wave analysis provides context, not prophecy. As the 20th century semanticist Alfred Korzybski put it in his book Science and Sanity (1933), “The map is not the territory … The only usefulness of a map depends on similarity of structure between the empirical world and the map.” And I would add, in the ever-changing markets, we can judge that similarity of structure only after the fact.

See the menu page Analytical Methods for a rundown on where to go for information on Elliott wave analysis.

By Tim Bovee, Portland, Oregon, March 21, 2023

Disclaimer

Tim Bovee, Private Trader tracks the analysis and trades of a private trader for his own accounts. Nothing in this blog constitutes a recommendation to buy or sell stocks, options or any other financial instrument. The only purpose of this blog is to provide education and entertainment.

No trader is ever 100 percent successful in his or her trades. Trading in the stock and option markets is risky and uncertain. Each trader must make trading decisions for his or her own account, and take responsibility for the consequences.

License
Creative Commons License

All content on Tim Bovee, Private Trader by Timothy K. Bovee is licensed under a Creative Commons Attribution-ShareAlike 4.0 International License.

Based on a work at www.timbovee.com.
Trader’s Notebook

3:30 p.m. New York time

Half an hour before the closing bell. The S&P 500 futures continued to rise during the session, reaching into the 3980s. Wave E{-16} within wave C{-15} within an upward correction, wave 4{-14} continues. No change in the analysis. I’ve updated the chart.

9:35 a.m. New York time

What’s happening now? The S&P 500 E-mini futures fell after trading resumed overnight, reaching a low of 3897.25 and then reversing, returning to the 3960s.

What does it mean? The final wave of an upward correction that began on March 13 continues. Internally, its final subwave is rising to a conclusion. When the correction is complete, it will be followed by a downtrend that will carry the price below 3839.25, the correction’s starting point, and likely significantly below that level.

What are the alternatives? There are three:

Alternative #1: The three-wave correction ended on March 17 at 4009.25, and the subsequent downtrend has begun.

Alternative #2: The initial three-wave corrective pattern within a compound correction ended at the March 17 high. The decline that followed is a connecting wave that will be followed by a second corrective pattern. Altogether, compound corrections can contain up to three corrective patterns.

Alternative #3: The decline that began on March 17 under the principal analysis is a subwave of the larger final wave of the correction. It’s possible that it is possible that the next-to-the-last wave within that subwave is still underway and the final wave has not yet begun.

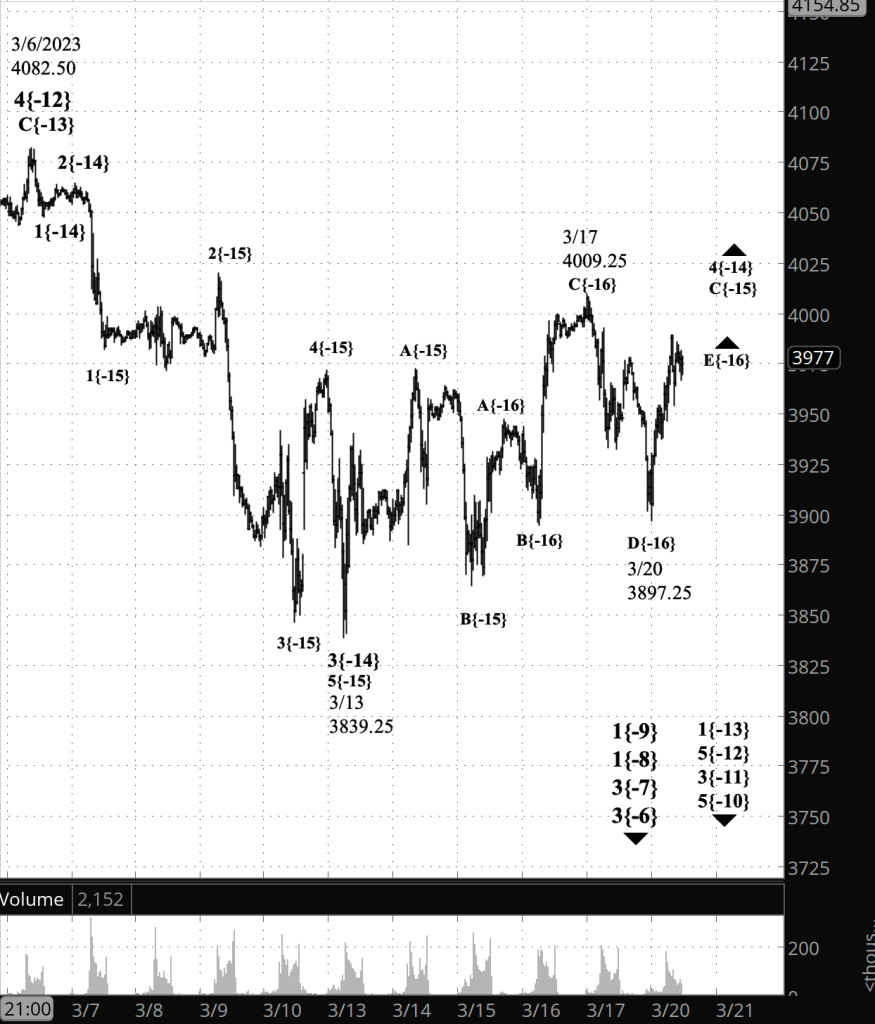
Reading the chart. Elliott wave analysis views the chart as a complex structure of smaller waves nested within larger waves, which in turn are nested within still larger waves. My labeling system assigns numbers to the subwaves of trending waves, and letters to the subwaves of corrections. Each number or letter is followed by a subscript, in curly brackets, showing the waves position within the complex structure, called its “degree” in Elliott wave parlance. The smaller the number, the lower the degree. On this chart we’re dealing with relatively small waves, so the degree numbers are negative.

I’ve moved the chart in to focus on the final wave of a larger downtrend. The final wave, 5{-12}, began on March 6. The downtrend of which it is a subwave, 3{-11}, began on February 15.

[S&P 500 E-mini futures at 3:30 p.m., 30-minute bars, with volume]

What does Elliott wave theory say? Wave D{-16} within wave C{-15} within the upward correction, wave 4{-14}, ended at the overnight low. Rising wave E{-16}, the final wave with wave C{-15}, has begun.I t’s completion will bring wave 4{-14} to an end.

Here is a rundown of waves that are important to the analysis.

Principal analysis:

  • The downward correction that began on February 2, wave 3{-7}, continues.
  • It is in the first of five subwaves, wave 1{-8}.
  • Within wave 1{-8}, wave 1{-9} is underway and is in the final subwave within a five-wave structure, downtrending wave 5{-10}.
  • Wave 5{-10}, in turn, is in its middle wave, 3{-11}, which is in its final wave, 5{-12}..
  • The end of wave 5{-12} will also be the end of wave 3{-11}, a subwave of downtrending wave 5{-10}.
  • When wave 5{-10} is complete, it will also mark the end of wave 1{-9} and the beginning of a low-degree upward correction, wave 2{-9}.
  • Within wave 5{-12}, downtrending wave 1{-13} is underway and internally is in wave 4{-14}, an upward correction.
  • Wave 4{-14} is in its final internal wave, C{-15}, which in turn is in its final subwave, E{-16}.
  • Wave 4{-14} will be followed by downtrending wave 5{-14}, which will complete its parent, wave 1{-13}
  • Wave 1{-13} and the start of an upward correction, wave 2{-13}.
  • Wave 3{-7} is still taking its tentative first steps and will develop into a powerful downtrend that will carry the price below 3502, the starting point of the preceding upward correction, wave 2{-7}, and most likely significantly below that level.

Alternative analysis #1

  • Wave C{-15} and its parent, wave 4{-14}, ended at the March 17 peak. Wave 5{-15}, a downtrend, has begun.

Alternative analysis #2

  • Wave C{-15} ended at the March 17 peak, ending a corrective pattern. The parent wave 4{-14} is forming a compound correction, and the decline that followed the March 17 peak was a connector, wave X{-15}, and the rise that followed is the beginning of a second corrective pattern, wave A{-15}.

Alternative analysis #3

  • Falling wave D{-16} within wave C{-15} within wave 4{-14} is still underway.

Bigger structures:

  • This is all happening within wave 3{-6}, which began on August 16, 2022.
  • Wave 3{-6} is encompassed by a series of larger waves, the smaller within the larger, stretching up five degrees to wave 4{-1}, which began on January 4, 2022.
  • Wave 4{-1} is the next-to-the-last wave within a large expanding Diagonal Triangle, wave 5{0}, that began on December 26, 2018
  • When wave 4{-1} is complete, wave 5{-1} will begin and will carry the wave above the January 4 high, 4808.25, and into the 6000s, where the present upper boundary of the triangle lies. The expanding part means that each day that upper boundary moves higher.

We Are Here.

These are the waves currently in progress under my principal analysis. Each line on the list shows the wave number, with the subscript in curly brackets, the traditional degree name, the starting date, the starting price of the S&P 500 E-mini futures, and the direction of the wave.

  • S&P 500 Index:
  • 5{+3} Supercycle, 7/8/1932, 4.40 (up)
  • 5{+2} Cycle, 12/9/1974, 60.96 (up)
  • 5{+1} Primary, 3/6/2009, 666.79 (up)
  • 5{0} Intermediate, 12/26/2018, 2346.58 (up)
  • S&P 500 Futures and index:
  • 4{-1} Minor, 1/4/2022, 4808.25 (down) (futures), 4818.62 (down) (index)
  • S&P 500 Futures:
  • 1{-2} Minute, 1/4/2022, 4808.25 (down)
  • 1{-3} Minuette, 1/4/2022, 4808.25 (down)
  • 1{-4} Subminuette, 1/4/2022, 4808.25 (down)
  • 1{-5} Micro, 1/4/2022, 4808.25 (down)
  • 3{-6} Submicro, 8/16/2022, 4327.50 (down)
  • 3{-7} Minuscule, 2/2/2023, 4208.50 (down)

Learning and other resources. Elliott wave analysis provides context, not prophecy. As the 20th century semanticist Alfred Korzybski put it in his book Science and Sanity (1933), “The map is not the territory … The only usefulness of a map depends on similarity of structure between the empirical world and the map.” And I would add, in the ever-changing markets, we can judge that similarity of structure only after the fact.

See the menu page Analytical Methods for a rundown on where to go for information on Elliott wave analysis.

By Tim Bovee, Portland, Oregon, March 20, 2023

Disclaimer

Tim Bovee, Private Trader tracks the analysis and trades of a private trader for his own accounts. Nothing in this blog constitutes a recommendation to buy or sell stocks, options or any other financial instrument. The only purpose of this blog is to provide education and entertainment.

No trader is ever 100 percent successful in his or her trades. Trading in the stock and option markets is risky and uncertain. Each trader must make trading decisions for his or her own account, and take responsibility for the consequences.

License
Creative Commons License

All content on Tim Bovee, Private Trader by Timothy K. Bovee is licensed under a Creative Commons Attribution-ShareAlike 4.0 International License.

Based on a work at www.timbovee.com.

Trader’s Notebook

3:30 p.m. New York time

Half an hour before the closing bell. The S&P 500 futures continued falling during the session, reaching the 3920s. There’s no change to this morning’s analysis. The final wave, C{-15} within the upward correction that began on March 13, wave 4{-14}, continues, and is in its fourth wave internally, declining wave D{16}.

I’ve updated the chart.

9:35 a.m. New York time

What’s happening now? The S&P 500 E-mini futures peaked at 4009.25 overnight and then declined.

What does it mean? An upward correction that began on March 13 is in its final wave and within it, in the fourth of five subwaves. The present decline will be quickly followed by a final rise that will bring the correction to an end. After the correction is complete, the downtrend that began on March 6 will resume.

What are the alternatives? After the correction is complete, it could become apparent that the correction is forming a compound structure, linking two or three corrective patterns together. If so, then the first corrective pattern now underway will be followed by a linking wave and then by a second corrective pattern.

Reading the chart. Elliott wave analysis views the chart as a complex structure of smaller waves nested within larger waves, which in turn are nested within still larger waves. My labeling system assigns numbers to the subwaves of trending waves, and letters to the subwaves of corrections. Each number or letter is followed by a subscript, in curly brackets, showing the waves position within the complex structure, called its “degree” in Elliott wave parlance. The smaller the number, the lower the degree. On this chart we’re dealing with relatively small waves, so the degree numbers are negative.

[S&P 500 E-mini futures at 3:30 p.m., 100-minute bars, with volume]

What does Elliott wave theory say? Wave C{-16} within wave C{-15} within the upward correction, wave 4{-14}, ended at the overnight peak. Falling wave D{-16} has begun. It will be followed by rising wave E{-16}, which will bring wave 4{-14} to an end.

Here is a rundown of waves that are important to the analysis.

Principal analysis:

  • The downward correction that began on February 2, wave 3{-7}, continues.
  • It is in the first of five subwaves, wave 1{-8}.
  • Within wave 1{-8}, wave 1{-9} is underway and is in the final subwave within a five-wave structure, downtrending wave 5{-10}.
  • Wave 5{-10}, in turn, is in its middle wave, 3{-11}, which is in its final wave, 5{-12}..
  • The end of wave 5{-12} will also be the end of wave 3{-11}, a subwave of downtrending wave 5{-10}.
  • When wave 5{-10} is complete, it will also mark the end of wave 1{-9} and the beginning of a low-degree upward correction, wave 2{-9}.
  • Within wave 5{-12}, downtrending wave 1{-13} is underway and internally is in wave 4{-14}, an upward correction.
  • Wave 4{-14} is in its final internal wave, C{-15}, which in turn is in its fourth internal wave, D{-16}.
  • Wave C{-15} could be taking the form of a contracting Triangle. [Now outdated.]
  • Wave 4{-14} will be followed by downtrending wave 5{-14}, which will complete its parent, wave 1{-13}
  • Wave 1{-13} and the start of an upward correction, wave 2{-13}.
  • Wave 3{-7} is still taking its tentative first steps and will develop into a powerful downtrend that will carry the price below 3502, the starting point of the preceding upward correction, wave 2{-7}, and most likely significantly below that level.

Alternative analysis [Now outdated.]

  • If wave 4{-14} forms a compound correction, then wave E{-16}, having brought the first corrective pattern to an end, will be followed by wave X{-16}, a connecting wave that will be followed by future wave A{-16}, the first subwave of the second corrective pattern.

Bigger structures:

  • This is all happening within wave 3{-6}, which began on August 16, 2022.
  • Wave 3{-6} is encompassed by a series of larger waves, the smaller within the larger, stretching up five degrees to wave 4{-1}, which began on January 4, 2022.
  • Wave 4{-1} is the next-to-the-last wave within a large expanding Diagonal Triangle, wave 5{0}, that began on December 26, 2018
  • When wave 4{-1} is complete, wave 5{-1} will begin and will carry the wave above the January 4 high, 4808.25, and into the 6000s, where the present upper boundary of the triangle lies. The expanding part means that each day that upper boundary moves higher.

We Are Here.

These are the waves currently in progress under my principal analysis. Each line on the list shows the wave number, with the subscript in curly brackets, the traditional degree name, the starting date, the starting price of the S&P 500 E-mini futures, and the direction of the wave.

  • S&P 500 Index:
  • 5{+3} Supercycle, 7/8/1932, 4.40 (up)
  • 5{+2} Cycle, 12/9/1974, 60.96 (up)
  • 5{+1} Primary, 3/6/2009, 666.79 (up)
  • 5{0} Intermediate, 12/26/2018, 2346.58 (up)
  • S&P 500 Futures and index:
  • 4{-1} Minor, 1/4/2022, 4808.25 (down) (futures), 4818.62 (down) (index)
  • S&P 500 Futures:
  • 1{-2} Minute, 1/4/2022, 4808.25 (down)
  • 1{-3} Minuette, 1/4/2022, 4808.25 (down)
  • 1{-4} Subminuette, 1/4/2022, 4808.25 (down)
  • 1{-5} Micro, 1/4/2022, 4808.25 (down)
  • 3{-6} Submicro, 8/16/2022, 4327.50 (down)
  • 3{-7} Minuscule, 2/2/2023, 4208.50 (down)

Learning and other resources. Elliott wave analysis provides context, not prophecy. As the 20th century semanticist Alfred Korzybski put it in his book Science and Sanity (1933), “The map is not the territory … The only usefulness of a map depends on similarity of structure between the empirical world and the map.” And I would add, in the ever-changing markets, we can judge that similarity of structure only after the fact.

See the menu page Analytical Methods for a rundown on where to go for information on Elliott wave analysis.

By Tim Bovee, Portland, Oregon, March 17, 2023

Disclaimer

Tim Bovee, Private Trader tracks the analysis and trades of a private trader for his own accounts. Nothing in this blog constitutes a recommendation to buy or sell stocks, options or any other financial instrument. The only purpose of this blog is to provide education and entertainment.

No trader is ever 100 percent successful in his or her trades. Trading in the stock and option markets is risky and uncertain. Each trader must make trading decisions for his or her own account, and take responsibility for the consequences.

License
Creative Commons License

All content on Tim Bovee, Private Trader by Timothy K. Bovee is licensed under a Creative Commons Attribution-ShareAlike 4.0 International License.

Based on a work at www.timbovee.com.
Trader’s Notebook

3:30 p.m. New York time

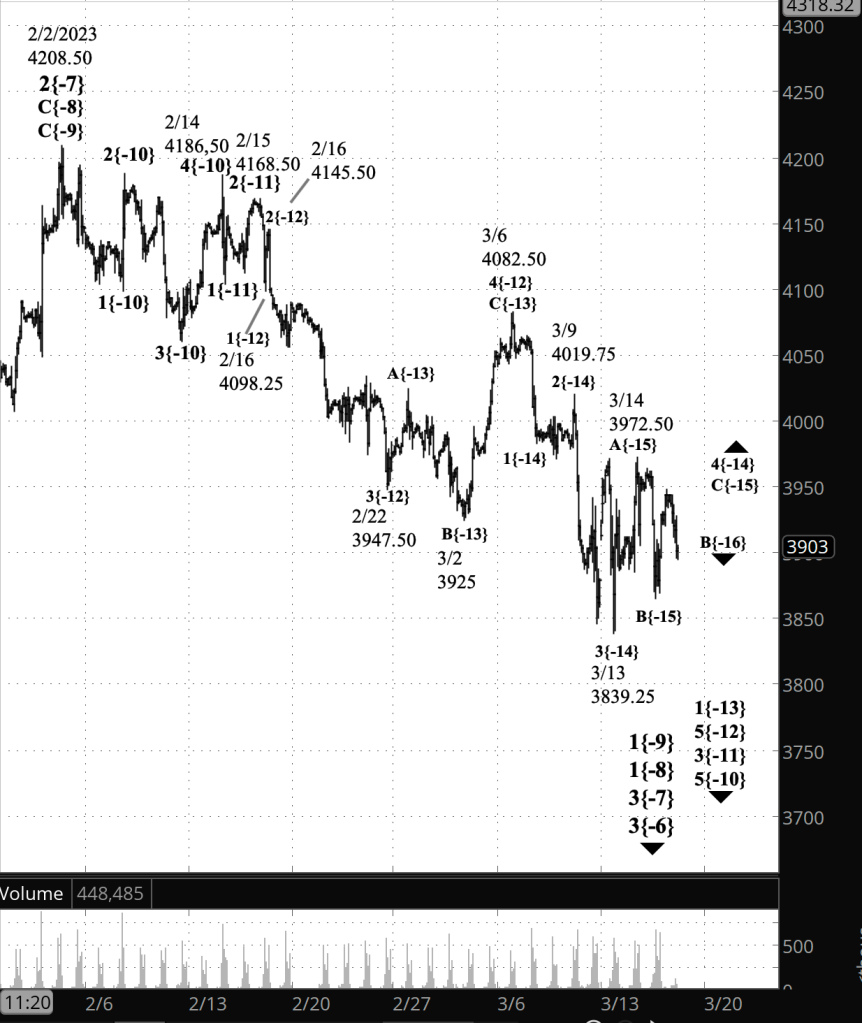
Half an hour before the closing bell. The S&P 500 futures rose during the session, sending the upward correction, wave 4{-14}, breaking above 3982.50, marked as the end of wave 1{-14} on this morning’s chart.

Among the patterns discovered by R.N. Elliott, the developer of Elliott wave analysis, a 4th wave never moves above the end of the preceding 1st wave of the same degree. If it appears to do so, then the chart must be reanalyzed to remove the discrepancy. That is to say, the map no longer matches the territory, and it is the map that must be changed.

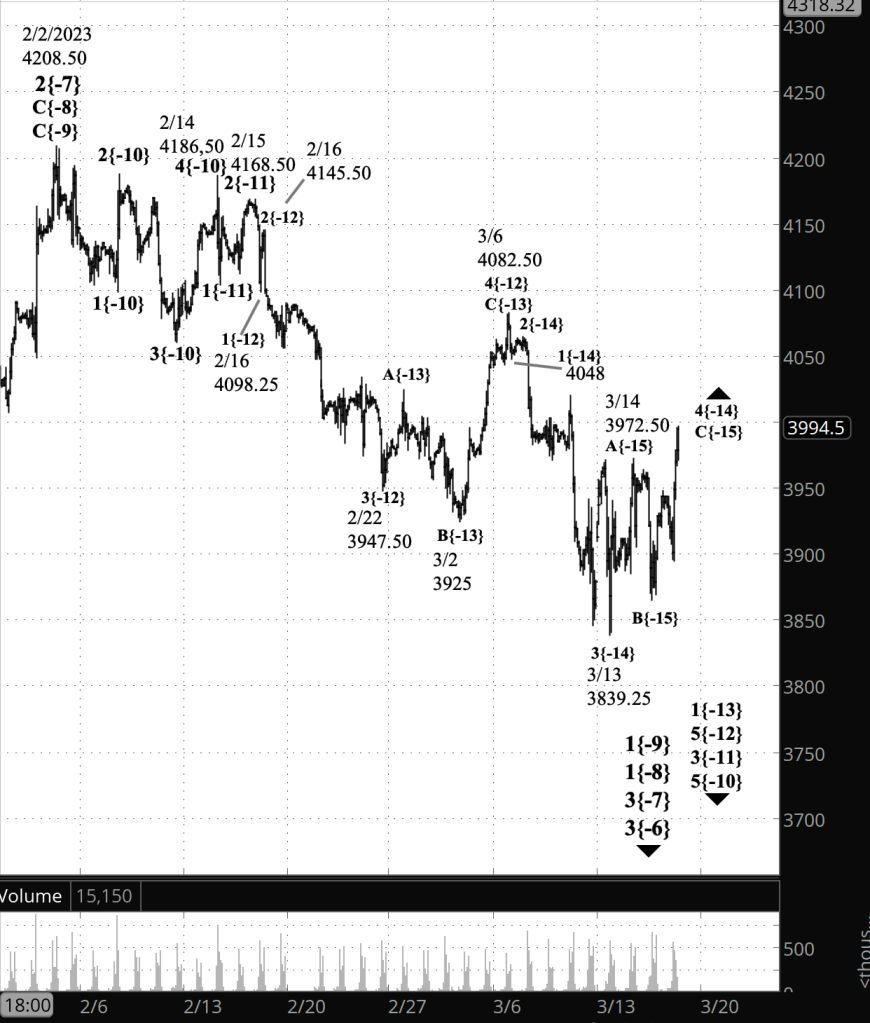
Which I’ve done, in a new chart. The end of wave 1{-14} is now situated at 4048, slightly below the point where the parent wave 1{-13} began. The former location of wave 1{-14}, 3982.50, is now the endpoint of wave 1{-15} within wave 3{-14}. No Elliott wave rules are broken with the new configuration.

Also, the possibility that a subwave of wave 4{-14} is developing into a contracting Triangle, has been knocked from consideration by today’s sharp rise, as has the alternative analysis, that wave 4{-14} ended on March 14.

Here’s the new upper chart showing the revised analysis, and this morning’s now outdated analysis remains on the lower chart.

[S&P 500 E-mini futures at 3:30 p.m., 100-minute bars, with volume]

9:35 a.m. New York time

What’s happening now? The S&P 500 E-mini futures rose overnight to 3947.75 and then retreated to the 3890s.

What does it mean? The rise that began on March 15 continues. It is the last leg of an upward correction. When it is complete, the final segment of the downtrend that began on March 6 will begin. The overnight rise and decline are subwaves within the correction’s final leg. The last leg of the correction could be taking the form of a contracting Triangle, in which each subwave covers a shorter distance than the one that came before.

What are the alternatives? The March 15 peak, 3972. 50, could have been the truncated end of the upward correction, and the decline that has follow, the beginning of the downtrend’s resumption.

Reading the chart. Elliott wave analysis views the chart as a complex structure of smaller waves nested within larger waves, which in turn are nested within still larger waves. My labeling system assigns numbers to the subwaves of trending waves, and letters to the subwaves of corrections. Each number or letter is followed by a subscript, in curly brackets, showing the waves position within the complex structure, called its “degree” in Elliott wave parlance. The smaller the number, the lower the degree. On this chart we’re dealing with relatively small waves, so the degree numbers are negative.

[Outdated analysis: S&P 500 E-mini futures at 9:35 a.m., 100-minute bars, with volume]

What does Elliott wave theory say? In Elliott wave terminology, the principal analysis sees wave C{-15} within wave 4{-14} as being underway — the final wave within the upward correction. Wave C{-15} began on March 15 and wave 4{-14} began on March 13. All are within downtrending wave 1{-13}, which began on March 6.

Here is a rundown of waves that are important to the analysis.

Principal analysis:

  • The downward correction that began on February 2, wave 3{-7}, continues.
  • It is in the first of five subwaves, wave 1{-8}.
  • Within wave 1{-8}, wave 1{-9} is underway and is in the final subwave within a five-wave structure, downtrending wave 5{-10}.
  • Wave 5{-10}, in turn, is in its middle wave, 3{-11}, which is in its final wave, 5{-12}..
  • The end of wave 5{-12} will also be the end of wave 3{-11}, a subwave of downtrending wave 5{-10}.
  • When wave 5{-10} is complete, it will also mark the end of wave 1{-9} and the beginning of a low-degree upward correction, wave 2{-9}.
  • Within wave 5{-12}, downtrending wave 1{-13} is underway and internally is in wave 4{-14}, an upward correction.
  • Wave 4{-14} is in its final internal wave, C{-15}, which in turn is in its second internal wave, B{-16}.
  • Wave C{-15} could be taking the form of a contracting Triangle. [Now outdated.]
  • Wave 4{-14} will be followed by downtrending wave 5{-14}, which will complete its parent, wave 1{-13}
  • Wave 1{-13} and the start of an upward correction, wave 2{-13}.
  • Wave 3{-7} is still taking its tentative first steps and will develop into a powerful downtrend that will carry the price below 3502, the starting point of the preceding upward correction, wave 2{-7}, and most likely significantly below that level.

Alternative analysis [Now outdated.]

  • Wave 4{-14}, an upward correction, ended on March 14 and downtrending wave 5{-15} is underway.

Bigger structures:

  • This is all happening within wave 3{-6}, which began on August 16, 2022.
  • Wave 3{-6} is encompassed by a series of larger waves, the smaller within the larger, stretching up five degrees to wave 4{-1}, which began on January 4, 2022.
  • Wave 4{-1} is the next-to-the-last wave within a large expanding Diagonal Triangle, wave 5{0}, that began on December 26, 2018
  • When wave 4{-1} is complete, wave 5{-1} will begin and will carry the wave above the January 4 high, 4808.25, and into the 6000s, where the present upper boundary of the triangle lies. The expanding part means that each day that upper boundary moves higher.

We Are Here.

These are the waves currently in progress under my principal analysis. Each line on the list shows the wave number, with the subscript in curly brackets, the traditional degree name, the starting date, the starting price of the S&P 500 E-mini futures, and the direction of the wave.

  • S&P 500 Index:
  • 5{+3} Supercycle, 7/8/1932, 4.40 (up)
  • 5{+2} Cycle, 12/9/1974, 60.96 (up)
  • 5{+1} Primary, 3/6/2009, 666.79 (up)
  • 5{0} Intermediate, 12/26/2018, 2346.58 (up)
  • S&P 500 Futures and index:
  • 4{-1} Minor, 1/4/2022, 4808.25 (down) (futures), 4818.62 (down) (index)
  • S&P 500 Futures:
  • 1{-2} Minute, 1/4/2022, 4808.25 (down)
  • 1{-3} Minuette, 1/4/2022, 4808.25 (down)
  • 1{-4} Subminuette, 1/4/2022, 4808.25 (down)
  • 1{-5} Micro, 1/4/2022, 4808.25 (down)
  • 3{-6} Submicro, 8/16/2022, 4327.50 (down)
  • 3{-7} Minuscule, 2/2/2023, 4208.50 (down)

Learning and other resources. Elliott wave analysis provides context, not prophecy. As the 20th century semanticist Alfred Korzybski put it in his book Science and Sanity (1933), “The map is not the territory … The only usefulness of a map depends on similarity of structure between the empirical world and the map.” And I would add, in the ever-changing markets, we can judge that similarity of structure only after the fact.

See the menu page Analytical Methods for a rundown on where to go for information on Elliott wave analysis.

By Tim Bovee, Portland, Oregon, March 16, 2023

Disclaimer

Tim Bovee, Private Trader tracks the analysis and trades of a private trader for his own accounts. Nothing in this blog constitutes a recommendation to buy or sell stocks, options or any other financial instrument. The only purpose of this blog is to provide education and entertainment.

No trader is ever 100 percent successful in his or her trades. Trading in the stock and option markets is risky and uncertain. Each trader must make trading decisions for his or her own account, and take responsibility for the consequences.

License
Creative Commons License

All content on Tim Bovee, Private Trader by Timothy K. Bovee is licensed under a Creative Commons Attribution-ShareAlike 4.0 International License.

Based on a work at www.timbovee.com.
FDX Trade

FedEx Corp. (FDX)

Update 4/2o/2023: I exited my short bear call vertical spread on FDX, one day before expiration, for a $5.05 debit per contract/share, a loss before fees of $266 per contract. Shares were trading at $228.35, up $33.84 from the entry level.

The Implied Volatility Rank at exit was 0.05%, down 52.5 points from the entry level.

I exited on the day before expiration to avoid the hassle of dealing with an expired deep in-the-money position. I never like to lose, realize that losses happen, and it’s not a huge loss. So, forward.

Shares rose by 17.4% over 36 days for a +176% annual rate. The options position produced a -52.6% return for a -534% annual rate.


I have entered a short bear call vertical spread on FDEX, using options that trade for the last time 37 days hence, on April 21. The premium is a $2.39 credit per contract share and the stock at the time of entry was priced at $194.51.

The Implied Volatility Ratio stood at 52.3%.

Premium:$2.39Expire OTM
FDX-bear call spreadStrikeOddsDelta
Calls
Long200.0063.0%42
Break-even197.3959.0%46
Short195.0055.0%50

The premium is 95.6% of the width of the position’s short/long spread. The profit zone covers a 1.5% move to the upside and an unlimited move to the downside.

The risk/reward ratio is 1.1:1, with maximum risk of $261 and maximum reward of $239 per contract.

How I chose the trade. The trade was placed to coincide with FDX’s earnings announcement, after) the closing bell on the day after entry. The short strikes were set to coincide with the expected move of $10.07 either way, based on options pricing, which gives a price range of $184.94 to $204.08. The Zacks Investment Research earnings surprise predictor gave FDX a score of -1.41%, with a rank of 3(hold).

By Tim Bovee, Portland, Oregon, March 15, 2023

Disclaimer

Tim Bovee, Private Trader tracks the analysis and trades of a private trader for his own accounts. Nothing in this blog constitutes a recommendation to buy or sell stocks, options or any other financial instrument. The only purpose of this blog is to provide education and entertainment.

No trader is ever 100 percent successful in his or her trades. Trading in the stock and option markets is risky and uncertain. Each trader must make trading decisions for his or her own account, and take responsibility for the consequences.

License
Creative Commons License

All content on Tim Bovee, Private Trader by Timothy K. Bovee is licensed under a Creative Commons Attribution-ShareAlike 4.0 International License.

Based on a work at www.timbovee.com.

Trader’s Notebook

3:30 p.m. New York time

Half an hour before the closing bell. The S&P 500 futures rose during the session. I’ve changed the principal analysis to show that the final leg of a small upward correction is now underway. The correction, wave 4{-14}, internally is in rising wave C{-15}.

An alternative analysis is that the middle wave of the correction, declining wave B{-15}, is still in progress. Wave B{-15} has completed its requirements, but it could reverse and still be proportional to other waves of like degree. So a continuing wave B{-15} remains on the table, but I think it’s less likely than is the revised principal analysis.

I’ve updated the chart.

2:30 p.m. New York time

FDX earnings play entry. I’ve entered a short bear call spread using options that trade for the last time 37 days hence and have posted an analysis of the trade.

9:35 a.m. New York time

What’s happening now? The S&P 500 E-mini futures declined overnight, reaching into the 3860s at the opening bell.

What does it mean? The falling 2nd leg of a small upward correction is underway and will be followed by the rising final leg of the correction. Thereafter, the downtrend will resume. This is all happening within a downtrend that began on March 6, which itself is a subwave of a series of larger downtrends.

What are the alternatives? None at present. I’m quite certain ambiguities will develop.

Reading the chart. Elliott wave analysis views the chart as a complex structure of smaller waves nested within larger waves, which in turn are nested within still larger waves. My labeling system assigns numbers to the subwaves of trending waves, and letters to the subwaves of corrections. Each number or letter is followed by a subscript, in curly brackets, showing the waves position within the complex structure, called its “degree” in Elliott wave parlance. The smaller the number, the lower the degree. On this chart we’re dealing with relatively small waves, so the degree numbers are negative.

[S&P 500 E-mini futures at 3:30 p.m., 100-minute bars, with volume]

What does Elliott wave theory say? Here’s the line-up of waves important to the analysis.

Principal analysis:

  • The downward correction that began on February 2, wave 3{-7}, continues.
  • It is in the first of five subwaves, wave 1{-8}.
  • Within wave 1{-8}, wave 1{-9} is underway and is in the final subwave within a five-wave structure, downtrending wave 5{-10}.
  • Wave 5{-10}, in turn, is in its middle wave, 3{-11}, which is in its final wave, 5{-12}..
  • The end of wave 5{-12} will also be the end of wave 3{-11}, a subwave of downtrending wave 5{-10}.
  • When wave 5{-10} is complete, it will also mark the end of wave 1{-9} and the beginning of a low-degree upward correction, wave 2{-9}.
  • Within wave 5{-12}, downtrending wave 1{-13} is underway and internally is in wave 4{-14}, an upward correction.
  • Wave 4{-14} is in its middle wave, B{-15}, which will be followed by the correction’s third and final wave, C{-15}.
  • Wave 4{-14} will be followed by downtrending wave 5{-14}, which will complete its parent, wave 1{-13}
  • Wave 1{-13} and the start of an upward correction, wave 2{-13}.
  • Wave 3{-7} is still taking its tentative first steps and will develop into a powerful downtrend that will carry the price below 3502, the starting point of the preceding upward correction, wave 2{-7}, and most likely significantly below that level.

Bigger structures:

  • This is all happening within wave 3{-6}, which began on August 16, 2022.
  • Wave 3{-6} is encompassed by a series of larger waves, the smaller within the larger, stretching up five degrees to wave 4{-1}, which began on January 4, 2022.
  • Wave 4{-1} is the next-to-the-last wave within a large expanding Diagonal Triangle, wave 5{0}, that began on December 26, 2018
  • When wave 4{-1} is complete, wave 5{-1} will begin and will carry the wave above the January 4 high, 4808.25, and into the 6000s, where the present upper boundary of the triangle lies. The expanding part means that each day that upper boundary moves higher.

We Are Here.

These are the waves currently in progress under my principal analysis. Each line on the list shows the wave number, with the subscript in curly brackets, the traditional degree name, the starting date, the starting price of the S&P 500 E-mini futures, and the direction of the wave.

  • S&P 500 Index:
  • 5{+3} Supercycle, 7/8/1932, 4.40 (up)
  • 5{+2} Cycle, 12/9/1974, 60.96 (up)
  • 5{+1} Primary, 3/6/2009, 666.79 (up)
  • 5{0} Intermediate, 12/26/2018, 2346.58 (up)
  • S&P 500 Futures and index:
  • 4{-1} Minor, 1/4/2022, 4808.25 (down) (futures), 4818.62 (down) (index)
  • S&P 500 Futures:
  • 1{-2} Minute, 1/4/2022, 4808.25 (down)
  • 1{-3} Minuette, 1/4/2022, 4808.25 (down)
  • 1{-4} Subminuette, 1/4/2022, 4808.25 (down)
  • 1{-5} Micro, 1/4/2022, 4808.25 (down)
  • 3{-6} Submicro, 8/16/2022, 4327.50 (down)
  • 3{-7} Minuscule, 2/2/2023, 4208.50 (down)

Learning and other resources. Elliott wave analysis provides context, not prophecy. As the 20th century semanticist Alfred Korzybski put it in his book Science and Sanity (1933), “The map is not the territory … The only usefulness of a map depends on similarity of structure between the empirical world and the map.” And I would add, in the ever-changing markets, we can judge that similarity of structure only after the fact.

See the menu page Analytical Methods for a rundown on where to go for information on Elliott wave analysis.

By Tim Bovee, Portland, Oregon, March 15, 2023

Disclaimer

Tim Bovee, Private Trader tracks the analysis and trades of a private trader for his own accounts. Nothing in this blog constitutes a recommendation to buy or sell stocks, options or any other financial instrument. The only purpose of this blog is to provide education and entertainment.

No trader is ever 100 percent successful in his or her trades. Trading in the stock and option markets is risky and uncertain. Each trader must make trading decisions for his or her own account, and take responsibility for the consequences.

License
Creative Commons License

All content on Tim Bovee, Private Trader by Timothy K. Bovee is licensed under a Creative Commons Attribution-ShareAlike 4.0 International License.

Based on a work at www.timbovee.com.

Trader’s Notebook

3:30 p.m. New York time

Half an hour before the closing bell. The S&P 500 futures, in an upward correction, moved above the March 12 high, and I’ve done a recount that better matches the chart as it has developed. It also takes care of the risks identified in the alternative analysis, which cast doubt on the relative size of the waves as labeled.

I’ve retained this morning’s chart. The chart higher up in the page is this afternoon’s reanalysis.

Here are the changes. I’ve taken {-15} degree waves and moved them up to {-14}. Having done so, then wave 3{-14} ended on March 13 at 3839.25. The rise that followed is an upward correction, wave 4{-14}. Internally, it is in falling wave B{-15} the second of three waves.

There is no change in the higher degrees. What I’ve described above are subwaves of wave 1{-13}, which in in turn a subwave of wave 5{-12}, which began on March 6.

The revised chart:

[S&P 500 E-mini futures at 3:30 p.m., 100-minute bars, with volume]

9:35 a.m. New York time

What’s happening now? The S&P 500 E-mini futures swung wildly after new inflation figures were announced, rapidly moving between the 3880s and the 3930s before settling down about where the price had been prior to the data release. Prices rose at the opening bell.

What does it mean? The downtrend that began on March 6 continues and in its subwaves is also in a downtrend. At a very low degree, the price is in an upward correction. A rise above 3971.50 would require a recount.

What are the alternatives? The placement of the waves within the March 6 downtrend, relative to the parent wave, remains uncertain. They could be one level higher in size relative to the downtrend.

[Outdated analysis: S&P 500 E-mini futures at 9:35 a.m., 100-minute bars, with volume]

What does Elliott wave theory say? Note: This is section was based on this morning’s analysis, which has been updated. See the “Half an hour before the closing bell” section, above, for the new analysis. I’ll update this section for the March 15 Trader’s Notebook.

Here are the Elliott waves that form the basis of my analysis, unchanged from yesterday.

Principal analysis:

  • The downward correction that began on February 2, wave 3{-7}, continues.
  • It is in the first of five subwaves, wave 1{-8}.
  • Within wave 1{-8}, wave 1{-9} is underway and is in the final subwave within a five-wave structure, downtrending wave 5{-10}.
  • Wave 5{-10}, in turn, is in its middle wave, 3{-11}, which is in its final wave, 5{-12}..
  • The end of wave 5{-12} will also be the end of wave 3{-11}, a subwave of downtrending wave 5{-10}.
  • When wave 5{-10} is complete, it will also mark the end of wave 1{-9} and the beginning of a low-degree upward correction, wave 2{-9}.
  • Within wave 5{-12}, downtrending wave 1{-13} is underway and internally is in wave 5{-14}, its final wave.
  • Wave 5{-14} is in its middle wave, 3{-15}.
  • Wave 3{-15} internally is in an upward correction, wave 2{-16}. If that 2nd wave correction moves beyond the starting point of the preceding downtrending wave 1{-16}, then it will have violated a rule of Elliott wave analysis, and a recount will be necessary. Wave 1{-16} started at 3971.50.
  • Wave 3{-13} will be followed by an upward correction, wave 4{-15}, and then a final downtrending wave 5{-15}
  • When complete, wave 5{-15} will complete wave 5{-14}, which will mark the end of wave 1{-13} and the start of an upward correction, wave 2{-13}.
  • On the chart I’ve posited the current price at wave 5{-14} within wave 1{-13}, which in turn is the first wave within wave 5{-12}.
  • Wave 3{-7} is still taking its tentative first steps and will develop into a powerful downtrend that will carry the price below 3502, the starting point of the preceding upward correction, wave 2{-7}, and most likely significantly below that level.

Alternative analysis:

  • Within wave 5{-12} the subwave degrees are uncertain.
  • The {-13} degrees could be a degree higher, making them waves of {-13} degree within wave 5{-12}.

Bigger structures:

  • This is all happening within wave 3{-6}, which began on August 16, 2022.
  • Wave 3{-6} is encompassed by a series of larger waves, the smaller within the larger, stretching up five degrees to wave 4{-1}, which began on January 4, 2022.
  • Wave 4{-1} is the next-to-the-last wave within a large expanding Diagonal Triangle, wave 5{0}, that began on December 26, 2018
  • When wave 4{-1} is complete, wave 5{-1} will begin and will carry the wave above the January 4 high, 4808.25, and into the 6000s, where the present upper boundary of the triangle lies. The expanding part means that each day that upper boundary moves higher.

We Are Here.

These are the waves currently in progress under my principal analysis. Each line on the list shows the wave number, with the subscript in curly brackets, the traditional degree name, the starting date, the starting price of the S&P 500 E-mini futures, and the direction of the wave.

  • S&P 500 Index:
  • 5{+3} Supercycle, 7/8/1932, 4.40 (up)
  • 5{+2} Cycle, 12/9/1974, 60.96 (up)
  • 5{+1} Primary, 3/6/2009, 666.79 (up)
  • 5{0} Intermediate, 12/26/2018, 2346.58 (up)
  • S&P 500 Futures and index:
  • 4{-1} Minor, 1/4/2022, 4808.25 (down) (futures), 4818.62 (down) (index)
  • S&P 500 Futures:
  • 1{-2} Minute, 1/4/2022, 4808.25 (down)
  • 1{-3} Minuette, 1/4/2022, 4808.25 (down)
  • 1{-4} Subminuette, 1/4/2022, 4808.25 (down)
  • 1{-5} Micro, 1/4/2022, 4808.25 (down)
  • 3{-6} Submicro, 8/16/2022, 4327.50 (down)
  • 3{-7} Minuscule, 2/2/2023, 4208.50 (down)

Learning and other resources. Elliott wave analysis provides context, not prophecy. As the 20th century semanticist Alfred Korzybski put it in his book Science and Sanity (1933), “The map is not the territory … The only usefulness of a map depends on similarity of structure between the empirical world and the map.” And I would add, in the ever-changing markets, we can judge that similarity of structure only after the fact.

See the menu page Analytical Methods for a rundown on where to go for information on Elliott wave analysis.

By Tim Bovee, Portland, Oregon, March 14, 2023

Disclaimer

Tim Bovee, Private Trader tracks the analysis and trades of a private trader for his own accounts. Nothing in this blog constitutes a recommendation to buy or sell stocks, options or any other financial instrument. The only purpose of this blog is to provide education and entertainment.

No trader is ever 100 percent successful in his or her trades. Trading in the stock and option markets is risky and uncertain. Each trader must make trading decisions for his or her own account, and take responsibility for the consequences.

License
Creative Commons License

All content on Tim Bovee, Private Trader by Timothy K. Bovee is licensed under a Creative Commons Attribution-ShareAlike 4.0 International License.

Based on a work at www.timbovee.com.

Trader’s Notebook

3:30 p.m. New York time

Half an hour before the closing bell. The S&P 500 futures rose during the session, reaching into the 3940s. The overnight low was 3839.25. No change from this morning’s analysis. The downtrend that began on March 9 continues. I’ve updated the chart.

9:35 a.m. New York time

What’s happening now? The S&P 500 E-mini futures declined after trading resumed overnight, reaching into the 3830s so far.

What does it mean? The downtrend that began on March 6 continues and is in its middle segment — the 3rd of 5 waves — typically the most energetic of the set.

What are the alternatives? The placement of the waves within the downtrend remain uncertain. They could be one level higher in size relative to the downtrend.

Reading the chart. Elliott wave analysis views the chart as a complex structure of smaller waves nested within larger waves, which in turn are nested within still larger waves. My labeling system assigns numbers to the subwaves of trending waves, and letters to the subwaves of corrections. Each number or letter is followed by a subscript, in curly brackets, showing the waves position within the complex structure, called its “degree” in Elliott wave parlance. The smaller the number, the lower the degree. On this chart we’re dealing with relatively small waves, so the degree numbers are negative.

[S&P 500 E-mini futures at 3:30 p.m., 100-minute bars, with volume]

What does Elliott wave theory say? Here are the Elliott waves that form the basis of my analysis.

Principal analysis:

  • The downward correction that began on February 2, wave 3{-7}, continues.
  • It is in the first of five subwaves, wave 1{-8}.
  • Within wave 1{-8}, wave 1{-9} is underway and is in the final subwave within a five-wave structure, downtrending wave 5{-10}.
  • Wave 5{-10}, in turn, is in its middle wave, 3{-11}, which is in its final wave, 5{-12}..
  • The end of wave 5{-12} will also be the end of wave 3{-11}, a subwave of downtrending wave 5{-10}.
  • When wave 5{-10} is complete, it will also mark the end of wave 1{-9} and the beginning of a low-degree upward correction, wave 2{-9}.
  • Within wave 5{-12}, downtrending wave 1{-13} is underway and internally is in wave 5{-14}, its final wave.
  • Wave 5{-14} is in its middle wave, 3{-15}.
  • Wave 3{-13} will be followed by an upward correction, wave 4{-15}, and then a final downtrending wave 5{-15}
  • When complete, wave 5{-15} will complete wave 5{-14}, which will mark the end of wave 1{-13} and the start of an upward correction, wave 2{-13}.
  • On the chart I’ve posited the current price at wave 5{-14} within wave 1{-13}, which in turn is the first wave within wave 5{-12}.
  • Wave 3{-7} is still taking its tentative first steps and will develop into a powerful downtrend that will carry the price below 3502, the starting point of the preceding upward correction, wave 2{-7}, and most likely significantly below that level.

Alternative analysis:

  • Within wave 5{-12} the subwave degrees are uncertain.
  • The {-13} degrees could be a degree higher, making them waves of {-13} degree within wave 5{-12}.

Bigger structures:

  • This is all happening within wave 3{-6}, which began on August 16, 2022.
  • Wave 3{-6} is encompassed by a series of larger waves, the smaller within the larger, stretching up five degrees to wave 4{-1}, which began on January 4, 2022.
  • Wave 4{-1} is the next-to-the-last wave within a large expanding Diagonal Triangle, wave 5{0}, that began on December 26, 2018
  • When wave 4{-1} is complete, wave 5{-1} will begin and will carry the wave above the January 4 high, 4808.25, and into the 6000s, where the present upper boundary of the triangle lies. The expanding part means that each day that upper boundary moves higher.

We Are Here.

These are the waves currently in progress under my principal analysis. Each line on the list shows the wave number, with the subscript in curly brackets, the traditional degree name, the starting date, the starting price of the S&P 500 E-mini futures, and the direction of the wave.

  • S&P 500 Index:
  • 5{+3} Supercycle, 7/8/1932, 4.40 (up)
  • 5{+2} Cycle, 12/9/1974, 60.96 (up)
  • 5{+1} Primary, 3/6/2009, 666.79 (up)
  • 5{0} Intermediate, 12/26/2018, 2346.58 (up)
  • S&P 500 Futures and index:
  • 4{-1} Minor, 1/4/2022, 4808.25 (down) (futures), 4818.62 (down) (index)
  • S&P 500 Futures:
  • 1{-2} Minute, 1/4/2022, 4808.25 (down)
  • 1{-3} Minuette, 1/4/2022, 4808.25 (down)
  • 1{-4} Subminuette, 1/4/2022, 4808.25 (down)
  • 1{-5} Micro, 1/4/2022, 4808.25 (down)
  • 3{-6} Submicro, 8/16/2022, 4327.50 (down)
  • 3{-7} Minuscule, 2/2/2023, 4208.50 (down)

Learning and other resources. Elliott wave analysis provides context, not prophecy. As the 20th century semanticist Alfred Korzybski put it in his book Science and Sanity (1933), “The map is not the territory … The only usefulness of a map depends on similarity of structure between the empirical world and the map.” And I would add, in the ever-changing markets, we can judge that similarity of structure only after the fact.

See the menu page Analytical Methods for a rundown on where to go for information on Elliott wave analysis.

By Tim Bovee, Portland, Oregon, March 13, 2023

Disclaimer

Tim Bovee, Private Trader tracks the analysis and trades of a private trader for his own accounts. Nothing in this blog constitutes a recommendation to buy or sell stocks, options or any other financial instrument. The only purpose of this blog is to provide education and entertainment.

No trader is ever 100 percent successful in his or her trades. Trading in the stock and option markets is risky and uncertain. Each trader must make trading decisions for his or her own account, and take responsibility for the consequences.

License
Creative Commons License

All content on Tim Bovee, Private Trader by Timothy K. Bovee is licensed under a Creative Commons Attribution-ShareAlike 4.0 International License.

Based on a work at www.timbovee.com.

Trader’s Notebook

3:30 p.m. New York time

Half an hour before the closing bell. The S&P 500 futures moved below the overnight low, confirming that downtrend that began on March 6 is continuing. In Elliott wave terminology, the downtrend is wave 5{-12}. Internally, it is in its initial wave, 1{-13}, and that initial wave is in its final segment, wave 5{-14}. That final segment has a ways to go. Its downtrending middle segment, wave 3{-15}, began from today’s high, 3941.75 and so far has reached in to the 3840s.

This morning’s principal analysis is unchanged. I’ve updated the upper, short-term, chart.

9:35 a.m. New York time

What’s happening now? The S&P 500 E-mini futures fell to an overnight low of 3884.25 and then rose slightly. As the opening bell approached, new employment figures showed an unexpectedly high growth, and the futures responded by fluctuating rapidly between the 3890s and the 3940s within the span of a few minutes before settling back in the 3930s.

What does it mean? Two possibilities of almost equal likelihood. As the principal analysis, I see the downtrend that began on March 9 continuing, with the rise overnight being an upward correction within that downtrend. Here’s my reasoning: The downtrend until the overnight low has had no countertrend waves sufficient to count as a correction, so the rise from the low must be the 2nd degree within the downtrend, and if the downtrend ended at the overnight low, it would have begun and ended on the same day, a timespan a bit short for a 5th wave of this degree, in my opinion.

What are the alternatives? Nonetheless, it’s possible that the downtrend that began on March 9 ended at the overnight low, and the upward movement is the starting point of a larger upward movement, within the downtrend that began on March 6.

If the price reverses soon and drops below 3884.25, that will confirm the principal scenario. If the price continues to rise in five subwaves, followed by two more waves while remaining above 3884.25, that will increase the likelihood of the alternative scenario.

Another big uncertainty at this point is where the smaller waves fit in the large waves.

In any case… It’s important, I think, to keep the bigger picture in mind. All of this is happening within a larger downtrend, a 3rd wave, which began on February 2 from 4208.50. The preceding 1st wave ended October 10 at 3502. That larger downtrend can be expected to carry that price below that level, most likely by a considerable distance.

Ultimately, the smaller movements that are the part of our daily tracking are of little importance compared to the downtrending power of the wave that began on February 2. I normally don’t use Elliott wave nomenclature in this section of my analysis, but for clarity, I’ll make an exception. That powerful downtrend is wave 3{-7} on the chart, what the developer of Elliott Wave Analysis, R.N. Elliott, would have called wave 3 of Minuscule degree. Minuscule, maybe, but of huge importance for investors wanting to avoid the price losses that lie ahead.

Reading the chart. Elliott wave analysis views the chart as a complex structure of smaller waves nested within larger waves, which in turn are nested within still larger waves. My labeling system assigns numbers to the subwaves of trending waves, and letters to the subwaves of corrections. Each number or letter is followed by a subscript, in curly brackets, showing the waves position within the complex structure, called its “degree” in Elliott wave parlance. The smaller the number, the lower the degree. On this chart we’re dealing with relatively small waves, so the degree numbers are negative.

The upper chart, of the S&P 500 futures, shows the peak of the downtrend that began on February 2 and all that has happened since.

The lower chart, of the S&P 500 index, shows the early pandemic crash of February 2020 and all that has happened since. The red lines are the upper and lower boundaries of an expanding Diagonal Triangle that began on December 26, 2018.

[S&P 500 E-mini futures at 3:30 p.m., 80-minute bars, with volume]

[S&P 500 index at 9:35 a.m., 2-day bars]

What does Elliott wave theory say? These are the Elliott waves that underly the analysis.

Principal analysis:

  • The downward correction that began on February 2, wave 3{-7}, continues.
  • It is in the first of five subwaves, wave 1{-8}.
  • Within wave 1{-8}, wave 1{-9} is underway and is in the final subwave within a five-wave structure, downtrending wave 5{-10}.
  • Wave 5{-10}, in turn, is in its middle wave, 3{-11}, which is in its final wave, 5{-12}..
  • The end of wave 5{-12} will also be the end of wave 3{-11}, a subwave of downtrending wave 5{-10}.
  • When wave 5{-10} is complete, it will also mark the end of wave 1{-9} and the beginning of a low-degree upward correction, wave 2{-9}.
  • Within wave 5{-12}, downtrending wave 1{-13} is underway and internally is in wave 5{-14}, its final wave.
  • When complete, wave 5{-14} will mark the end of wave 1{-13} and the start of an upward correction, wave 2{-13}.
  • Within wave 5{-12} the subwave degrees are uncertain.
  • On the chart I’ve posited the current price at wave 5{-14} within wave 1{-13}, which in turn is the first wave within wave 5{-12}.
  • However, the {-14} degree could possibly to turn out to be at the {-13} degree. The context created by the passage of time will clarify the degrees.
  • Wave 3{-7} is still taking its tentative first steps and will develop into a powerful downtrend that will carry the price below 3502, the starting point of the preceding upward correction, wave 2{-7}, and most likely significantly below that level.

Alternative analysis:

  • Wave 5{-14} ended on March 9, the same day it began, also bringing wave 1{-13} to a conclusion.
  • An upward correction, wave 2{-13}, is now underway.
  • Wave 2{-13} will have three subwaves. The first subwave, wave A{-14}, will most likely contain five waves within it, making the correction a Zigzag, the most common corrective pattern for 2nd waves.

Bigger structures:

  • This is all happening within wave 3{-6}, which began on August 16, 2022.
  • Wave 3{-6} is encompassed by a series of larger waves, the smaller within the larger, stretching up five degrees to wave 4{-1}, which began on January 4, 2022.
  • Wave 4{-1} is the next-to-the-last wave within a large expanding Diagonal Triangle, wave 5{0}, that began on December 26, 2018
  • When wave 4{-1} is complete, wave 5{-1} will begin and will carry the wave above the January 4 high, 4808.25, and into the 6000s, where the present upper boundary of the triangle lies. The expanding part means that each day that upper boundary moves higher.

We Are Here.

These are the waves currently in progress under my principal analysis. Each line on the list shows the wave number, with the subscript in curly brackets, the traditional degree name, the starting date, the starting price of the S&P 500 E-mini futures, and the direction of the wave.

  • S&P 500 Index:
  • 5{+3} Supercycle, 7/8/1932, 4.40 (up)
  • 5{+2} Cycle, 12/9/1974, 60.96 (up)
  • 5{+1} Primary, 3/6/2009, 666.79 (up)
  • 5{0} Intermediate, 12/26/2018, 2346.58 (up)
  • S&P 500 Futures and index:
  • 4{-1} Minor, 1/4/2022, 4808.25 (down) (futures), 4818.62 (down) (index)
  • S&P 500 Futures:
  • 1{-2} Minute, 1/4/2022, 4808.25 (down)
  • 1{-3} Minuette, 1/4/2022, 4808.25 (down)
  • 1{-4} Subminuette, 1/4/2022, 4808.25 (down)
  • 1{-5} Micro, 1/4/2022, 4808.25 (down)
  • 3{-6} Submicro, 8/16/2022, 4327.50 (down)
  • 3{-7} Minuscule, 2/2/2023, 4208.50 (down)

Learning and other resources. Elliott wave analysis provides context, not prophecy. As the 20th century semanticist Alfred Korzybski put it in his book Science and Sanity (1933), “The map is not the territory … The only usefulness of a map depends on similarity of structure between the empirical world and the map.” And I would add, in the ever-changing markets, we can judge that similarity of structure only after the fact.

See the menu page Analytical Methods for a rundown on where to go for information on Elliott wave analysis.

By Tim Bovee, Portland, Oregon, March 10, 2023

Disclaimer

Tim Bovee, Private Trader tracks the analysis and trades of a private trader for his own accounts. Nothing in this blog constitutes a recommendation to buy or sell stocks, options or any other financial instrument. The only purpose of this blog is to provide education and entertainment.

No trader is ever 100 percent successful in his or her trades. Trading in the stock and option markets is risky and uncertain. Each trader must make trading decisions for his or her own account, and take responsibility for the consequences.

License
Creative Commons License

All content on Tim Bovee, Private Trader by Timothy K. Bovee is licensed under a Creative Commons Attribution-ShareAlike 4.0 International License.

Based on a work at www.timbovee.com.
Trader’s Notebook

3:30 p.m. New York time

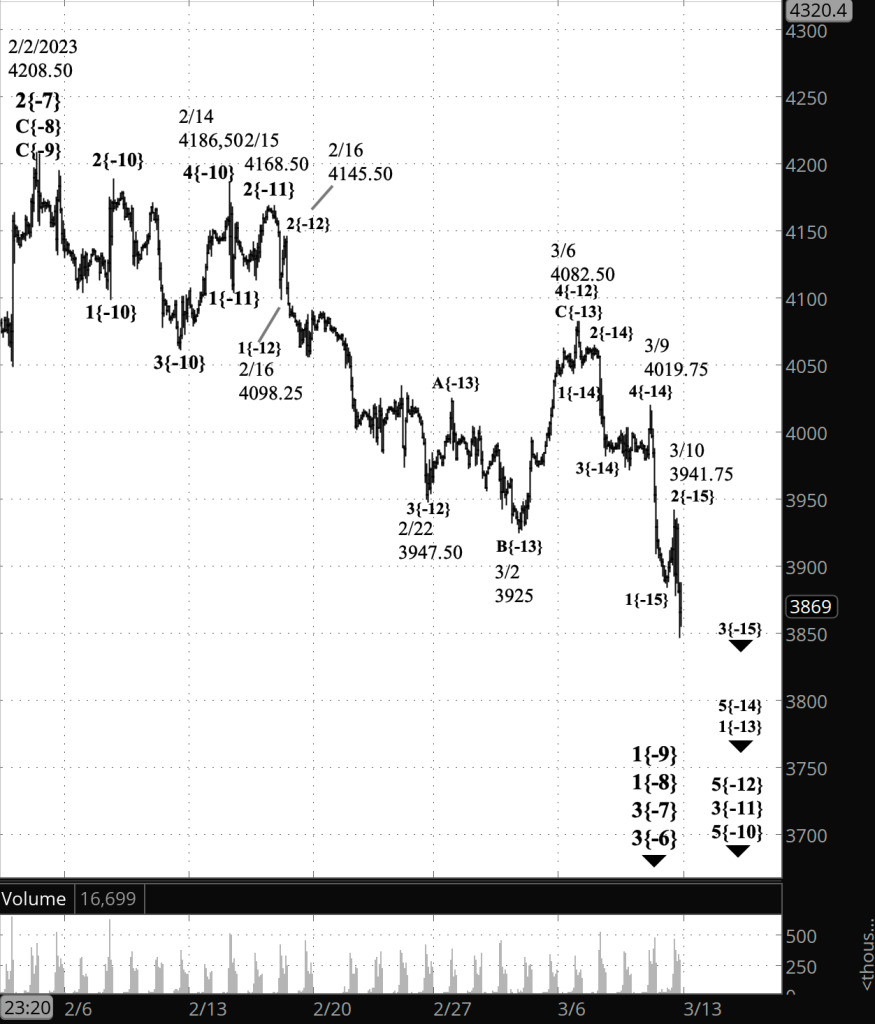
Half an hour before the closing bell. The S&P 500 futures peaked in the first half hour of trading and then continued with a resumption of the decline that began on March 6, reaching a low so far of 3909.50. The price broke below the starting point of the preceding upward correction, 3947.50 on February 22, confirming that the downtrend began on March 6.

The downtrend that began on March 6 is wave 5{-12} and the upward correction that preceded it and ended on March 6 was wave 4{-12}.

Since the decline began, the price has has completed four waves and now is in the 5th and final wave of a downtrend within the larger downtrend.

In Elliott wave terms, downtrending wave 5{-12} has been underway since March 6. It is impossible in the early stages of wave to know with certainty what degree the subwaves are. My best guess is that the entire decline since March 6 has been wave 1{-13}, and the four completed waves within wave 1{-13} are one degree further down, waves 1{-14} through 4{-14}. Using this model, downtrending wave 5{-14} is now underway within wave 1{-13} within wave 5{-12} is now underway. But the degrees could change as the pattern develops.

As I noted this morning, wave 5{-12} will most likely move significantly below 3947.50.

I’ve updated the chart.

This morning’s alternative analysis is no longer valid. It raised the possibility that the upward correction, wave 4{-12}, is still underway and is forming a compound structure.

9:35 a.m. New York time

What’s happening now? The S&P 500 E-mini futures traded in the 3980s and 3990s until the jobless claims report showed a greater than expected rise. The futures quickly rose above 4000, a small move but a contrast to the flatness the price overnight.

What does it mean? The analysis remains unchanged from yesterday. The downtrend that began on March 6 continues and is in his early stages. Typically, a wave in this position will move below the starting point of the preceding correction. In this case, the upward correction began on February 22 from 3947.50. The move could be a good distance below that level.

What are the alternatives? It’s possible that the upward correction that began on February 22 is still underway and is forming a compound structure, which will link two or three corrective patterns together. Under this scenario, the first corrective pattern ended on March 6, and the present decline will connect the completed first pattern with a future second corrective pattern.

Reading the chart. Elliott wave analysis views the chart as a complex structure of smaller waves nested within larger waves, which in turn are nested within still larger waves. My labeling system assigns numbers to the subwaves of trending waves, and letters to the subwaves of corrections. Each number or letter is followed by a subscript, in curly brackets, showing the waves position within the complex structure, called its “degree” in Elliott wave parlance. The smaller the number, the lower the degree. On this chart we’re dealing with relatively small waves, so the degree numbers are negative.

[S&P 500 E-mini futures at 3:30 p.m., 80-minute bars, with volume]

What does Elliott wave theory say? A discussion of the waves of interest using the wave numbers and degree subscripts.

Principal analysis:

  • The downward correction that began on February 2, wave 3{-7}, continues.
  • It is in the first of five subwaves, wave 1{-8}.
  • Within wave 1{-8}, wave 1{-9} is underway and is in the final subwave within a five-wave structure, downtrending wave 5{-10}.
  • Wave 5{-10}, in turn, is in its middle wave, 3{-11}.
  • Wave 3{-11}’s middle wave, wave 3{-12}, ended on February 22, and the next-to-the-last wave, an upward correction, wave 4{-12}, is now underway.
  • Internally, wave 4{-12} is in its final wave of three, wave C{-13}.
  • Wave C{-13} will have five waves internally, appears to have just completed wave C{-14} and may have completed wave D{-14} and to have launched its final wave, E{-14}, which will complete the parent wave, C{-13}.
  • The end of wave C{-13} will be the end of the correction, wave 4{-12}, which will be followed by wave 5{-12}, which will mark the end of wave 3{-11}, a subwave of downtrending wave 5{-10}.
  • The end of wave 5{-12} will also be the end of wave 3{-11}, a subwave of downtrending wave 5{-10}.
  • When wave 5{-10} is complete, it will also mark the end of wave 1{-9} and the beginning of a low-degree upward correction, wave 2{-9}.
  • Wave 3{-7} is still taking its tentative first steps and will develop into a powerful downtrend that will carry the price below 3502, the starting point of the preceding upward correction, wave 2{-7}, and most likely significantly below that level.

Alternative analysis:

  • Wave 4{-12}, an upward correction that began on February 22, is still underway and is forming a compound structure, linking two or three corrective patterns together..
  • A falling wave connecting the now complete first corrective pattern — waves A{-13}, B{-13} and C{-13} — with a future second corrective pattern is now underway and is designated wave X{-13}.

Bigger structures:

  • This is all happening within wave 3{-6}, which began on August 16, 2022.
  • Wave 3{-6} is encompassed by a series of larger waves, the smaller within the larger, stretching up five degrees to wave 4{-1}, which began on January 4, 2022.
  • Wave 4{-1} is the next-to-the-last wave within a large expanding Diagonal Triangle, wave 5{0}, that began on December 26, 2018
  • When wave 4{-1} is complete, wave 5{-1} will begin and will carry the wave above the January 4 high, 4808.25, and into the 6000s, where the present upper boundary of the triangle lies. The expanding part means that each day that upper boundary moves higher.

We Are Here.

These are the waves currently in progress under my principal analysis. Each line on the list shows the wave number, with the subscript in curly brackets, the traditional degree name, the starting date, the starting price of the S&P 500 E-mini futures, and the direction of the wave.

  • S&P 500 Index:
  • 5{+3} Supercycle, 7/8/1932, 4.40 (up)
  • 5{+2} Cycle, 12/9/1974, 60.96 (up)
  • 5{+1} Primary, 3/6/2009, 666.79 (up)
  • 5{0} Intermediate, 12/26/2018, 2346.58 (up)
  • S&P 500 Futures and index:
  • 4{-1} Minor, 1/4/2022, 4808.25 (down) (futures), 4818.62 (down) (index)
  • S&P 500 Futures:
  • 1{-2} Minute, 1/4/2022, 4808.25 (down)
  • 1{-3} Minuette, 1/4/2022, 4808.25 (down)
  • 1{-4} Subminuette, 1/4/2022, 4808.25 (down)
  • 1{-5} Micro, 1/4/2022, 4808.25 (down)
  • 3{-6} Submicro, 8/16/2022, 4327.50 (down)
  • 3{-7} Minuscule, 2/2/2023, 4208.50 (down)

Learning and other resources. Elliott wave analysis provides context, not prophecy. As the 20th century semanticist Alfred Korzybski put it in his book Science and Sanity (1933), “The map is not the territory … The only usefulness of a map depends on similarity of structure between the empirical world and the map.” And I would add, in the ever-changing markets, we can judge that similarity of structure only after the fact.

See the menu page Analytical Methods for a rundown on where to go for information on Elliott wave analysis.

By Tim Bovee, Portland, Oregon, March 9, 2023

Disclaimer

Tim Bovee, Private Trader tracks the analysis and trades of a private trader for his own accounts. Nothing in this blog constitutes a recommendation to buy or sell stocks, options or any other financial instrument. The only purpose of this blog is to provide education and entertainment.

No trader is ever 100 percent successful in his or her trades. Trading in the stock and option markets is risky and uncertain. Each trader must make trading decisions for his or her own account, and take responsibility for the consequences.

License
Creative Commons License

All content on Tim Bovee, Private Trader by Timothy K. Bovee is licensed under a Creative Commons Attribution-ShareAlike 4.0 International License.

Based on a work at www.timbovee.com.