MKC Trade

McCormick & Co. Inc. (MKC)

Update 4/6/2023: I exited my short bear call vertical spread on April 6, 15 days before expiration, after the short calls were exercised. The options and short shares combined produced for a $85.67 debit per contract/share, a loss before fees of $382 per contract. The loss is within the defined maximum risk at entry. Shares were trading at $85.25, up $12.84 from the entry level.

The Implied Volatility Rank at exit was 6%, down 33.7 points from the entry level.

The position became unprofitable almost immediately. In such cases, I hold the losing position as I wait for time decay to do its work, bringing the loss down to maximum at expiration from the higher, pre-expiration loss. In such cases, there’s always a risk that the buyer of the short options will exercise them. And so it was in this case. The exercise was triggered by the stock going ex-dividend.

Shares rose by 17.7% over 29 days for a +223% annual rate. The options position produced a 4.5% loss for a -26% annual rate.


I have entered a short bear call vertical spread on MKC, using options that trade for the last time 44 days hence, on April 21. The premium is a $1.03 credit per contract share and the stock at the time of entry was priced at $72.41.

The Implied Volatility Ratio stood at 39.7%.

Premium:$1.03Expire OTM
MKC-bear call spreadStrikeOddsDelta
Calls
Long80.0087.0%15
Break-even76.0375.5%27
Short75.0064.0%39

The premium is 41.2% of the width of the position’s short/long spread. The profit zone covers a 5% move to the upside and an unlimited move to the downside.

The risk/reward ratio is 3.9:1, with maximum risk of $397 and maximum reward of $103 per contract.

How I chose the trade. The trade was placed to coincide with a general downtrend in the market. The chart metrics on MKC were entirely negative at the time of entry, and Zacks Investment Research earnings surprise predictor gave MKC a rank of 5 (strong sell). My goal is to sell either at 50% of potential profit or greater — $0.52 or more — or 21 days before expiration, on March 25, whichever comes first.

By Tim Bovee, Portland, Oregon, March 8, 2023

Disclaimer

Tim Bovee, Private Trader tracks the analysis and trades of a private trader for his own accounts. Nothing in this blog constitutes a recommendation to buy or sell stocks, options or any other financial instrument. The only purpose of this blog is to provide education and entertainment.

No trader is ever 100 percent successful in his or her trades. Trading in the stock and option markets is risky and uncertain. Each trader must make trading decisions for his or her own account, and take responsibility for the consequences.

License
Creative Commons License

All content on Tim Bovee, Private Trader by Timothy K. Bovee is licensed under a Creative Commons Attribution-ShareAlike 4.0 International License.

Based on a work at www.timbovee.com.
Trader’s Notebook

3:30 p.m. New York time

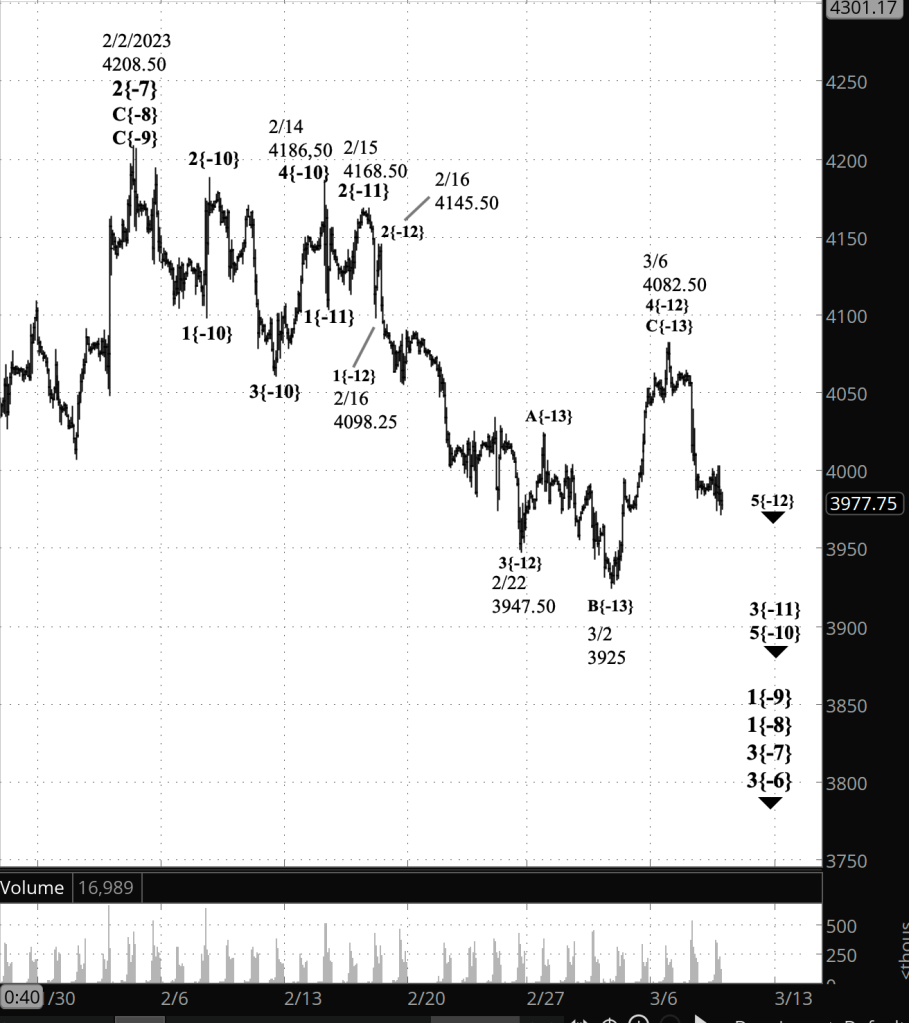
Half an hour before the closing bell. A bit of a yawner today, with the S&P 50 futures declining only slightly, into the 3970s. This despite Fed Chair Jerome Powell’s second day of testimony before congressional committees, this time in the House. No change in the analysis. I’ve updated the chart.

1:15 p.m. New York time

MKC options bear spread entry. I’ve entered a short bear call vertical spread on MKC, using options that expire 44 days hence, and have posted an analysis of the trade.

9:35 a.m. New York time

What’s happening now? The S&P 500 E-mini futures moved sideways overnight, remaining in the 3980s and 3990s with a brief push above 4000 that quickly retreated.

What does it mean? The pause was a small correction within a larger downtrend that began on March 6. The downtrend is in a very early phase. It is the final wave within a series of increasingly larger downtrends that began in February, which in turn a part of still larger downtrends that began on January 4 and later.

Bottom line: Think bear market, and it has quite some time to go.

If the downtrend is typical, it will fall below the starting point of the preceding correction, which in this case is 3947.50, and perhaps significantly below that price.

What are the alternatives? Occasionally a correction will form a compound structure, linking two or three corrective patterns together, with each pattern being separated by a single wave in the direction opposite that of the correction. If that proves to be the case, then the upward correction that began on February 22 is still underway, the first corrective pattern ended on March 6, and the present decline is a connector wave that will be followed by a second corrective pattern.

Reading the chart. Elliott wave analysis views the chart as a complex structure of smaller waves nested within larger waves, which in turn are nested within still larger waves. My labeling system assigns numbers to the subwaves of trending waves, and letters to the subwaves of corrections. Each number or letter is followed by a subscript, in curly brackets, showing the waves position within the complex structure, called its “degree” in Elliott wave parlance. The smaller the number, the lower the degree. On this chart we’re dealing with relatively small waves, so the degree numbers are negative.

[S&P 500 E-mini futures at 3:30 p.m., 80-minute bars, with volume]

What does Elliott wave theory say? A discussion of the waves of interest using the wave numbers and degree subscripts.

Principal analysis:

  • The downward correction that began on February 2, wave 3{-7}, continues.
  • It is in the first of five subwaves, wave 1{-8}.
  • Within wave 1{-8}, wave 1{-9} is underway and is in the final subwave within a five-wave structure, downtrending wave 5{-10}.
  • Wave 5{-10}, in turn, is in its middle wave, 3{-11}.
  • Wave 3{-11}’s middle wave, wave 3{-12}, ended on February 22, and the next-to-the-last wave, an upward correction, wave 4{-12}, is now underway.
  • Internally, wave 4{-12} is in its final wave of three, C{-13}.
  • Wave C{-13} will have five waves internally, appears to have just completed wave C{-14} and may have completed wave D{-14} and to have launched its final wave, E{-14}, which will complete the parent wave, C{-13}.
  • The end of wave C{-13} will be the end of the correction, wave 4{-12}, which will be followed by wave 5{-12}, which will mark the end of wave 3{-11}, a subwave of downtrending wave 5{-10}.
  • The end of wave 5{-12} will also be the end of wave 3{-11}, a subwave of downtrending wave 5{-10}.
  • When wave 5{-10} is complete, it will also mark the end of wave 1{-9} and the beginning of a low-degree upward correction, wave 2{-9}.
  • Wave 3{-7} is still taking its tentative first steps and will develop into a powerful downtrend that will carry the price below 3502, the starting point of the preceding upward correction, wave 2{-7}, and most likely significantly below that level.

Alternative analysis:

  • Wave 4{-12}, an upward correction that began on February 22, is still underway and is forming a compound structure, linking two or three corrective patterns together..
  • A falling wave connecting the now complete first corrective pattern — waves A{-13}, B{-13} and C{-13} — with a future second corrective pattern is now underway and is designated wave X{-13}.

Bigger structures:

  • This is all happening within wave 3{-6}, which began on August 16, 2022.
  • Wave 3{-6} is encompassed by a series of larger waves, the smaller within the larger, stretching up five degrees to wave 4{-1}, which began on January 4, 2022.
  • Wave 4{-1} is the next-to-the-last wave within a large expanding Diagonal Triangle, wave 5{0}, that began on December 26, 2018
  • When wave 4{-1} is complete, wave 5{-1} will begin and will carry the wave above the January 4 high, 4808.25, and into the 6000s, where the present upper boundary of the triangle lies. The expanding part means that each day that upper boundary moves higher.

We Are Here.

These are the waves currently in progress under my principal analysis. Each line on the list shows the wave number, with the subscript in curly brackets, the traditional degree name, the starting date, the starting price of the S&P 500 E-mini futures, and the direction of the wave.

  • S&P 500 Index:
  • 5{+3} Supercycle, 7/8/1932, 4.40 (up)
  • 5{+2} Cycle, 12/9/1974, 60.96 (up)
  • 5{+1} Primary, 3/6/2009, 666.79 (up)
  • 5{0} Intermediate, 12/26/2018, 2346.58 (up)
  • S&P 500 Futures and index:
  • 4{-1} Minor, 1/4/2022, 4808.25 (down) (futures), 4818.62 (down) (index)
  • S&P 500 Futures:
  • 1{-2} Minute, 1/4/2022, 4808.25 (down)
  • 1{-3} Minuette, 1/4/2022, 4808.25 (down)
  • 1{-4} Subminuette, 1/4/2022, 4808.25 (down)
  • 1{-5} Micro, 1/4/2022, 4808.25 (down)
  • 3{-6} Submicro, 8/16/2022, 4327.50 (down)
  • 3{-7} Minuscule, 2/2/2023, 4208.50 (down)

Learning and other resources. Elliott wave analysis provides context, not prophecy. As the 20th century semanticist Alfred Korzybski put it in his book Science and Sanity (1933), “The map is not the territory … The only usefulness of a map depends on similarity of structure between the empirical world and the map.” And I would add, in the ever-changing markets, we can judge that similarity of structure only after the fact.

See the menu page Analytical Methods for a rundown on where to go for information on Elliott wave analysis.

By Tim Bovee, Portland, Oregon, March 8, 2023

Disclaimer

Tim Bovee, Private Trader tracks the analysis and trades of a private trader for his own accounts. Nothing in this blog constitutes a recommendation to buy or sell stocks, options or any other financial instrument. The only purpose of this blog is to provide education and entertainment.

No trader is ever 100 percent successful in his or her trades. Trading in the stock and option markets is risky and uncertain. Each trader must make trading decisions for his or her own account, and take responsibility for the consequences.

License
Creative Commons License

All content on Tim Bovee, Private Trader by Timothy K. Bovee is licensed under a Creative Commons Attribution-ShareAlike 4.0 International License.

Based on a work at www.timbovee.com.
Trader’s Notebook

3:30 p.m. New York time

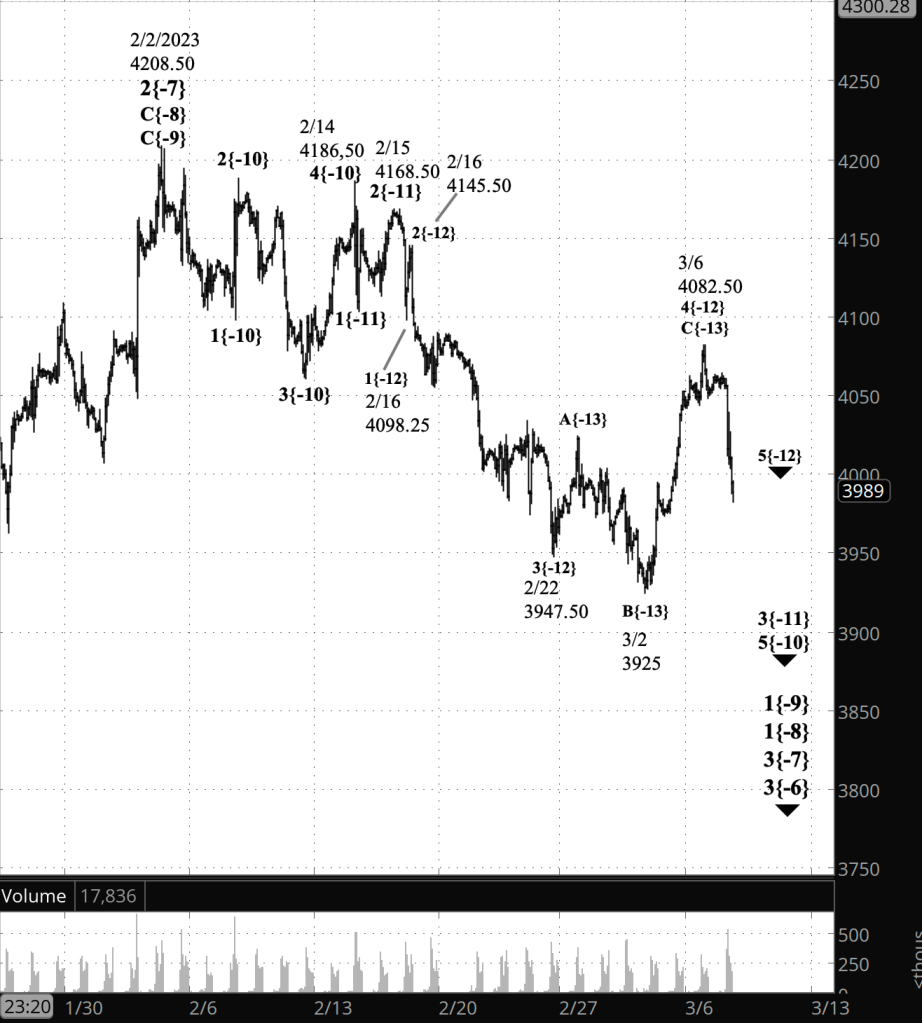
Half an hour before the closing bell. The S&P 500, index and futures, continued to fall during the session, with the futures reaching into the 3980s. The power of the decline pretty much eliminates this morning’s alternative analysis. Downtrending wave 5{-12} is underway and, if typical, can be expected to reach below 3947.50, and perhaps significantly lower.

How long will it last? Wave 3{-12} lasted for 17 calendar days. There’s no guarantee that wave 5{-12} will equal that, but it will likely be proportional to the 3rd wave. So that would give us March 23 plus or minus quite a bit as a reasonable, very tentative target.

What happens next? Wave 5{-12}, at its end, will also be the end of wave 3{-11}, which began on February 14. What happens next? Wave 4{-11} will commence. It is an upward correction one degree larger than the wave 4{-12} correction that ended yesterday. Wave 4{-12} lasted for 12 days, and wave 4{-11}, being of a larger degree, can be expected to last somewhat longer, if it’s typical.

And wave 4{-11}, when it ends, will mark the beginning of downtrending wave 5{-10}, another degree larger, which began on February 14.

So mid-February saw a busy few days on the chart, as three degrees of waves began on three consecutive days.

A new alternative. With the decline that began on March 6 firmly launched, the chart faces a new possibility: The upward correction that just ended under the principal analysis may be forming a compound correction. If that’s the case, then the correction hasn’t ended yet.

A compound correction links two or three corrective patterns together. Under the alternative scenario, what ended on March 6 was the first corrective pattern within wave 4{-12}, containing three waves internally. The present decline, under this alternative analysis, is wave X{-13}, which will connect the first corrective pattern with a second corrective pattern. I consider this to be less likely than the principal scenario, which see the correction as having ended. Nonetheless, an alternative correction can’t be ruled out entirely.

I’ve updated the chart.

9:35 a.m. New York time

What’s happening now? The S&P 500 E-mini futures traded narrowly overnight, staying in the 4050s and 4060s, then declining into the 4040s as the opening bell sounded.

What does it mean? The downtrend that began from yesterday’s peak and reversal, at 4082.40, continues and is in its early stages. The downtrend will eventually carry the price below 3947.50 — the starting point of the upward correction that began on February 22 — and most likely significantly below that level.

What are the alternatives? It remains possible that the price will move above yesterday’s high. If that should happen, then the final stage of the upward correction still had a bit more upside in it. Under the rules of Elliott wave analysis, a move above 4098.25 — the end of the preceding initial part of the larger downtrend that began on February 15 — will invalidate the present analysis and this alternative and will require a reanalysis of the chart.

That possible invalidation holds true even if a news event causes a momentary rise above 4098.25. One thing to watch for this morning is Federal Reserve Chair Jerome Powell’s appearance before the Senate Banking Committee to deliver his twice-a-year-monetary policy report. The hearing begins at 10 a.m. New York time.

Reading the chart. Elliott wave analysis views the chart as a complex structure of smaller waves nested within larger waves, which in turn are nested within still larger waves. My labeling system assigns numbers to the subwaves of trending waves, and letters to the subwaves of corrections. Each number or letter is followed by a subscript, in curly brackets, showing the waves position within the complex structure, called its “degree” in Elliott wave parlance. The smaller the number, the lower the degree. On this chart we’re dealing with relatively small waves, so the degree numbers are negative.

[S&P 500 E-mini futures at 3:30 p.m., 80-minute bars, with volume]

What does Elliott wave theory say? These are the waves that are I’m tracking.

Principal analysis:

  • The downward correction that began on February 2, wave 3{-7}, continues.
  • It is in the first of five subwaves, wave 1{-8}.
  • Within wave 1{-8}, wave 1{-9} is underway and is in the final subwave within a five-wave structure, downtrending wave 5{-10}.
  • Wave 5{-10}, in turn, is in its middle wave, 3{-11}.
  • Wave 3{-11}’s middle wave, wave 3{-12}, ended on February 22, and the next-to-the-last wave, an upward correction, wave 4{-12}, is now underway.
  • Internally, wave 4{-12} is in its final wave of three, C{-13}.
  • Wave C{-13} will have five waves internally, appears to have just completed wave C{-14} and may have completed wave D{-14} and to have launched its final wave, E{-14}, which will complete the parent wave, C{-13}.
  • The end of wave C{-13} will be the end of the correction, wave 4{-12}, which will be followed by wave 5{-12}, which will mark the end of wave 3{-11}, a subwave of downtrending wave 5{-10}.
  • The end of wave 5{-12} will also be the end of wave 3{-11}, a subwave of downtrending wave 5{-10}.
  • When wave 5{-10} is complete, it will also mark the end of wave 1{-9} and the beginning of a low-degree upward correction, wave 2{-9}.
  • Wave 3{-7} is still taking its tentative first steps and will develop into a powerful downtrend that will carry the price below 3502, the starting point of the preceding upward correction, wave 2{-7}, and most likely significantly below that level.

Alternative analysis:

  • Wave 4{-12}, an upward correction, is still underway.
  • It is in its third internal wave, C{-13}.
  • The end of C{-13} will also be the end of wave 4{-12} and the starting point of a downtrend, wave 5{-12}, which will carry the price below 3947.50 — the starting point of wave 4{-12} and perhaps significantly below that level.

Bigger structures:

  • This is all happening within wave 3{-6}, which began on August 16, 2022.
  • Wave 3{-6} is encompassed by a series of larger waves, the smaller within the larger, stretching up five degrees to wave 4{-1}, which began on January 4, 2022.
  • Wave 4{-1} is the next-to-the-last wave within a large expanding Diagonal Triangle, wave 5{0}, that began on December 26, 2018
  • When wave 4{-1} is complete, wave 5{-1} will begin and will carry the wave above the January 4 high, 4808.25, and into the 6000s, where the present upper boundary of the triangle lies. The expanding part means that each day that upper boundary moves higher.

We Are Here.

These are the waves currently in progress under my principal analysis. Each line on the list shows the wave number, with the subscript in curly brackets, the traditional degree name, the starting date, the starting price of the S&P 500 E-mini futures, and the direction of the wave.

  • S&P 500 Index:
  • 5{+3} Supercycle, 7/8/1932, 4.40 (up)
  • 5{+2} Cycle, 12/9/1974, 60.96 (up)
  • 5{+1} Primary, 3/6/2009, 666.79 (up)
  • 5{0} Intermediate, 12/26/2018, 2346.58 (up)
  • S&P 500 Futures and index:
  • 4{-1} Minor, 1/4/2022, 4808.25 (down) (futures), 4818.62 (down) (index)
  • S&P 500 Futures:
  • 1{-2} Minute, 1/4/2022, 4808.25 (down)
  • 1{-3} Minuette, 1/4/2022, 4808.25 (down)
  • 1{-4} Subminuette, 1/4/2022, 4808.25 (down)
  • 1{-5} Micro, 1/4/2022, 4808.25 (down)
  • 3{-6} Submicro, 8/16/2022, 4327.50 (down)
  • 3{-7} Minuscule, 2/2/2023, 4208.50 (down)

Learning and other resources. Elliott wave analysis provides context, not prophecy. As the 20th century semanticist Alfred Korzybski put it in his book Science and Sanity (1933), “The map is not the territory … The only usefulness of a map depends on similarity of structure between the empirical world and the map.” And I would add, in the ever-changing markets, we can judge that similarity of structure only after the fact.

See the menu page Analytical Methods for a rundown on where to go for information on Elliott wave analysis.

By Tim Bovee, Portland, Oregon, March 7, 2023

Disclaimer

Tim Bovee, Private Trader tracks the analysis and trades of a private trader for his own accounts. Nothing in this blog constitutes a recommendation to buy or sell stocks, options or any other financial instrument. The only purpose of this blog is to provide education and entertainment.

No trader is ever 100 percent successful in his or her trades. Trading in the stock and option markets is risky and uncertain. Each trader must make trading decisions for his or her own account, and take responsibility for the consequences.

License
Creative Commons License

All content on Tim Bovee, Private Trader by Timothy K. Bovee is licensed under a Creative Commons Attribution-ShareAlike 4.0 International License.

Based on a work at www.timbovee.com.

Trader’s Notebook

3:30 p.m. New York time

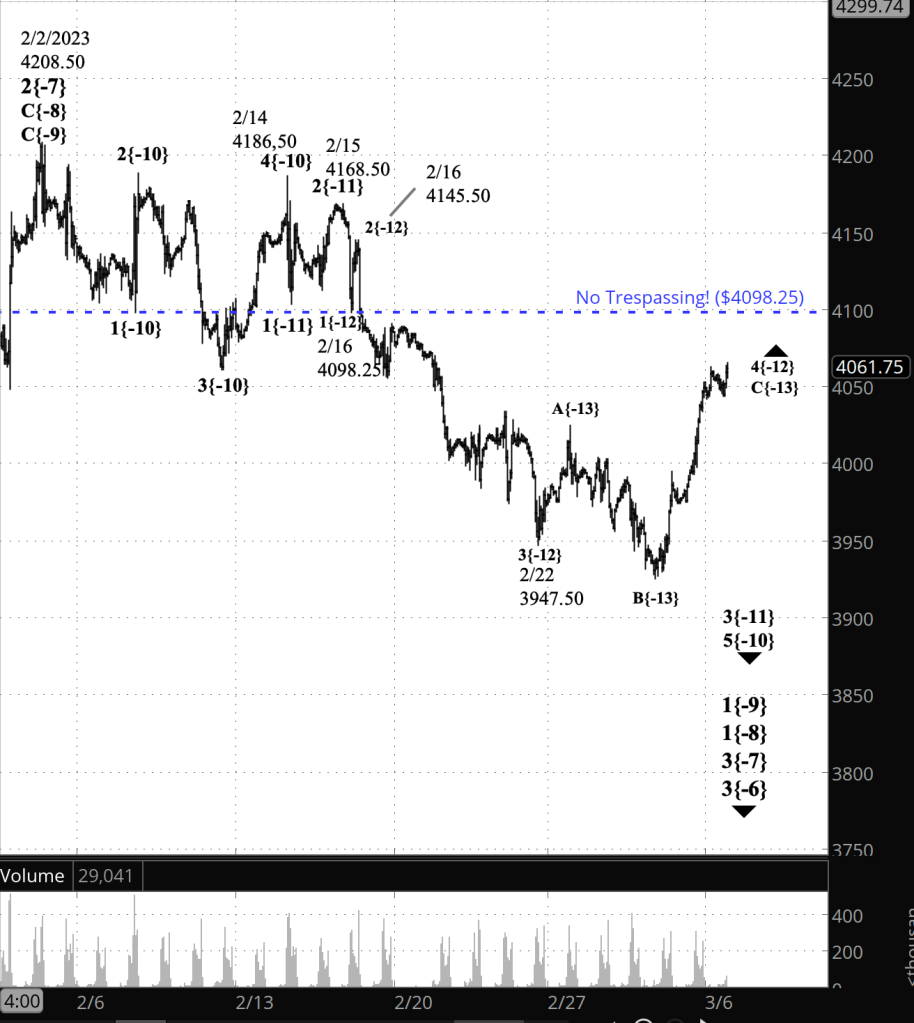
Half an hour before the closing bell. Once again we’re fishing for a top, a reversal point that will mean the upward correction has ended and a downtrend has begun. The rise that is the final wave of the 4th wave correction began on March 2 from 3925 and has completed five waves internally. The high so far, and possibly the reversal point, is at 4082.50, about 16 points below the end of the preceding 1st wave, which meets the requirement of Elliott wave analysis that a 4th wave not move into the territory of the preceding 1st wave.

So all of the Elliott wave requirements have been met. Does this mean that it’s 100% certain that downtrend has begun? Not at all. The price can still rise a bit more and be within the rules. However, there’s not much space remaining on the upside, and so I’ve marked the new chart on the assumption that the upward correction, wave 4{-12}, is complete, and the downtrend, wave 5{-12}, has begun.

Wave 5{-12}, if it is typical of 5th waves, will move below the starting point of the preceding 4th wave, 3947.50, and most likely significantly below that level. When wave 5{-12} is complete, it will also be the end of its parent, downtrending wave 3{-11}, which began on February 15 from 4168.50, and the beginning of a larger upward correction, wave 4{-11}, which will take back a portion of that downtrending 3rd wave.

[This afternoon’s analysis]

[S&P 500 E-mini futures at 3:30 p.m., 80-minute bars, with volume]

10:25 a.m. New York time

Two losing earning play exits. I exited two earnings earnings plays where the share price moved opposite the trades’ expectations.

NVDA was a forced exit, to avoid assignment when the stock went ex-dividend the next day. The loss, while significant, was within the position’s maximum rsk.

DELL also headed up when I had expected a negative response to earnings. Rather than hope things improved, I chose to take the money out and apply to the chance of profitable trades.

I’ve updated the trade analyses with full information on the exits: NVDA and DELL.

9:35 a.m. New York time

What’s happening now? The S&P 500 E-mini futures rose overnight into 4060s, pulled back slightly, and then resumed its rise.

What does it mean? The upward correction that began on February 22 is nearing it’s upper limit. The correction is the 4th wave of five within a larger downtrend that began on February 15. Under the rules of Elliott wave analysis, a 4th wave cannot move into the range of the preceding 1st wave. In this case, the “No Trespassing!” sign is at 4098.25, the end of the 1st wave, That level is shown on the chart as a blue dotted line.

The present upward correction should have five subwaves within its final wave. I count four, with the final wave perhaps about to begin.

What are the alternatives? There are no viable alternatives at this point, but there are two points of ambiguity.

One is the relationship between the S&P 500 futures and the S&P 500 index. The index moves in one-cent increments. The futures are priced in 25-cent increments. A 25:1 ratio is a huge difference, and it’s quite possible for the futures to exceed the uppwer boundary wile the index remains below. The “No Trespassing!” sign for the index is at 4095.01 (was incorrectly written as 4049.14). Since the futures and the index are in based on the same collection of blue-chip stocks, I find it unthinkable for the two products to have different analyses. If it happens, it will have to be resolved. One way is through a re-analysis of the chart. Another way is through the passage of time, since I’ve found such ambiguities will resolve themselves, as the two charts move back into alignnment.

The other point of ambiguity is where the correction should be placed in relation to the much larger downtrend that began on February 2. The relative size between waves is called the wave’s degree. I show the upward correction to be five degrees below the February 2 downtrend, but it could be a larger degree. While wave counts tend to be obvious, the degree placement is always somewhat ambiguous, especially in the early stages of the larger wave, which is the case on this chart.

Reading the chart. Elliott wave analysis views the chart as a complex structure of smaller waves nested within larger waves, which in turn are nested within still larger waves. My labeling system assigns numbers to the subwaves of trending waves, and letters to the subwaves of corrections. Each number or letter is followed by a subscript, in curly brackets, showing the waves position within the complex structure, called its “degree” in Elliott wave parlance. The smaller the number, the lower the degree. On this chart we’re dealing with relatively small waves, so the degree numbers are negative.

[This morning’s analysis]

[S&P 500 E-mini futures at 9:35 a.m., hourly bars, with volume]

What does Elliott wave theory say? [This morning’s analysis] These are the waves that are I’m keeping a close eye on.

Principal analysis:

  • The downward correction that began on February 2, wave 3{-7}, continues.
  • It is in the first of five subwaves, wave 1{-8}.
  • Within wave 1{-8}, wave 1{-9} is underway and is in the final subwave within a five-wave structure, downtrending wave 5{-10}.
  • Wave 5{-10}, in turn, is in its middle wave, 3{-11}.
  • Wave 3{-11}’s middle wave, wave 3{-12}, ended on February 22, and the next-to-the-last wave, an upward correction, wave 4{-12}, is now underway.
  • Internally, wave 4{-12} is in its final wave of three, C{-13}.
  • Wave C{-13} will have five waves internally, appears to have just completed wave C{-14} and may have completed wave D{-14} and to have launched its final wave, E{-14}, which will complete the parent wave, C{-13}.
  • The end of wave C{-13} will be the end of the correction, wave 4{-12}, which will be followed by wave 5{-12}, which will mark the end of wave 3{-11}, a subwave of downtrending wave 5{-10}.
  • The end of wave 5{-12} will also be the end of wave 3{-11}, a subwave of downtrending wave 5{-10}.
  • When wave 5{-10} is complete, it will also mark the end of wave 1{-9} and the beginning of a low-degree upward correction, wave 2{-9}.
  • Wave 3{-7} is still taking its tentative first steps and will develop into a powerful downtrend that will carry the price below 3502, the starting point of the preceding upward correction, wave 2{-7}, and most likely significantly below that level.

How high can it go: Here’s the Elliott wave nomenclature for the possible endpoints of wave 4{-12}.

  • At the most, 4098.25, the “No Trespssing!” level that marks the end of wave 1{-12} within wave 3{-11} within wave 5{-10}.
  • Possibly in the vicinity of 4023.14, the 38.2% Fibonacci retracement level.
  • Typically, no higher than 4034.25, the peak of the wave 4{-13} within wave 3{-12} within wave 3{-11}.

We Are Here.

These are the waves currently in progress under my principal analysis. Each line on the list shows the wave number, with the subscript in curly brackets, the traditional degree name, the starting date, the starting price of the S&P 500 E-mini futures, and the direction of the wave.

  • S&P 500 Index:
  • 5{+3} Supercycle, 7/8/1932, 4.40 (up)
  • 5{+2} Cycle, 12/9/1974, 60.96 (up)
  • 5{+1} Primary, 3/6/2009, 666.79 (up)
  • 5{0} Intermediate, 12/26/2018, 2346.58 (up)
  • S&P 500 Futures and index:
  • 4{-1} Minor, 1/4/2022, 4808.25 (down) (futures), 4818.62 (down) (index)
  • S&P 500 Futures:
  • 1{-2} Minute, 1/4/2022, 4808.25 (down)
  • 1{-3} Minuette, 1/4/2022, 4808.25 (down)
  • 1{-4} Subminuette, 1/4/2022, 4808.25 (down)
  • 1{-5} Micro, 1/4/2022, 4808.25 (down)
  • 3{-6} Submicro, 8/16/2022, 4327.50 (down)
  • 3{-7} Minuscule, 2/2/2023, 4208.50 (down)

Learning and other resources. Elliott wave analysis provides context, not prophecy. As the 20th century semanticist Alfred Korzybski put it in his book Science and Sanity (1933), “The map is not the territory … The only usefulness of a map depends on similarity of structure between the empirical world and the map.” And I would add, in the ever-changing markets, we can judge that similarity of structure only after the fact.

See the menu page Analytical Methods for a rundown on where to go for information on Elliott wave analysis.

By Tim Bovee, Portland, Oregon, March 6, 2023

Disclaimer

Tim Bovee, Private Trader tracks the analysis and trades of a private trader for his own accounts. Nothing in this blog constitutes a recommendation to buy or sell stocks, options or any other financial instrument. The only purpose of this blog is to provide education and entertainment.

No trader is ever 100 percent successful in his or her trades. Trading in the stock and option markets is risky and uncertain. Each trader must make trading decisions for his or her own account, and take responsibility for the consequences.

License
Creative Commons License

All content on Tim Bovee, Private Trader by Timothy K. Bovee is licensed under a Creative Commons Attribution-ShareAlike 4.0 International License.

Based on a work at www.timbovee.com.
Trader’s Notebook

3:30 p.m. New York time

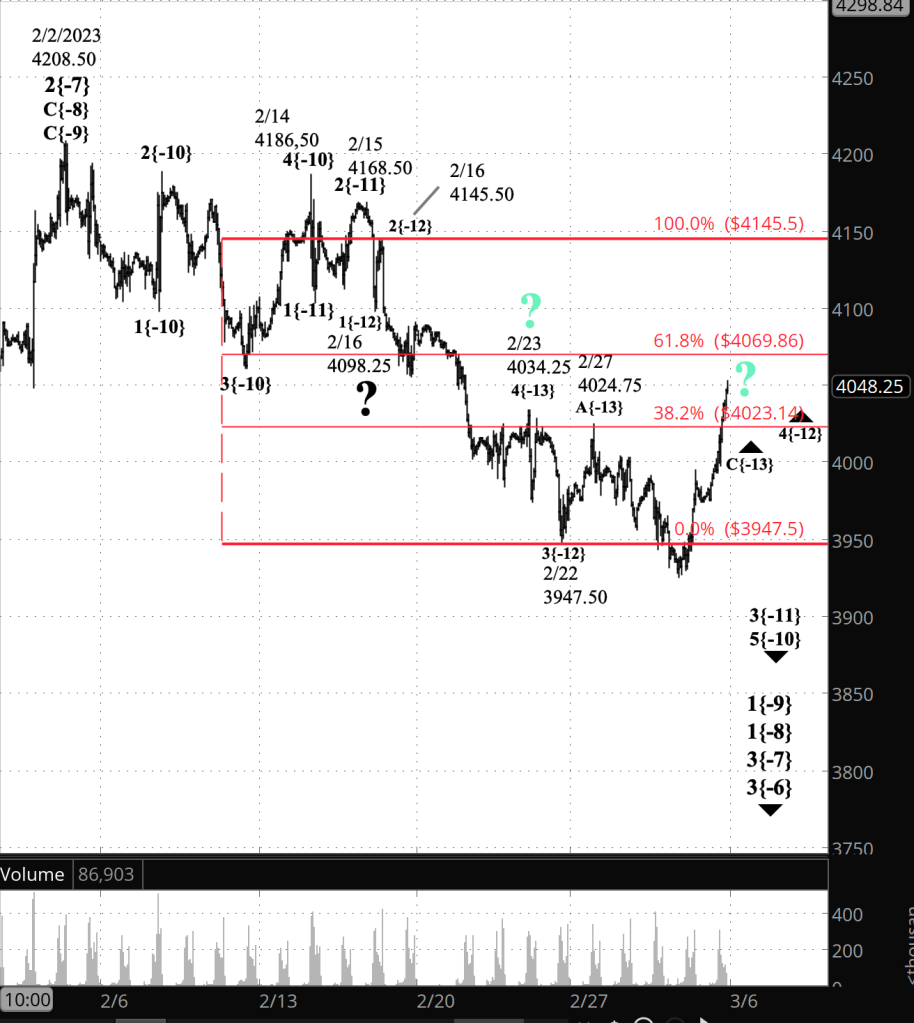
Half an hour before the closing bell. The S&P 500 futures rose sharply during session, reaching the 4050s as the closing bell approached. The upward correction that began on February 22 is almost complete.

This morning I listed three possible targets as the endpoint of the correction, wave 4{-12} marking each possibility ln the chart with a large question mark. Two of the possibilities were eliminated by today’s rise, the 38.2% Fibonacci retracement level and the peak of the 4th wave within the preceding 3rd wave, which was wave 4{-13}. In honor of their being surpassed, I’ve changed their color to sickly green.

Remaining is 4098.25, the ending the proceeding 1st wave of the downtrend, wave 1{-12}, on February 16. This possible target differs from the other two. Under the rules of Elliott wave analysis, a 4th wave cannot exceed the endpoint of the preceding 1st wave.

If the price hits 2098.25 and reverses, then the upward correction ends at that point, and the final wave of the larger downtrend, wave 5{-12}, will have begun.

If the price exceeds 2098.25, then by the book, the labeling no longer reflects the reality of the chart — the map doesn’t match the territory — and the analysis will have to be redone.

Maybe. The S&P 500 and products derived from it are a complex ecosystem. The index trades only during the sessions, in increments of one cent. The futures trade 24 hours a day, takes Saturdays off, and then resumes trading Sunday evenings (New York time). The trading increment is 25 cents.

Given the large disparity between the increments by which each product moves, it’s easy to imagine the futures going over that absolute ceiling, while the index stays below it. The end of wave 1{-12} for the index, the ceiling for the upward correction, is 4049.14, set on February 17.

If there’s a disparity between the two trading vehicles, then each case is unique and must be judged based on what happens after the ceiling is hit. I tend to give greater weight to the index, since it has the smaller increment. But we’ll see.

9:35 a.m. New York time

What’s happening now? The S&P 500 E-mini futures rose overnight, reaching 4011 so far.

What does it mean? The continued rise lends credence to the principal analysis since later February: The upward correction that began on February 22 is underway and is in its final wave. The correction is the 4th wave of a downtrend that began on February 15.

How high can it go?

  • At the most, 4098.25, the end of the preceding 1st wave of the downtrend.
  • Possibly in the vicinity of 4023.14, the 38.2% Fibonacci retracement level.
  • Typically, no higher than 4034.25, the peak of the 4th wave within the preceding 3rd wave of the downtrend that began February 15. This level would be a small overshoot of the 38.2% Fib retracement, and I think this is the strongest possibllity.

See the humongous question marks on the chart.

What are the alternatives? None at present. For much of the week there has been a possibility that the upward correction had ended on February 27 at 4024.75 and that subsequent decline was the early stages of the downtrend that will follow the upward correction. The rise from yesterday’s low, 3925, makes that alternative vanishingly unlikely.

Reading the chart. Elliott wave analysis views the chart as a complex structure of smaller waves nested within larger waves, which in turn are nested within still larger waves. My labeling system assigns numbers to the subwaves of trending waves, and letters to the subwaves of corrections. Each number or letter is followed by a subscript, in curly brackets, showing the waves position within the complex structure, called its “degree” in Elliott wave parlance. The smaller the number, the lower the degree. On this chart we’re dealing with relatively small waves, so the degree numbers are negative.

[S&P 500 E-mini futures at 3:30 p.m., hourly bars, with volume]

What does Elliott wave theory say? These are the waves that are I’m keeping a close eye on.

Principal analysis:

  • The downward correction that began on February 2, wave 3{-7}, continues.
  • It is in the first of five subwaves, wave 1{-8}.
  • Within wave 1{-8}, wave 1{-9} is underway and is in the final subwave within a five-wave structure, downtrending wave 5{-10}.
  • Wave 5{-10}, in turn, is in its middle wave, 3{-11}.
  • Wave 3{-11}’s middle wave, wave 3{-12}, ended on February 22, and the next-to-the-last wave, an upward correction, wave 4{-12}, is now underway.
  • Internally, wave 4{-12} is in its final wave of three, C{-13}.
  • The end of wave C{-13} will be the end of the correction, wave 4{-12}, which will be followed by wave 5{-12}, which will mark the end of wave 3{-11}, a subwave of downtrending wave 5{-10}.
  • The end of wave 5{-12} will also be the end of wave 3{-11}, a subwave of downtrending wave 5{-10}.
  • When wave 5{-10} is complete, it will also mark the end of wave 1{-9} and the beginning of a low-degree upward correction, wave 2{-9}.
  • Wave 3{-7} is still taking its tentative first steps and will develop into a powerful downtrend that will carry the price below 3502, the starting point of the preceding upward correction, wave 2{-7}, and most likely significantly below that level.

How high can it go: Here’s the Elliott wave nomenclature for the possible endpoints of wave 4{-12}.

  • At the most, 4098.25, the end of wave 1{-12} within wave 3{-11} within wave 5{-10}.
  • Possibly in the vicinity of 4023.14, the 38.2% Fibonacci retracement level.
  • Typically, no higher than 4034.25, the peak of the wave 4{-13} within wave 3{-12} within wave 3{-11}.

We Are Here.

These are the waves currently in progress under my principal analysis. Each line on the list shows the wave number, with the subscript in curly brackets, the traditional degree name, the starting date, the starting price of the S&P 500 E-mini futures, and the direction of the wave.

  • S&P 500 Index:
  • 5{+3} Supercycle, 7/8/1932, 4.40 (up)
  • 5{+2} Cycle, 12/9/1974, 60.96 (up)
  • 5{+1} Primary, 3/6/2009, 666.79 (up)
  • 5{0} Intermediate, 12/26/2018, 2346.58 (up)
  • S&P 500 Futures and index:
  • 4{-1} Minor, 1/4/2022, 4808.25 (down) (futures), 4818.62 (down) (index)
  • S&P 500 Futures:
  • 1{-2} Minute, 1/4/2022, 4808.25 (down)
  • 1{-3} Minuette, 1/4/2022, 4808.25 (down)
  • 1{-4} Subminuette, 1/4/2022, 4808.25 (down)
  • 1{-5} Micro, 1/4/2022, 4808.25 (down)
  • 3{-6} Submicro, 8/16/2022, 4327.50 (down)
  • 3{-7} Minuscule, 2/2/2023, 4208.50 (down)

Learning and other resources. Elliott wave analysis provides context, not prophecy. As the 20th century semanticist Alfred Korzybski put it in his book Science and Sanity (1933), “The map is not the territory … The only usefulness of a map depends on similarity of structure between the empirical world and the map.” And I would add, in the ever-changing markets, we can judge that similarity of structure only after the fact.

See the menu page Analytical Methods for a rundown on where to go for information on Elliott wave analysis.

By Tim Bovee, Portland, Oregon, March 3, 2023

Disclaimer

Tim Bovee, Private Trader tracks the analysis and trades of a private trader for his own accounts. Nothing in this blog constitutes a recommendation to buy or sell stocks, options or any other financial instrument. The only purpose of this blog is to provide education and entertainment.

No trader is ever 100 percent successful in his or her trades. Trading in the stock and option markets is risky and uncertain. Each trader must make trading decisions for his or her own account, and take responsibility for the consequences.

License
Creative Commons License

All content on Tim Bovee, Private Trader by Timothy K. Bovee is licensed under a Creative Commons Attribution-ShareAlike 4.0 International License.

Based on a work at www.timbovee.com.
DELL Trade

Dell Technologies Inc. (DELL)

Update 3/6/2023: I exited my short bull put vertical spread on DELL, 46 days before expiration, for a $1.21 debit per contract/share, a loss before fees of $24 per contract. Shares were trading at $40.15, up $0.79 from the entry level.

The Implied Volatility Rank at exit was 11.3%, down 40-.1 points from the entry level.

I exited on the day after entry because the price move opposite the direction of the trade.

Shares rose by 2.0% over four days for a +183% annual rate. The options position produced a 19.8% loss for a -1,810% annual rate.


I have entered a short bear call vertical spread on DELL, using options that trade for the last time 50 days hence, on April 27. The premium is a $0.97 credit per contract share and the stock at the time of entry was priced at $39.36.

The Implied Volatility Ratio stood at 51.4%.

Premium:$0.97Expire OTM
DELL-bear call spreadStrikeOddsDelta
Calls
Long42.5073.0%31
Break-even40.9765.5%39.5
Short40.0058.0%48

The premium is 77.6% of the width of the position’s short/long spread. The profit zone covers a 4.1% move to the upside and an unlimited move to the upside.

The risk/reward ratio is 1.6:1, with maximum risk of $153 and maximum reward of $97 per contract.

How I chose the trade. The trade was placed to coincide with DELL’s earnings announcement, after the closing bell on the day of entry. The short strikes were set to coincide with the expected move of $1.52 either way, based on options pricing, which gives a price range of $37.84 to $40.88. The Zacks Investment Research earnings surprise predictor gave DELL a score of -4.35%, with a rank of 3(hold).

By Tim Bovee, Portland, Oregon, March 2, 2023

Disclaimer

Tim Bovee, Private Trader tracks the analysis and trades of a private trader for his own accounts. Nothing in this blog constitutes a recommendation to buy or sell stocks, options or any other financial instrument. The only purpose of this blog is to provide education and entertainment.

No trader is ever 100 percent successful in his or her trades. Trading in the stock and option markets is risky and uncertain. Each trader must make trading decisions for his or her own account, and take responsibility for the consequences.

License
Creative Commons License

All content on Tim Bovee, Private Trader by Timothy K. Bovee is licensed under a Creative Commons Attribution-ShareAlike 4.0 International License.

Based on a work at www.timbovee.com.

Trader’s Notebook

3:30 p.m. New York time

Half an hour before the closing bell. The S&P 500 futures reversed from the overnight low, 3925, and pushed higher, back into the 3980s. This means that the final segment of the upward correction that began on February 22 is now underway. Maybe. Traders have spent the last few days bottom fishing, but honestly, who really knows whether this is in fact the end of the declining middle segment and the rise of the final segment.

In Elliott wave terminology, the final segment, wave C{-13} is now underway. It is a subwave of wave 4{-12}, an upward correction within downtrending wave 3{-11}, which began on February 16.

I’ve updated the chart, changing the wave labels to show that wave C{-13} is in progress.

How how high can it go? The correction is a 4th wave, and a rule of Elliott wave analysis says that if a 4th wave moves beyond the end of the preceding 1st wave, at 4098.25 in this case, then it’s not really a 4th wave and the chart must be reanalyzed.

And conversely, if the price reverses and moves even lower than last night’s low, I’ll consider once again the alternative analysis, which sees the upward correction as having ended on February 27 and the downtrend having resumed.

9:55 a.m. New York time

DELL earnings play entry. I’ve opened a short bear call spread on DELL, using options that trade for the last time in 50 days, and have posted an analysis. of the trade.

9:35 a.m. New York time

What’s happening now? The S&P 500 E-mini futures declined further overnight but then rose enough to take almost all of it back in a classic resistance battle between bear and bull sentiments.

What does it mean? Elliott wave analysis suggests that bulls will win, although the result won’t be a true uptrend but rather will be the final leg of an upward correction that began on October 13, 2022. When the correction is complete, a true downtrend of significant size will begin.

What are the alternatives? Unchanged from the last few days. It’s possible that a downtrending subwave of the February 2 decline, one that began on February 14, ended at the February 22 low. If that proves to be the case, then the upward correction will be larger than the principal analysis expects. I think this scenario is less likely because the scale of its internal waves is small compared to the size of the parent wave. There’s a lack of proportion, which often means that there’s a more accurate analysis to be found.

Reading the chart. Elliott wave analysis views the chart as a complex structure of smaller waves nested within larger waves, which in turn are nested within still larger waves. My labeling system assigns numbers to the subwaves of trending waves, and letters to the subwaves of corrections. Each number or letter is followed by a subscript, in curly brackets, showing the waves position within the complex structure, called its “degree” in Elliott wave parlance. The smaller the number, the lower the degree. On this chart we’re dealing with relatively small waves, so the degree numbers are negative.

[S&P 500 E-mini futures at 3:30 p.m., hourly bars, with volume]

What does Elliott wave theory say? These are the waves that are guiding my analysis, unchanged from yesterday.

Principal analysis:

  • The downward correction that began on February 2, wave 3{-7}, continues.
  • It is in the first of five subwaves, wave 1{-8}.
  • Within wave 1{-8}, wave 1{-9} is underway and is in the final subwave within a five-wave structure, downtrending wave 5{-10}.
  • Wave 5{-10}, in turn, is in its middle wave, 3{-11}.
  • Wave 3{-11}’s middle wave, wave 3{-12}, ended on February 22, and the next-to-the-last wave, an upward correction, wave 4{-12}, is now underway.
  • Internally, wave 4{-12} is in its middle wave of three, B{-13}, which is at or near its end. It will be followed by rising wave C{-13} may well end that the 61.7% Fibonacci retracement level, 4069.86. However, under the rules of Elliott wave analysis, it cannot move above the end of wave 1{-12}, 4098.25. If it does, it will force a reanalysis.
  • The end of wave C{-13} will be the end of the correction, wave 4{-12}, which will be followed by wave 5{-12}, which will mark the end of wave 3{-11}, a subwave of downtrending wave 5{-10}.
  • The end of wave 5{-12} will also be the end of wave 3{-11}, a subwave of downtrending wave 5{-10}.
  • When wave 5{-10} is complete, it will also mark the end of wave 1{-9} and the beginning of a low-degree upward correction, wave 2{-9}.
  • Wave 3{-7} is still taking its tentative first steps and will develop into a powerful downtrend that will carry the price below 3502, the starting point of the preceding upward correction, wave 2{-7}, and most likely significantly below that level.

Alternative analysis:

The alternative makes these changes to the principal analysis.

  • The February 22 low is the end of wave 5{-12} and also the end of its parent wave, 3{-11}.
  • Wave 4{-11}, an upward correction, began on that date.

We Are Here.

These are the waves currently in progress under my principal analysis. Each line on the list shows the wave number, with the subscript in curly brackets, the traditional degree name, the starting date, the starting price of the S&P 500 E-mini futures, and the direction of the wave.

  • S&P 500 Index:
  • 5{+3} Supercycle, 7/8/1932, 4.40 (up)
  • 5{+2} Cycle, 12/9/1974, 60.96 (up)
  • 5{+1} Primary, 3/6/2009, 666.79 (up)
  • 5{0} Intermediate, 12/26/2018, 2346.58 (up)
  • S&P 500 Futures and index:
  • 4{-1} Minor, 1/4/2022, 4808.25 (down) (futures), 4818.62 (down) (index)
  • S&P 500 Futures:
  • 1{-2} Minute, 1/4/2022, 4808.25 (down)
  • 1{-3} Minuette, 1/4/2022, 4808.25 (down)
  • 1{-4} Subminuette, 1/4/2022, 4808.25 (down)
  • 1{-5} Micro, 1/4/2022, 4808.25 (down)
  • 3{-6} Submicro, 8/16/2022, 4327.50 (down)
  • 3{-7} Minuscule, 2/2/2023, 4208.50 (down)

Learning and other resources. Elliott wave analysis provides context, not prophecy. As the 20th century semanticist Alfred Korzybski put it in his book Science and Sanity (1933), “The map is not the territory … The only usefulness of a map depends on similarity of structure between the empirical world and the map.” And I would add, in the ever-changing markets, we can judge that similarity of structure only after the fact.

See the menu page Analytical Methods for a rundown on where to go for information on Elliott wave analysis.

By Tim Bovee, Portland, Oregon, March 2, 2023

Disclaimer

Tim Bovee, Private Trader tracks the analysis and trades of a private trader for his own accounts. Nothing in this blog constitutes a recommendation to buy or sell stocks, options or any other financial instrument. The only purpose of this blog is to provide education and entertainment.

No trader is ever 100 percent successful in his or her trades. Trading in the stock and option markets is risky and uncertain. Each trader must make trading decisions for his or her own account, and take responsibility for the consequences.

License
Creative Commons License

All content on Tim Bovee, Private Trader by Timothy K. Bovee is licensed under a Creative Commons Attribution-ShareAlike 4.0 International License.

Based on a work at www.timbovee.com.

Trader’s Notebook

3:30 p.m. New York time

Half an hour before the closing bell. The S&P 500 futures during the day edged slightly below the pre-session low, 3956, reaching a low so far of 3943. The present upward correction, wave 2{-7}, began at 3947.50 on February 22, and the session low fell below that mark.

This reversal puts the analysis in search of a low and reversal, a process called “bottom fishing” in trader jargon. It means that even though the analysis lines up perfectly for the present low to actually be the turning point, there’s always just slight of low left, enough to invalidate that earlier conclusion. I’ve changed the chart below to show the present low as being the end of the middle wave of the correction, wave B{-13}.

However, I find it important that I remember that there is possibly more bottom fishing ahead. I would expect the end of wave B{-13} to be much beyond the start of the wave 2{-7} correction.

With that one adjustment, this morning’s analysis stands unchanged.

9:55 a.m. New York time

RIVN earnings play exit. I’ve exited my short bear call verticval options spread on RIVN for 34.2% of maximum potential profit and have updated the trade analysis with full results.

9:35 a.m. New York time

What’s happening now? The S&P 500 E-mini futures reached a low of 3956 after the closing bell on Tuesday, rose during the wee hours of the morning to 3991 and then fell back, reaching into the 3960s.

What does it mean? The downtrend that began on February 15, a smaller part of a nested series of larger corrections, is in an upward correction. That correction internally is in its final leg. When the upward correction is complete, it will be followed by a decline, the final portion of the downtrend.

The key question now is how far the upward correction can go. The correction is the 4th segment of the downtrend, and a rule of Elliott wave analysis says that if a 4th wave moves beyond the end of the preceding 1st wave, 4098.25 in this case, then it’s not really a 4th wave and the chart must be reanalyzed. That sets an upper limit on the rise on this principal analysis.

There’s no guarantee that the correction will go that high. A common stopping point is a Fibonacci retracement level. The first leg of the correction touched the 38.2% Fibonacci level. The next Fib level higher, a 61.8% retracement, or 4969.86, would be a likely end point, although it’s a tendency, not a rule.

What are the alternatives? It’s possible that a downtrending subwave of the February 2 decline, one that began on February 14, ended at the February 22 low. If that proves to be the case, then the upward correction will be larger than the principal analysis expects.

Reading the chart. Under the labeling system, each wave — a directional price movement — has a designation — a number or letter — that shows its position within the larger structure that contains it. And each wave designation is followed by a subscript, in curly brackets, to indicate the wave’s place, its degree, within the complete fractal structure of the price movements. The subscript is needed because in Elliott wave analysis, waves form a fractal structure, with smaller waves serving as the building blocks of larger waves, which in turn are building blocks of still larger waves.

[S&P 500 E-mini futures at 3:30 p.m., hourly bars, with volume]

What does Elliott wave theory say? These are the waves that are guiding my analysis.

Principal analysis:

  • The downward correction that began on February 2, wave 3{-7}, continues.
  • It is in the first of five subwaves, wave 1{-8}.
  • Within wave 1{-8}, wave 1{-9} is underway and is in the final subwave within a five-wave structure, downtrending wave 5{-10}.
  • Wave 5{-10}, in turn, is in its middle wave, 3{-11}.
  • Wave 3{-11}’s middle wave, wave 3{-12}, ended on February 22, and the next-to-the-last wave, an upward correction, wave 4{-12}, is now underway.
  • Internally, wave 4{-12} is in its last wave of three, C{-13}. Wave C{-13} may well end that the 61.7% Fibonacci retracement level, 4069.86. However, under the rules of Elliott wave analysis, it cannot move above the end of wave 1{-12}, 4098.25. If it does, it will force a reanalysis.
  • The end of wave C{-13} will be the end of the correction, wave 4{-12}, which will be followed by wave 5{-12}, which will mark the end of wave 3{-11}, a subwave of downtrending wave 5{-10}.
  • The end of wave 5{-12} will also be the end of wave 3{-11}, a subwave of downtrending wave 5{-10}.
  • When wave 5{-10} is complete, it will also mark the end of wave 1{-9} and the beginning of a low-degree upward correction, wave 2{-9}.
  • Wave 3{-7} is still taking its tentative first steps and will develop into a powerful downtrend that will carry the price below 3502, the starting point of the preceding upward correction, wave 2{-7}, and most likely significantly below that level.

Alternative analysis:

The alternative makes these changes to the principal analysis.

  • The February 22 low is the end of wave 5{-12} and also the end of its parent wave, 3{-11}.
  • Wave 4{-11}, an upward correction, began on that date.

We Are Here.

These are the waves currently in progress under my principal analysis. Each line on the list shows the wave number, with the subscript in curly brackets, the traditional degree name, the starting date, the starting price of the S&P 500 E-mini futures, and the direction of the wave.

  • S&P 500 Index:
  • 5{+3} Supercycle, 7/8/1932, 4.40 (up)
  • 5{+2} Cycle, 12/9/1974, 60.96 (up)
  • 5{+1} Primary, 3/6/2009, 666.79 (up)
  • 5{0} Intermediate, 12/26/2018, 2346.58 (up)
  • S&P 500 Futures and index:
  • 4{-1} Minor, 1/4/2022, 4808.25 (down) (futures), 4818.62 (down) (index)
  • S&P 500 Futures:
  • 1{-2} Minute, 1/4/2022, 4808.25 (down)
  • 1{-3} Minuette, 1/4/2022, 4808.25 (down)
  • 1{-4} Subminuette, 1/4/2022, 4808.25 (down)
  • 1{-5} Micro, 1/4/2022, 4808.25 (down)
  • 3{-6} Submicro, 8/16/2022, 4327.50 (down)
  • 3{-7} Minuscule, 2/2/2023, 4208.50 (down)

Learning and other resources. Elliott wave analysis provides context, not prophecy. As the 20th century semanticist Alfred Korzybski put it in his book Science and Sanity (1933), “The map is not the territory … The only usefulness of a map depends on similarity of structure between the empirical world and the map.” And I would add, in the ever-changing markets, we can judge that similarity of structure only after the fact.

See the menu page Analytical Methods for a rundown on where to go for information on Elliott wave analysis.

By Tim Bovee, Portland, Oregon, March 1, 2023

Disclaimer

Tim Bovee, Private Trader tracks the analysis and trades of a private trader for his own accounts. Nothing in this blog constitutes a recommendation to buy or sell stocks, options or any other financial instrument. The only purpose of this blog is to provide education and entertainment.

No trader is ever 100 percent successful in his or her trades. Trading in the stock and option markets is risky and uncertain. Each trader must make trading decisions for his or her own account, and take responsibility for the consequences.

License
Creative Commons License

All content on Tim Bovee, Private Trader by Timothy K. Bovee is licensed under a Creative Commons Attribution-ShareAlike 4.0 International License.

Based on a work at www.timbovee.com.
RIVN Trade

Rivian Automotive Inc. (RIVN)

Update 3/1/2023: I exited my short bull put vertical spread on RIVN, 51 days before expiration, for a $0.52 debit per contract/share, a profit before fees of $27 per contract. Shares were trading at $17.80, down $1.20 from the entry level.

The Implied Volatility Rank at exit was 50.8%, up 9.6 points from the entry level.

I exited on the day after entry because the position reached 34.2% of maximum potential profit, well above my normal exit point for earnings plays of 25%

Shares fell by 6.3% over one day for a -2,305% annual rate. The options position produced a 51.9% return for a +18,952% annual rate.


I have entered a short bear call vertical spread on RIVN, using options that trade for the last time 52 days hence, on April 21. The premium is a $0.79 credit per contract share and the stock at the time of entry was priced at $19.00.

The Implied Volatility Ratio stood at 41.2%.

Premium:$0.79Expire OTM
RIVN-bear call spreadStrikeOddsDelta
Calls
Long22.5076.0%35
Break-even20.7969.5%42.5
Short20.0063.0%50

The premium is 63.2% of the width of the position’s short/long spread. The profit zone covers a 9.4% move to the upside and an unlimited move to the downside.

The risk/reward ratio is 2.2:1, with maximum risk of $171 and maximum reward of $79 per contract.

How I chose the trade. The trade was placed to coincide with RIVN’s earnings announcement after the closing bell on the day of entry. The short strikes were set with knowledge that stock’s very short term expected move is $2.18 either way, based on options pricing, which gives a price range of $16.82 to $21.18. The Zacks Investment Research earnings surprise predictor gave RIVN a score of -7.11%, with a rank of 3(hold). The analysts’ consensus is that RIVN will announce a loss of 1.89 per share.

By Tim Bovee, Portland, Oregon, February 28, 2023

Disclaimer

Tim Bovee, Private Trader tracks the analysis and trades of a private trader for his own accounts. Nothing in this blog constitutes a recommendation to buy or sell stocks, options or any other financial instrument. The only purpose of this blog is to provide education and entertainment.

No trader is ever 100 percent successful in his or her trades. Trading in the stock and option markets is risky and uncertain. Each trader must make trading decisions for his or her own account, and take responsibility for the consequences.

License
Creative Commons License

All content on Tim Bovee, Private Trader by Timothy K. Bovee is licensed under a Creative Commons Attribution-ShareAlike 4.0 International License.

Based on a work at www.timbovee.com.

Trader’s Notebook

3:30 p.m. New York time

Half an hour before the closing bell. The S&P 500 futures spent the session in a net sideways movement, fluctuating between the 3970s and a few points above 4000. The waves discussed in this morning’s analysis continue: A small upward correction, wave 4{-12}, within a much larger downtrend, wave 3{-7}. I’ve updated the chart.

1:20 p.m. New York time

RIVN earnings play entry. I’ve entered a bear call vertical spread on RIVN, using options that trade for the last time 52 days from now, and have posted an analysis of the trade.

9:35 a.m. New York time

What’s happening now? The S&P 500 E-mini futures fell overnight to 3972.25 and then reversed, reaching 4003.75 before reversing again, back to the 3970s so far.

What does it mean? The relatively small upward correction that began February 22 continues and is in the second of three internal segments. It is part of a downtrend that began on February 2. That larger downtrend will reach below 3502 and most likely significantly below that level.,

What are the alternatives? It’s possible that a downtrending subwave of the February 2 decline, one that began on February 14, ended at the February 22 low. If that proves to be the case, then the upward correction will be larger than the principal analysis expects.

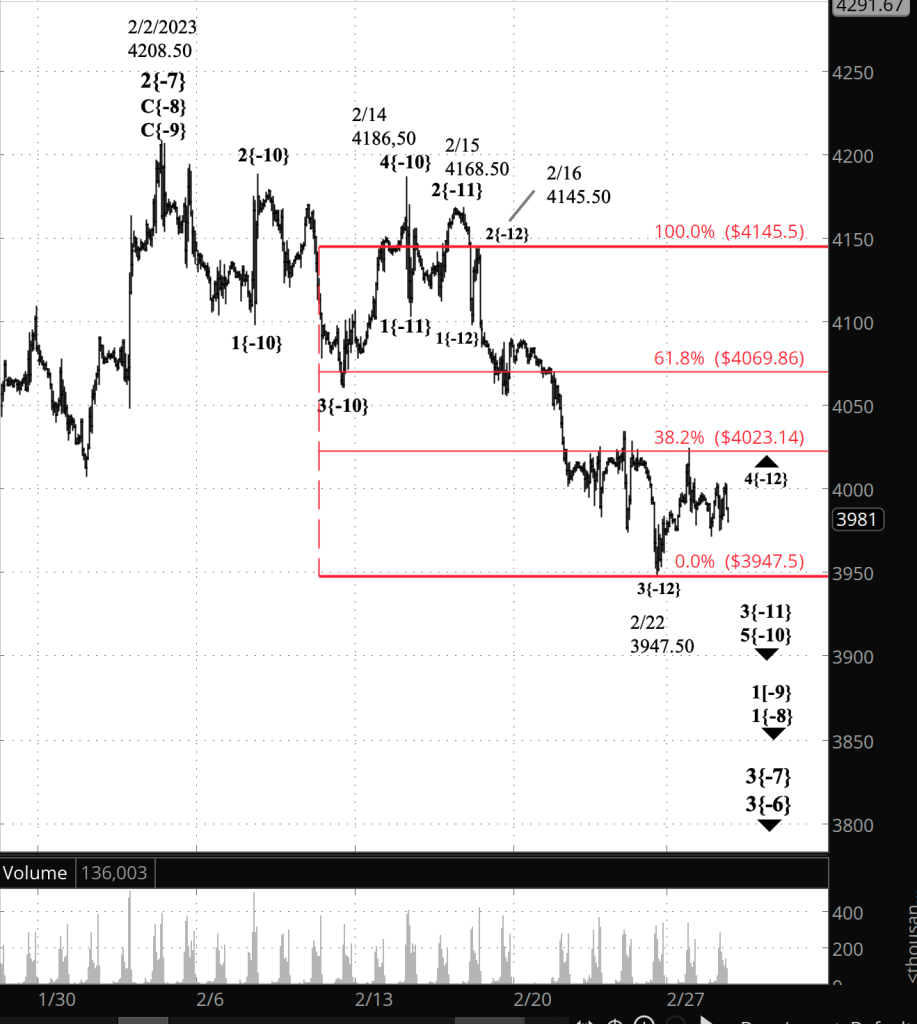
Reading the chart. I’ve superimposed a Fibonacci retracement ladder on the chart, in read, making it easier to see when the price reaches the levels that are often reversal points. So far the price has reached, and reversed from, the 38.2% retracement level, the smallest of the major levels.

The labeling system on the chart that shows the Elliott wave analysis. It is complex, a necessity given the fractal nature of stock movements. Under the labeling system, each wave — a directional price movement — has a designation — a number or letter — that shows its position within the larger structure that contains it. And each wave designation is followed by a subscript, in curly brackets, to indicate the wave’s place, its degree, within the complete fractal structure of the price movements. 

[S&P 500 E-mini futures at 3:30 p.m., hourly bars, with volume]

What does Elliott wave theory say? These are the waves that are guiding my analysis.

Principal analysis:

  • The downward correction that began on February 2, wave 3{-7}, continues.
  • It is in the first of five subwaves, wave 1{-8}.
  • Within wave 1{-8}, wave 1{-9} is underway and is in the final subwave within a five-wave structure, downtrending wave 5{-10}.
  • Wave 5{-10}, in turn, is in its middle wave, 3{-11}.
  • Wave 3{-11}’s middle wave, wave 3{-12}, ended on February 22, and the next-to-the-last wave, an upward correction, wave 4{-12}, is now underway.
  • Internally, wave 4{-12} is in its middle wave of three waves, B{-13}, which reversed downward from the 38.2% Fibonacci retracement level.
  • Wave 4{-12} will be followed by wave 5{-12}, which will mark the end of wave 3{-11}, a subwave of downtrending wave 5{-10}.
  • When wave 5{-10} is complete, it will also mark the end of wave 1{-9} and the beginning of a low-degree upward correction, wave 2{-9}.
  • Wave 3{-7} is still taking its tentative first steps and will develop into a powerful downtrend that will carry the price below 3502, the starting point of the preceding upward correction, wave 2{-7}, and most likely significantly below that level.

Alternative analysis:

The alternative makes these changes to the principal analysis.

  • The February 22 low is the end of wave 5{-12} and also the end of its parent wave, 3{-11}.
  • Wave 4{-11}, an upward correction, began on that date.

We Are Here.

These are the waves currently in progress under my principal analysis. Each line on the list shows the wave number, with the subscript in curly brackets, the traditional degree name, the starting date, the starting price of the S&P 500 E-mini futures, and the direction of the wave.

  • S&P 500 Index:
  • 5{+3} Supercycle, 7/8/1932, 4.40 (up)
  • 5{+2} Cycle, 12/9/1974, 60.96 (up)
  • 5{+1} Primary, 3/6/2009, 666.79 (up)
  • 5{0} Intermediate, 12/26/2018, 2346.58 (up)
  • S&P 500 Futures and index:
  • 4{-1} Minor, 1/4/2022, 4808.25 (down) (futures), 4818.62 (down) (index)
  • S&P 500 Futures:
  • 1{-2} Minute, 1/4/2022, 4808.25 (down)
  • 1{-3} Minuette, 1/4/2022, 4808.25 (down)
  • 1{-4} Subminuette, 1/4/2022, 4808.25 (down)
  • 1{-5} Micro, 1/4/2022, 4808.25 (down)
  • 3{-6} Submicro, 8/16/2022, 4327.50 (down)
  • 3{-7} Minuscule, 2/2/2023, 4208.50 (down)

Learning and other resources. Elliott wave analysis provides context, not prophecy. As the 20th century semanticist Alfred Korzybski put it in his book Science and Sanity (1933), “The map is not the territory … The only usefulness of a map depends on similarity of structure between the empirical world and the map.” And I would add, in the ever-changing markets, we can judge that similarity of structure only after the fact.

See the menu page Analytical Methods for a rundown on where to go for information on Elliott wave analysis.

By Tim Bovee, Portland, Oregon, February 28, 2023

Disclaimer

Tim Bovee, Private Trader tracks the analysis and trades of a private trader for his own accounts. Nothing in this blog constitutes a recommendation to buy or sell stocks, options or any other financial instrument. The only purpose of this blog is to provide education and entertainment.

No trader is ever 100 percent successful in his or her trades. Trading in the stock and option markets is risky and uncertain. Each trader must make trading decisions for his or her own account, and take responsibility for the consequences.

License
Creative Commons License

All content on Tim Bovee, Private Trader by Timothy K. Bovee is licensed under a Creative Commons Attribution-ShareAlike 4.0 International License.

Based on a work at www.timbovee.com.