Tuesday, August 18, 2020

12:35 p.m. New York time

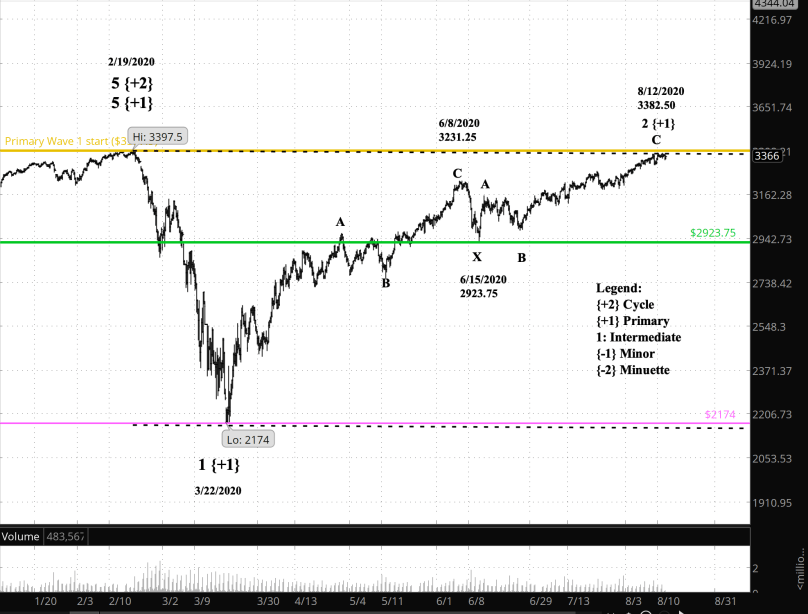
The S&P 500 index has broken above its February 19 high of 3393.52, by 1.54 points, to 3395.06. It quickly pulled back.

Screen Shot 2020-08-18 at 9.41.54 AM
S&P 500 index, 5-minute bars

In Elliott wave analysis, the 2nd wave of Primary degree has broken above the 1st wave of Primary degree. Under R.N. Elliott’s rules, if a 2nd wave breaks beyond the start of the preceding 1st wave of the same degree, it’s not a 2nd wave.

As of this writing, the S&P 500 E-mini futures have not broken above the February high, and neither has the exchange-traded fund SPY, which tracks the index.


Here are the numbers:

vehicle primary 1 start primary 2 high breakout
index 3393.52 3395.06 1.54
futures 3397.50 3390 -7.50
etf 339.08 339.07 -0.01

Things were simple when R.N. Elliott was formulating his system of analysis. Charts were daily, nothing shorter. There were no index futures or exchange-traded funds.  He analyzed the Dow Jones Industrial Average. It was the major index of his time, and there were no index futures or exchange-traded funds.

Last July I described my rule for analyzing an Elliott wave event when there is a disagreement between S&P 500 vehicles, in my post “A Funny Thing Happened“. And under that rule, the event must be unanimous. In this case, the index, futures and the exchanged-traded fund SPY must all three participate in the Elliott wave event. Otherwise, it’s too close to call.

So I’m in wait-and-see mode.

10:30 a.m. New York time

What’s happening now? The S&P 500 E-mini futures quickly ran up to a new high of 3390 at the opening bell today, 7.50 points below the start of the February crash. In the second half hour of trading it declined sharply to just above the 3370 level.

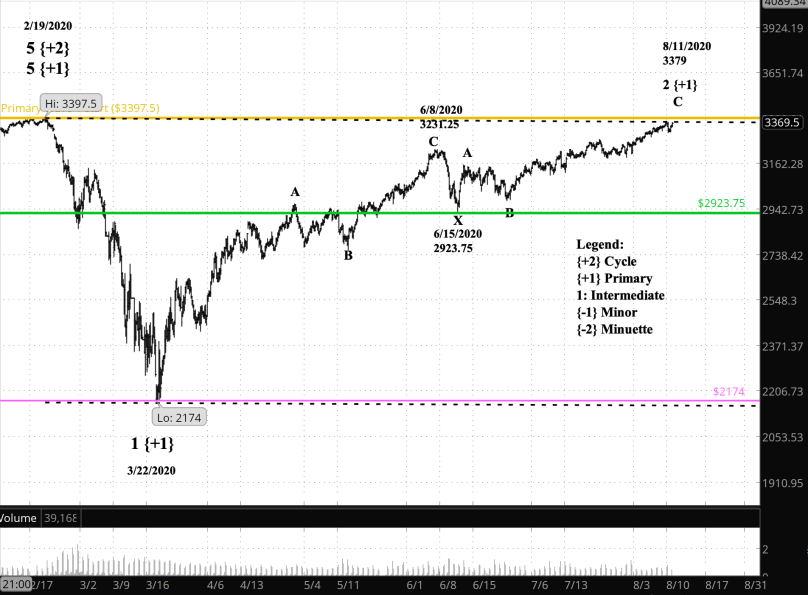
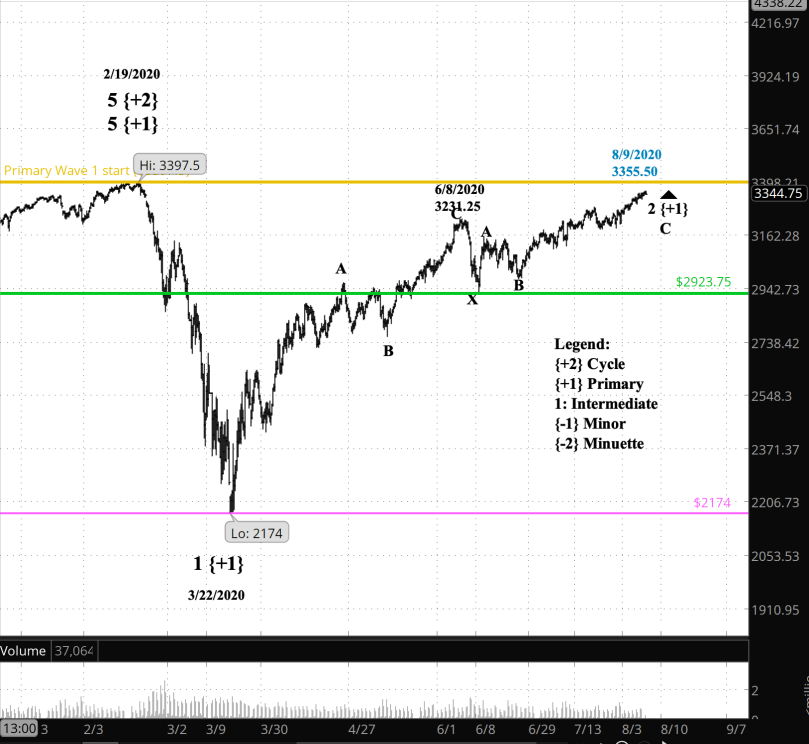
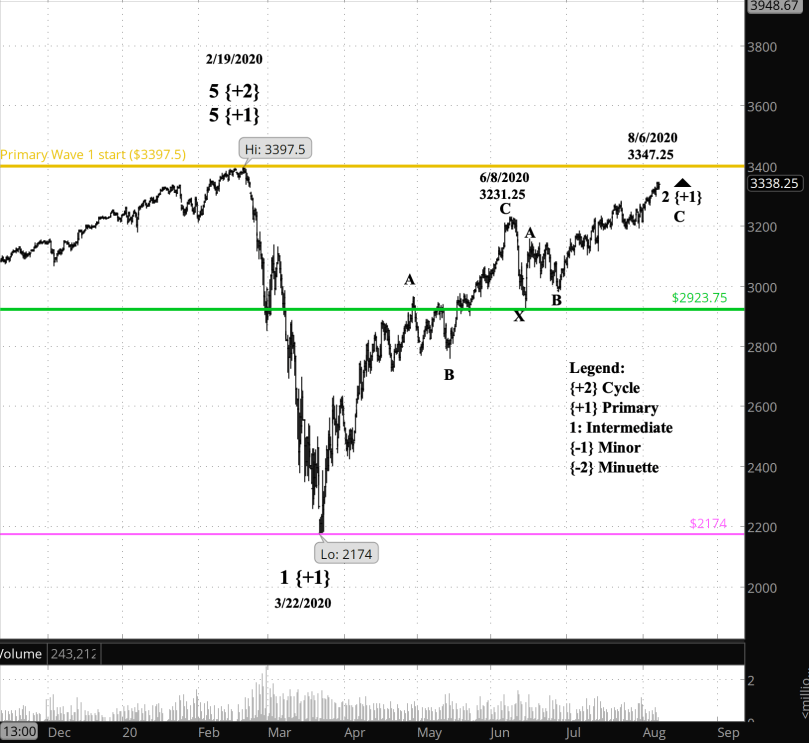
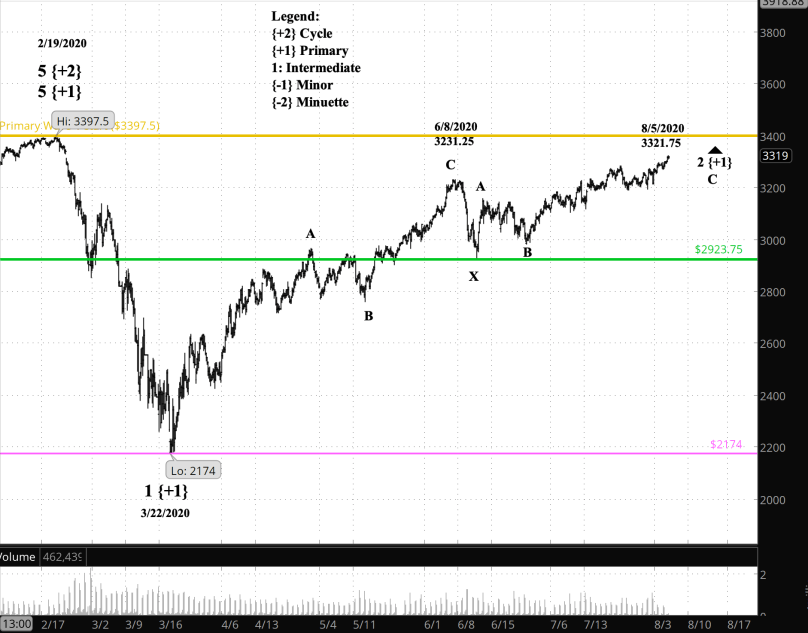
What does it mean? If it’s correct that a major downtrend began in February, and the rise since March has been correction within that downtrend, then there’s very little upside left. The start of the downtrend in February, from 3397.50, sets a ceiling on the correction. If the price bursts through that ceiling, then the February crash, rather than beginning a downtrend, was in fact a correction within an uptrend that began in 1974.

IMG_3071
S&P 500 E-mini futures, 30-minute bars

What does Elliott wave theory say? Primary wave 2, the upward correction within a Cycle wave 1 downtrend, is in its final movement — Intermediate wave C. The Minor waves within Intermediate C have completed the five-wave set.

What is the alternative? The caveat that goes with any declaration that a five-wave set is complete goes like this: Unless there’s a new high. In that case, then the Minor waves’ count gets a make-over.

The three Intermediate wave rise from June 15 began at 2923.75, and a drop below that level suggests that Primary wave 3 is indeed underway. Primary wave 2 began on March 22 at 2174, and a drop below that level means that the start of Primary wave 3 is a certainty.

What about my trades? I’m looking for Intermediate wave 3 within Primary wave 3 as my preferred trading point.

What else is interesting?  A Rand Corp. post, “What Unemployment Statistics Obscure About Temporary Layoffs“, by Kathryn A. Edwards, digs into the unemployment percentages and concludes that the temporary shutdown has morphed into a full recession. Worth a read.

About the chart. The chart is from my iPhone, since TDAmeritrade’s ThinkOrSwim app for laptops and desktops is, for the second day in a row, not working. See Downdetector to track the problem.

Read More »

Monday, August 17, 2020

9:55 a.m. New York time

What’s happening now? The S&P 500 E-mini futures with this session’s high so far, 3381, having reached a level 1.5 points below the August 11 peak, 3382.50.

What does it mean? The price remains below the upper boundary of the price channel, keeping the interpretation that  August 11 was the end of the uptrending correction that began in March and the beginning of the next leg down of a major downtrend that began in February.

IMG_3067
S&P 500 E-mini futures, 30-minute bars

What does Elliott wave theory say? The August 11 peak by my count was the end of Primary wave 2. The subsequent three days have been the early, low degree stages of Primary wave 3, which will carry the price 1,000 points or more to the downside.

What is the alternative? The net sideways movement of the last three days could be interpreted as Intermediate wave 4 within Primary 2, meaning that the upward correction may a bit further to go before it’s over.  The tip-off will be the price exceeding the August 11 peak, 3382.50

What about my trades? Holding my bear shares, delaying any options trades until Minor wave 3 within Primary wave 3.

(TDAmeritrade’s ThinkOrSwim app on my MacBook won’t launch for some reason, so the chart, from my iPhone, looks a bit different than usual.)

Read More »

Friday, August 14, 2020

10:10 a.m. New York time

What’s happening now? As the week draws to a close, the S&P 500 E-mini futures continue to bounce along the upper boundary of the price channel since February.

What does it mean? This morning was the fourth charge at the resistance level, and like the three before it, the price failed to break through. Each failed attempt strengthens the analysis that the rise since March is complete.

What does Elliott wave theory say? By my analysis, the S&P 500 peak on August 12 at 3382.50 is the end of Primary wave 2 to the upside, which began on March 22 at 2174. Primary 2 internally was divided into two Zigzag of three waves apiece, separated by an X wave.

Screen Shot 2020-08-14 at 7.09.18 AM
S&P 500 E-mini futures, 5-hour bars

At the Intermediate degree, one down from Primary, it will take a drop below the X wave terminus, at 2923.75 (green line) to reach a significant finding that the Primary wave 3 decline is truly underway. A drop below the beginning of Primary wave 2, at 2174 (purple line) would confirm that Primary wave 3 has begun. My target for Primary 3 is the lower boundary of the price channel, below 2150 and perhaps significantly below.

Primary wave 3 will play out in this manner: A tentative Intermediate wave 1 to the downside, an Intermediate wave 2 that likely will carry the price back to near its present level, and then a powerful Intermediate wave 3 push to the downside.

What is the alternative? As long as the price is bouncing along the upper boundary of the price channel, then there’s a chance that it will exceed the August 12 peak, and that high would become the new endpoint of Primary wave 2. Moreover, if the price exceeds the beginning of Primary wave 1 on February 19, at 3395.70 (gold line), then the decline that began  on that date is a continuation of Primary wave 5, which began in December 1974.

What about my trades? I’ve completed my additional purchases of shares of SDS, an exchange-traded fund based on the S&P 500, except it moves in the opposite direction. So they’re a bear play. No options trading planned yet. I’m looking to catch Intermediate wave 3 within Primary wave 3 for my bear call options spreads trades.

Read More »

Thursday, August 13, 2020

10 a.m. New York time

What’s happening now? The S&P 500 E-mini futures remain below Wednesday’s high, which in combination with Tuesday’s high has formed what traditional chart analysis calls a “double top“. In order to confirm the top, the price must next move below resistance, which lies at 3319.50 (marked in red).

What does it mean? A double top is a bearish signal, exceeded in power only by a triple top. It means that the buyers and sellers have reached a balance point. The double top suggests that the buyers at present lack the power to push the price higher.

Screen Shot 2020-08-13 at 6.57.13 AM
S&P 500 E-mini futures, 1-hour bars

What does Elliott wave theory say? The double top suggests that the rise from March 22, Primary wave 2, is on its last legs and perhaps ended on Wednesday, and the Elliott wave count — a 5th wave of Minor degree within a C wave of Intermediate degree, is consistent with the traditional analysis. The two tops have come at the upper boundary of the price channel (dotted line), which is also suggests that the double top should be taken seriously.

What is the alternative? I’ve got nothing at this point, unless the price rises above the 3397.50 level (gold line), a movement that would require a rethinking of the entire analysis since February.

What about my trades? Yesterday I bought shares of SDS, an exchange-traded fund that goes up when the S&P 500 goes down, and buy more shares today.

Read More »

Wednesday, August 12, 2020

3:30 p.m. New York time

The S&P 500 E-mini futures rose to a higher high today, 3382.50. In my analysis from this morning, that becomes the (possible) end of Primary wave 2. That level is 15 points below the beginning of Primary wave 1, from 3397.50 on February 19.

11:20 a.m. New York time

I’m dropping “Live:” from the title. Going forward, if the title is a date, it’s a live analysis of today’s market. If it has a symbol and “Analysis”, then I’m analyzing a trade. If it’s something else, then I’m talking theory or some other market topic.

What’s happening now? The S&P 500 E-mini futures on Tuesday came within 18.5 points of the pre-crash peak (gold line) on February 19,  then pulled back, and then rose again to 21.25 points below the peak. That’s the small hook on the far right.

What does it mean? Tuesday’s high, 3379, may well be the end of the upward correction that began on March 22 from 2174, and I’ve marked the chart on the assumption that the large-scale decline eventually reaching the 2100s has begun.

What does Elliott wave theory say? The trend channel links the February 19 peak and Tuesday’s high, or the start of downtrending Primary wave 1 and of Primary wave 3 (which is also the end of the uptrending Primary wave 2 correction).

The height attained by Primary wave 2 means that Primary 3 will be somewhat shallow as 3rd waves go. The price will certainly make it below the start of Primary wave 2, at 2174, but not dramatically below unless it stretches out for a great deal of time.

Screen Shot 2020-08-12 at 8.17.02 AM

The stats:

  • Primary wave 1, beginning February 19 at 3397.50, lasted for 32 days and declined by 1,223.50 points, or 36.0%.
  • Primary wave 2, beginning March 22 at 2174, lasted for 142 days and rose by 1,205 points, or 55.4%.

Compare that record to the primary waves within Cycle wave 5, which began in 1974 and ended last February. The major trend was up, unlike our present Cycle wave 1, which began in February and is downtrending.

  • Primary wave 1, beginning December 9, 1974, lasted for 12.7 years and rose by 2176.85 points, or 381.9%.
  • Primary wave 2, beginning August 25, 1987, lasted for 56 days and declined by 1130.64, or 41.2%
  • Primary wave 3, beginning October 20, 1987, lasted for 20 years and rose by 12581.59, or 778.5%

Clearly, the pre-2020 movements were orders of magnitude greater than the movements we’ve experienced since the February 19th crash, both in price and time.

It could be that my labeling of the chart is off by several degrees, although my labeling is in agreement with what the top analytical house eventually settled on. It could be that the velocity of the information flow, which drives the Zeitgeist and ultimately the trading decisions that drive the market, is so much greater now that market movements happen more quickly but are more quickly brought to halt by new information.

It’s a mystery. And as a trader, the best I can do at this point is to track the waves and trade as they dictate based on their relative positioning, regardless of the formal labeling of the degree.

What is the alternative? If the price moves above 3397.50, the start of Primary wave 1, then the Cycle wave 5 rise that began in 1974 is still underway, and what we’ve experienced since February has been a minor stumble in the market’s upward path.

What about my trades? Assuming that Primary wave 3 has begun, when should I re-enter?

Shares are easy; they never expire and time tends to heal all errors in market analysis. I’ll resume entering positions on shares of SDS, which moves the opposite of the S&P 500.

Options are trickier, because I’ve got to hit the trend precisely to avoid losses. Entry here depends upon the internal structure of Primary wave 3. And Elliott wave analysis tells us what that will be.

The first wave will carry the price down, perhaps lower than the beginning of the last X wave on June 15 at 2923.5 (green line). That point marks the beginning of the final (?) three wave movement of Intermediate degree within Primary wave 2.

But then comes Intermediate wave 2 within Primary 3, an upward correction that typically will come quite close to where we are today. It can’t move above the start of Primary wave 1, at 3379, but it can come close.

After Intermediate 2 has completed its work, then Intermediate wave 3 will move the price significantly, and that’s the wave to catch for options trades.

Elliotticians says that the best waves for trading are waves 3 and 5, and waves A and C. So for options, I think Intermediate wave 1 is a pass.

Read More »

Live: Tuesday, August 11, 2020

9:35 a.m. New York time

What’s happening now? The S&P 500 E-mini futures rose this morning before the opening bell to 18.50 points below the price, 3397.50 (gold line), at which the downtrend began on February 19. The price then retreated by about 10 points.

What does it mean? A move above 3397.50 would mean that decline into March was a correction within an uptrend, and that the uptrend has resumed.

Screen Shot 2020-08-11 at 6.30.34 AM
S&P 500 E-mini futures, 5-minute bars

What does Elliott wave theory say? Elliott wave analysis has a few rules, clear points that cannot be violated. One of them is that if a 2nd wave moves beyond the beginning of a 1st wave, then it isn’t a 2nd wave. Simple, yes?

So if the S&P 500 E-mini futures rise 18.51 above this morning’s high, the entire structure of analysis since February collapses and must be built anew.

Under my current principle count, the rise since March is Primary wave 2 of a correction that has much further to go. The movement is in its late stages: Intermediate wave C within Primary 2.

What is the alternative? If the price moves above 3397.50, then the decline from February 19 — Primary wave 1 in my principle analysis — was instead Primary waves A, B and C, the entirety of the correction, and the rise that followed is something else. My post of August 7 went into greater detail on the alternative in the event that the 3397.50 level is breached.

Which S&P 500 are we talking about? The S&P 500 is shorthand for a whole family of investment vehicles, and they don’t always move exactly in lockstep. So the futures may move above 3397.50 when the index (SPX) fails to move above that level, and the exchange-traded fund based on the index (SPY) may reach a different level relative to the February 19 peak.

All of these products are based on the index, but they are traded separately, and the index isn’t necessarily the Queen Bee of the S&P 500 hive. I discussed this matter in my post of July 16.

Before I’m willing to overthrow my principle analysis and replace it with my alternative analysis, I’m going to want to see some unanimity in the S&P 500 universe — a breaching of the February 19 high by the index, the futures, and the ETF SPY.

What about my trades? If the principle analysis survives, then I shall hang on to my bear shares (SDS) and at the onset of Primary wave 3 will add to my share holdings and also resume trading short bear call options spreads.

If the alternative analysis proves to be true, then I shall look for an exit of my shares of SDS and begin looking for an entry point for trading short bull put options spreads (or short iron condors if the market returns to a low implied volatility period).

Read More »

Live: Monday, August 10, 2020

10:50 New York time

What’s happening now? The S&P 500 E-mini futures rose to the 3355.50 level,  42 points below the start of the February crash.

What does it mean? The counter trend correction that began March 22 is on its final leg and will be followed either by a dramatic decline or a net sideways extension of the correction.

What does Elliott wave theory say? The index is close to the end of Minor wave 5 within Intermediate wave C of Primary wave 2. When Primary 2 is complete, it will be followed by a Primary wave 3 decline, eventually reaching below 2174 — the beginning of Primary 2 — and most likely significantly below that level. A drop below the beginning of the current Zigzag correction pattern, which began June 14 at 2923.75 (green line), will increase the odds that Primary wave 3 has begun. A drop below the start of the Primary 2 correction, 2174 (purple line) will confirm that the decline is underway.

Screen Shot 2020-08-10 at 7.47.03 AM
S&P 500 E-mini futures, 6-hour bars

What is the alternative? If those confirmations don’t happen, then the index will decline in an X wave — a boundary — and then embark on another three-wave correction pattern, the third of this compound correction. The price is so close to the correction’s upper boundary, 3397.50 (gold line) that any correction would likely trace a sideways pattern, known as a Flat in Elliott wave terminology. Internally, a Flat has an A wave with 3 waves within it, a B wave with 3 internal waves, and a C wave built from 5 internal waves. I used the “likely” hedge word because it’s possible that the pattern would play out as a Zigzag (5 wave, 3 waves, 5 waves), although a very shallow one.

A rise above the February 19 start of Primary wave 1, from 3397.50 (gold line), would eliminate the justification for labelling the decline from February as a downward correction of Cycle degree (the degree above Primary). Should that happen, the labelling of the chart will look very different.

What about my trades? I prefer to trade in the direction of the major trend (the whole, “The trend is my friend” thing loved by trading instructors) The trend has been down since February, so I’m waiting before resuming my options trades. I’m holding my existing bear stock positions (symbol: SDS).

Read More »

Live: Friday, August 7, 2020

10 a.m. New York time

What’s happening now? The rise in the S&P 500 E-mini futures continued overnight, pulling to within 50 points of the beginning of the Covid-19 Crash on February 19.

What does it mean? The start of the downward trend in February puts a ceiling on the analysis I’ve been using for the past six months. A move above that starting point, 3397.50, would mean that everything that has happened since February was a correction within an ongoing uptrend, rather than new major downtrend.

The difference matters for my assessment of the future course of the index.

What does Elliott wave theory say? The principle count means puts the price near the end of Primary wave 2 within the larger Cycle wave 1 to the downside. Primary wave 1 ended on March 22. Under this count, the market rise, with setbacks, since the 1930s that has marked the lives of almost everyone alive today, ended in February. We are in a downtrend of gargantuan proportions and a deep depression is settling over the world as growth slows and prosperity fades.

Screen Shot 2020-08-07 at 6.59.43 AM
S&P 500 E-mini futures, 6-hour bars

A move below 2923.75, the X wave low (green line), lends credence to the analysis that Primary wave 3 has begun. A move below 2174, the end of Primary wave 1 (purple line), confirms that Primary 3 is underway.

What is the alternative? If the price moves above 3397.50 (gold line), then we switch to the alternative count, which labels the March 22 low as the end of the correction — a Zigzag with Intermediate waves A, B and C internally, and from then until today the labelling would be tracing five waves up, a motive wave in the direction of a major uptrend within Primary wave 1 to the upside, which in turn is within a rising Cycle wave 5.

The alternative means that the rise that began in the 1930s, during the Great Depression, is still underway. The world will soon breathe a sigh of relief and prosper as our economy continues to grow.

What about my trades? I’m still holding fast to the principle count, so I’m hanging on to my bear shares (symbol: SDS) and preparing to resume trading options once Primary wave 2 is complete.

Read More »

Live: Thursday, August 6, 2020

10 a.m. New York time

What’s happening now? The rise of S&P 500 E-mini futures this week internally looks very much like the final move up before the downtrend resumes.

What does it mean? By my analysis, the main trend has been downward since February 19. The upward movement that began in March has been a countertrend correction. The resumption of the main trend will carry the price down to a significantly lower low that we’ve seen so far this year.

Screen Shot 2020-08-06 at 6.58.10 AM
S&P 500 E-mini futures, 4-hour bars

What does Elliott wave theory say? The most recent wave up within Intermediate wave C looks very much like a 5th wave extension at the Minor degree, composed of nine waves at the Minuette degree. If that is in fact what it is, then the rise is almost complete, and maybe ended at yesterday’s peak, 3329.25.

The end of wave C will almost certainly be the completion of the Primary wave 2 correction to the upside and the beginning of Primary wave 3’s powerful push to the downside.

How do I tell when it’s over? I’ve set an alert at 3191.50, the base of the 5th wave extension. When the price declines below that level, I’ll be notified. It will tell me to take a look at the chart and update my analysis.

What is the alternative? At the smaller degree, the extension may have a couple of more steps to go before it’s over. At the larger degree, Primary wave 2 could extend. It has traced a double Zigzag so far, and it could continue on to become a triple Zigzag, which would likely put off the start of Primary wave 3 for a month or more.

What about my trades? Waiting for Primary 3.

Read More »

Live: Wednesday, August 5, 2020

10 a.m. New York time

What’s happening now? The continued rise of the S&P 500 E-mini futures have lowered the odds that a significant decline has begun.

What does it mean? That downward move will be as the next major move on the chart, but not yet.

Screen Shot 2020-08-05 at 7.00.17 AM

What does Elliott wave theory say? The rise increases the likelihood that Primary wave 2 is still underway. That’s the upward correction that began March 22 from 2174 and this morning reached a new high of 3321.75. I’m promoting my alternative count to the principle count.

Within Primary 2, my count places the price in the late stages of Intermediate wave C. The end of the C wave is likely to be the end of Primary 2.

The price must remain below 3397.50 (gold line), which was the starting point of Primary wave 1 back in February. A break above that level would force a recount of the entire chart since February.

A move below the bottom of the last X wave at 2923.75 (green line), which connects patterns in a compound corrective structure, would increase the odds that Primary wave 3 has begun.

A move below 2174 (purple line), the end of Primary wave 1, would provide certainty that Primary wave 3 has begun.

What is the alternative? It’s still possible that Primary wave 3 began on June 8 from 3231.25, which is my former principle count. It’s also possible that Primary 2 is underway and will extend of a third corrective pattern; the first two were Zigzags.

What about my trades? I’m back on hold with my trades until the chart shows, as my principle count, that Primary wave 3 is has begun.

Read More »