3:30 p.m. New York time
Half an hour before the closing bell. The S&P 500 spent the day trading at about the same level it had reached at the opening bell. I’ve updated the chart below.
10:50 a.m. New York time
What’s happening now? The S&P 500 E-mini futures his a peak of 3959.25 in late trading Monday night and then began to fall, reaching 27 points below that high in the first hour after the opening bell. The peak on the index is 3950.43.
What does it mean? The decline, slight thought it is, meets the requirements for the first steps down after the rise from 3656.50 beginning January 31. If this principle scenario proves out, the price will decline significantly in the coming weeks and months, eventually reaching into the low 2000s.
What are the alternatives? But, we’ve seen this before with the S&P 500 in recent weeks: A high that has met all of the requirements for the end of the rise since January, a pullback, and then resumption of the rise to higher high. I’ve marked the chart according to the principle analysis, but I take this alternate scenario quite seriously. If the alternate proves out, then we’ll have a slight pullback, and then a push upward to a new high. What both scenarios agree on is that the rise from January 31, and indeed from February 23 of last year, when the price reversed from its low of 2191.86 on the index, and then carried up to where we are today, is in its last leg up and will be followed by a significant decline.
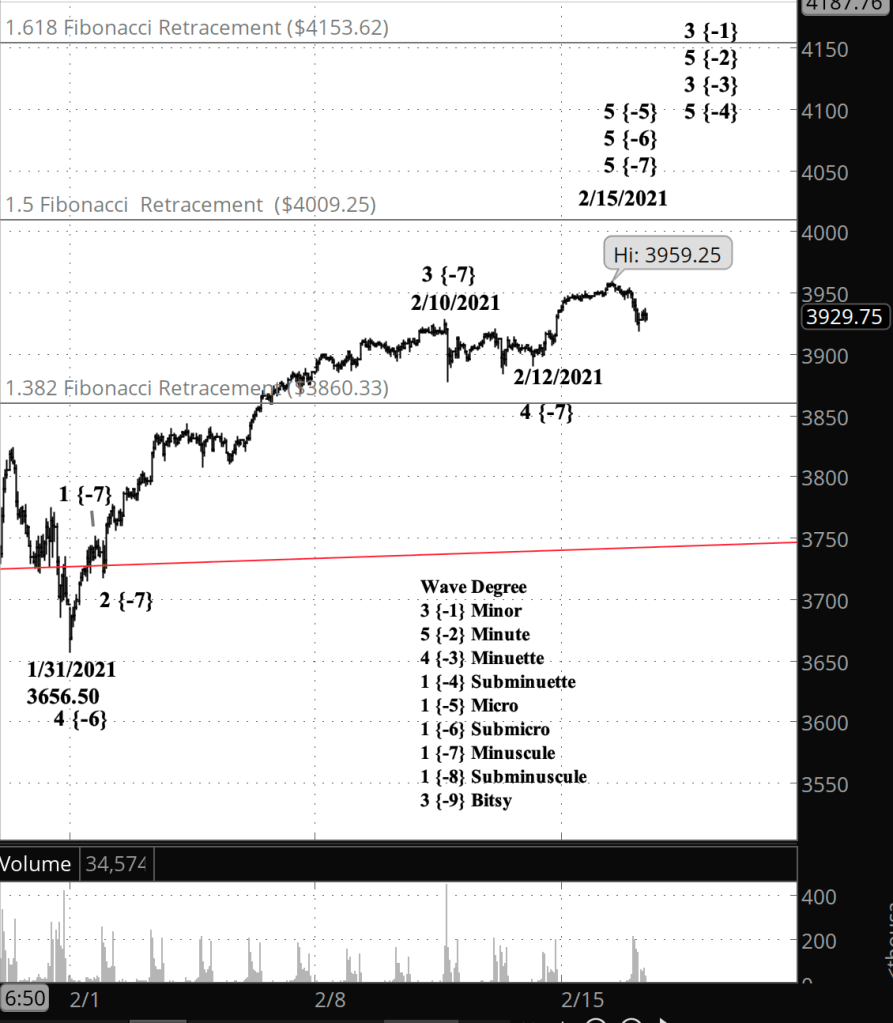
What does Elliott wave theory say? The rise from January 31 is wave 5 of Minuscule degree. I find 5th waves to be among the most ambiguous. It’s hard to call the end until the next wave is well underway. One reason is because 5th waves can extend for quite a distance before completion. Another is that a 5th wave can take a the form of a triangle rather than the standard five-wave pattern. A third reason is that if the preceding 3rd wave is longer than the 1st wave, as is normally the case, then the 5th wave has no limit in Elliott on how far it go, nor on how short it can be.
There’s a lot at stake with the end of this very low level 5th wave at the Minuscule degree, because its completion marks the end of 5th wave of larger degree, all the way up to Subminuette, the end of the 3rd wave of Minuette degree, and the end of the 3rd wave of Minor degree, that last degree having begun a year ago.
Learning and other resources. Elliott Wave International has long been the leading analytical house based on Elliott wave theory. They make available a number of free educational materials and other resources, in addition to their for-pay subscriptions.
I recommend two books, both by people associated with EWI.
First, Elliott Wave Principle by Robert Prechter and A.J. Frost is the book that, along with Prechter’s analyses, that created the revival of Elliott wave theory. I first read it in 1984, and it has had a profound influenced on my thinking about markets ever since.
Second, I’ve found Visual Guide to Elliott Wave Trading by Wayne Gorman and Jeffrey Kennedy, both of EWI, to be a useful book that relates Elliott wave theory to practical trading. The authors are hands-on Elliotticians, and for an active trader, that’s exactly what’s needed — less theory and more how-to. The first chapter of the book gives a very nice thumbnail run down of what Elliott wave theory is all about.
Terminology. Here are some links to information about some of the technical jargon I use.
Charts. On my charts, waves have a subscript showing the degree above or below the Intermediate degree. Here are the subscripts and the degree each represents:
- {+3} Supercycle
- {+2} Cycle
- {+1} Primary
- No subscript: Intermediate
- {-1} Minor
- {-2} Minute
- {-3} Minuette
- {-4} Subminuette
- {-5} Micro
- {-6} Submicro
- {-7} Minuscule
By Tim Bovee, Portland, Oregon, February 16, 2021
Disclaimer
Tim Bovee, Private Trader tracks the analysis and trades of a private trader for his own accounts. Nothing in this blog constitutes a recommendation to buy or sell stocks, options or any other financial instrument. The only purpose of this blog is to provide education and entertainment.
No trader is ever 100 percent successful in his or her trades. Trading in the stock and option markets is risky and uncertain. Each trader must make trading decisions for his or her own account, and take responsibility for the consequences.
License
All content on Tim Bovee, Private Trader by Timothy K. Bovee is licensed under a Creative Commons Attribution-ShareAlike 4.0 International License.
Based on a work at www.timbovee.com.

You must be logged in to post a comment.