3:30 p.m. New York time
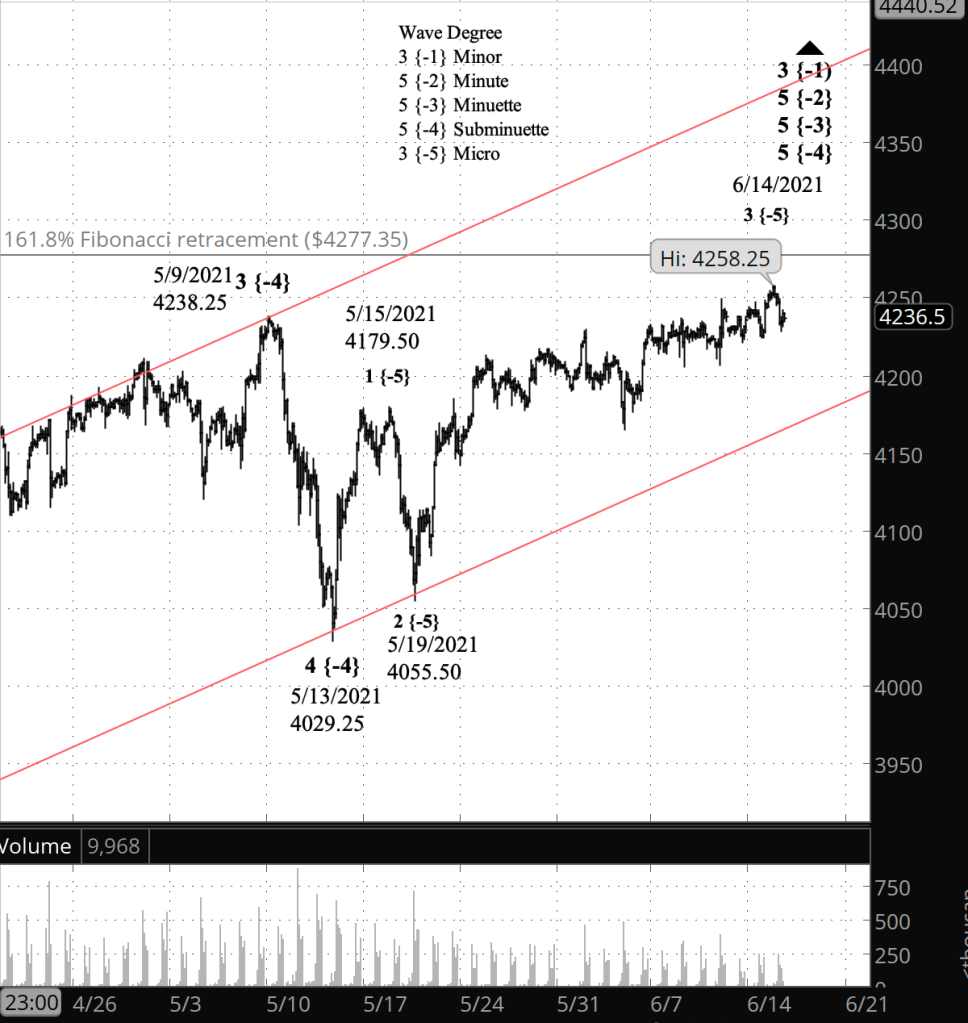
Half an hour before the closing bell. The S&P 500 continued a small decline, while remaining above the prior low. Higher highs, combined with higher low, mean that an uptrend is continuing, and that has been the pattern since the June 10 decline. No change in the analysis. Here’s an updated chart with simplified analytics.
10:05 a.m. New York time
What’s happening now? In overnight trading, the S&P 500 E-mini futures dropped off slightly in from yesterday’s high of 4238.25.
What does it mean? The pattern is a replay of what we’ve seen time and time again in the shallow coasting that began in mid-April. That the price has been in an uptrend since May 13 is clear. That the price is clearly in the third leg of its upward journey is also clear. What’s unclear is how high can it can go. I discuss the question in the Elliott wave theory section, below.
What’s the alternatives? So, two alternatives, equally likely: 1) Yesterday’s high is a pause in an ongoing rise that will reach new heights. 2) Yesterday’s high is the end of the rise and the drop-off is an early stage of a correction.
What does Elliott wave theory say? Under the continuing rise scenario the present rise is wave 3 of Micro degree within wave 5 of Subminuette degree. The question is, when does MIcro wave 3 reach its peak? And more important, when does its parent, Subminuette wave 5, reach its peak? For the end of Subminuette 5 will trigger a substantial downturn reaching all the way up to Minute degree, which is presently in its 5th wave.
I’ll tackle the Micro wave 3 problem first. Internally, Micro 3 is in its 5th wave of Submicro degree. (I haven’t marked the internal count on the chart, leaving it as an exercise for the reader.) Fifth waves, however, can cover quite a lot of ground, and so the internal count does little to set an upper limit. The take-away here is that the count gives greater weight to the continuing rise analysis.
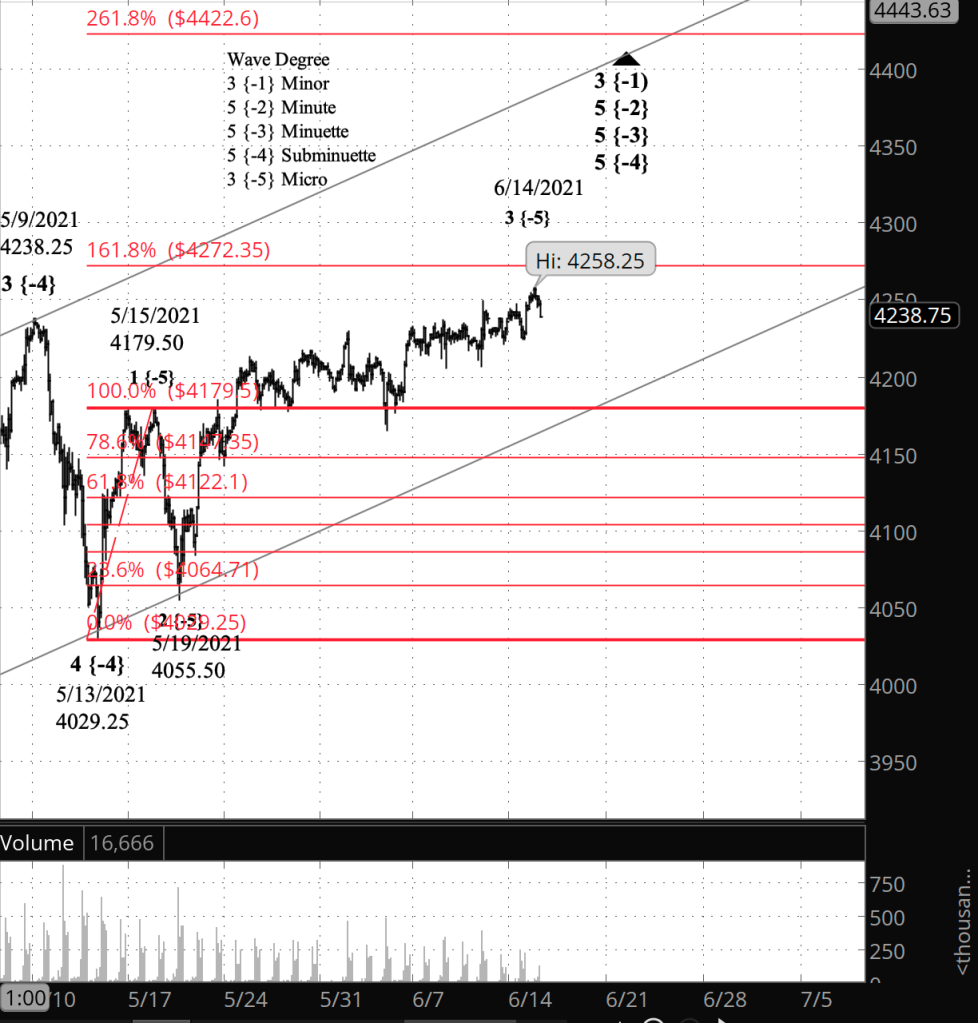
Often, a 3rd wave will have a Fibonacci retracement relation to the preceding 1st wave. (Read about Fibonacci retracements here.) I’ve placed a Fibonacci retracement ladder on the chart. At yesterday’s high of 4258.25, the price is approaching a 161.8% retracement of the ground covered by the 1st wave of Micro degree. That Fibonacci level is 4272.35, and that can stand as a reasonable end-point target for the 3rd wave of MIcro degree. Fibonacci retracements are never exact, and the prices don’t always turn at Fibonacci levels. However, if the price is does turn at the next major Fibonacci level, it will be around 4272 plus/minus a bit.
To find target for the parent, wave 5 Subminuette degree, let’s turn to the parallel gray lines on the chart. They’ve appeared in my charts for several days running, in red, and they are a price channel for wave 5 of MInuette degree, which began on March 4 from 3720.50. Under the patterns used in Elliott wave theory, wave 5 of Subminuette degree ought to end around the upper boundary of the price channel. Sometimes such rises fall short of the boundary, and sometimes they overshoot it. Nonetheless, the price channel is almost always a point that has impact on the price direction.
The price channel is uptrending, and we don’t know how long it will take the price to reach the boundary, so it’s impossible to say for sure just how high Subminuette 5 will go. But there are some indications. The preceeding Subminuette 3 took a month and half to run its course, and 3rd waves tend to be the longest part of a rise. Subminuette 5 so far has been in progress for a month and two days. So if it runs another week — still shorter than the preceding 3rd wave — it would peak around June 20, at 4400. If it equalled wave 3 in time, it would reach an end around June 27, in the 4430s.
I would not bet the farm on those targets. My experience will Elliott wave analysis has shown me that at best, a target is an educated guess. I find Elliott wave targeting to be more accurate than other methods, but as always in market analysis, nothing is 100%. Elliott wave analysis provides context, not prophecy.
Learning and other resources. See the menu page Analytical Methods for a rundown on where to go for information on Elliott wave analysis.
By Tim Bovee, Portland, Oregon, June 15, 2021
Disclaimer
Tim Bovee, Private Trader tracks the analysis and trades of a private trader for his own accounts. Nothing in this blog constitutes a recommendation to buy or sell stocks, options or any other financial instrument. The only purpose of this blog is to provide education and entertainment.
No trader is ever 100 percent successful in his or her trades. Trading in the stock and option markets is risky and uncertain. Each trader must make trading decisions for his or her own account, and take responsibility for the consequences.
License
All content on Tim Bovee, Private Trader by Timothy K. Bovee is licensed under a Creative Commons Attribution-ShareAlike 4.0 International License.
Based on a work at www.timbovee.com.

You must be logged in to post a comment.