2:45 p.m. New York time
After the FOMC announcement. The S&P 500 dropped sharply immediately after the FOMC monetary policy announcement. The decline is in line with my principle analysis from this morning, that the wave 3 of Micro degree uptrend is still in progress, and the sharp decline is a correction of smaller degree within that uptrend.
Looking at the internals of Micro wave 3, I interpret the decline to be part of the rise rather than an end to Submicro wave 3 is because of a strict rule of Elliott wave analysis: A 3rd wave cannot be the shorter than both waves 1 and 5 within the same trend. If the June 14 peak were indeed the end of wave 3, then the 3rd wave would be 78 points long and the 1st wave would be 149 points long. That’s a large difference. It would be fine if wave 5 were to be shorter than 78 degrees, but my working assumption is that wave 3 will be longer than both waves 1 and 5, and for now I’ll stick to that assumption.
It is entirely possible that subsequent price moves will prove that assumption false, requiring a change in my analysis.
I’ve updated the chart below.
9:55 a.m. New York time
What’s happening now? The S&P 500 E-mini futures continued its small uptrending pattern in overnight trading, remaining below the peak of 4258.25 set on June 14.
What does it mean? For my principle analysis I’m treating the peak as a pause on a continuing rise, with a target in the 4270s for the rise from May 19 and in the 4400s for the larger rise that began on March 4. The end of the larger rise will mark the beginning of a significant decline.
What’s the alternative? It’s possible to see 4258.25 as the end of the rise that began on May 19 and the subsequent trading below the peak as the first steps in shallow correction.
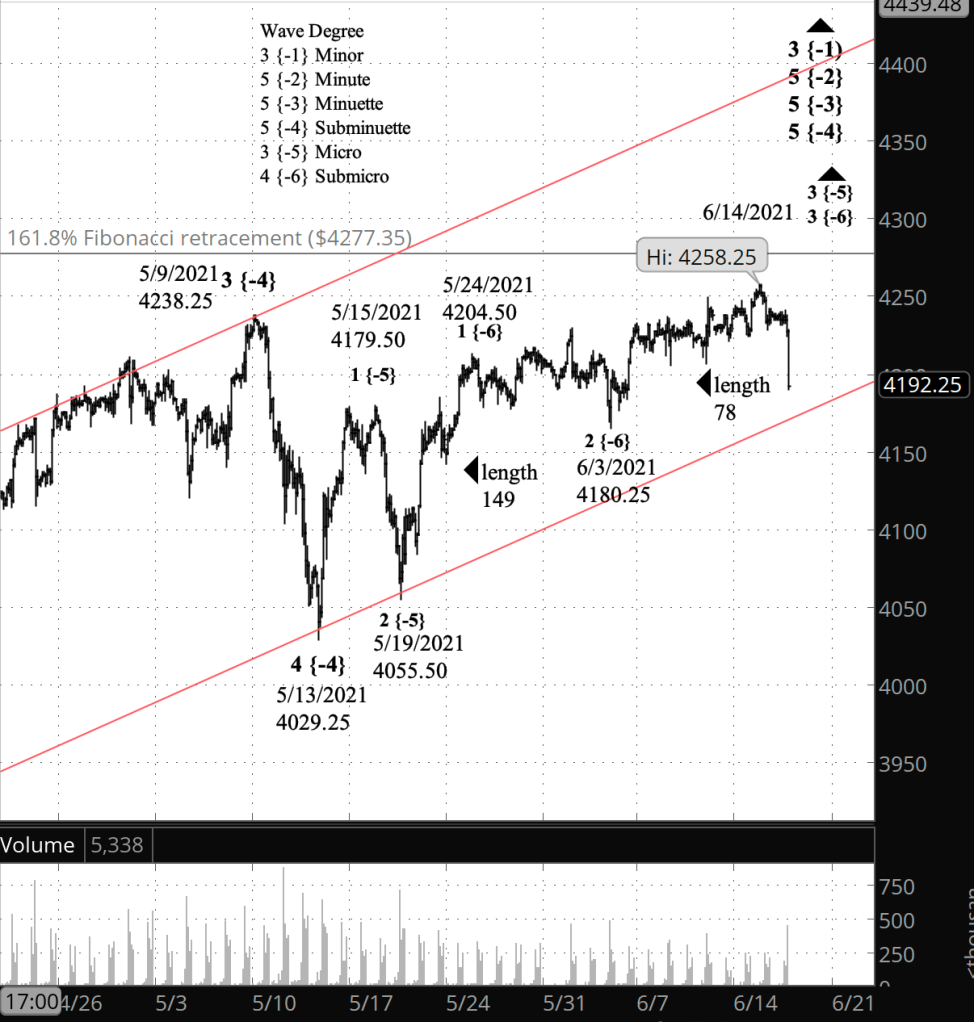
What does Elliott wave theory say? The rise that began on May 19, from 4055.50, is wave 3 of Micro degree. I’ve set the target completion at a Fibonacci level 161.8% above the beginning of the preceding wave 1 of Micro degree (dark horizontal line on the chart). Within Micro wave 3, I count the present wave as being either wave 5 of Submicro degree (the principle analysis), or wave 4 of Submicro degree (the alternative analysis).
Micro 5 is part of wave 5 of Subminuette degree, which began on May 13 from from 4029.25. I’ve used a price channel for the parent wave, 5 of Minuette degree, which began on March 4 from 3720.50 (parallel red lines). The target in a rising price channel depends upon how long it takes for the price to reach the upper boundary. By June 20, the upper boundary, and therefore the target, will be at 4400, which 165 points above the present level.
Learning and other resources. See the menu page Analytical Methods for a rundown on where to go for information on Elliott wave analysis.
By Tim Bovee, Portland, Oregon, June 16, 2021
Disclaimer
Tim Bovee, Private Trader tracks the analysis and trades of a private trader for his own accounts. Nothing in this blog constitutes a recommendation to buy or sell stocks, options or any other financial instrument. The only purpose of this blog is to provide education and entertainment.
No trader is ever 100 percent successful in his or her trades. Trading in the stock and option markets is risky and uncertain. Each trader must make trading decisions for his or her own account, and take responsibility for the consequences.
License
All content on Tim Bovee, Private Trader by Timothy K. Bovee is licensed under a Creative Commons Attribution-ShareAlike 4.0 International License.
Based on a work at www.timbovee.com.

You must be logged in to post a comment.