3:30 p.m. New York time
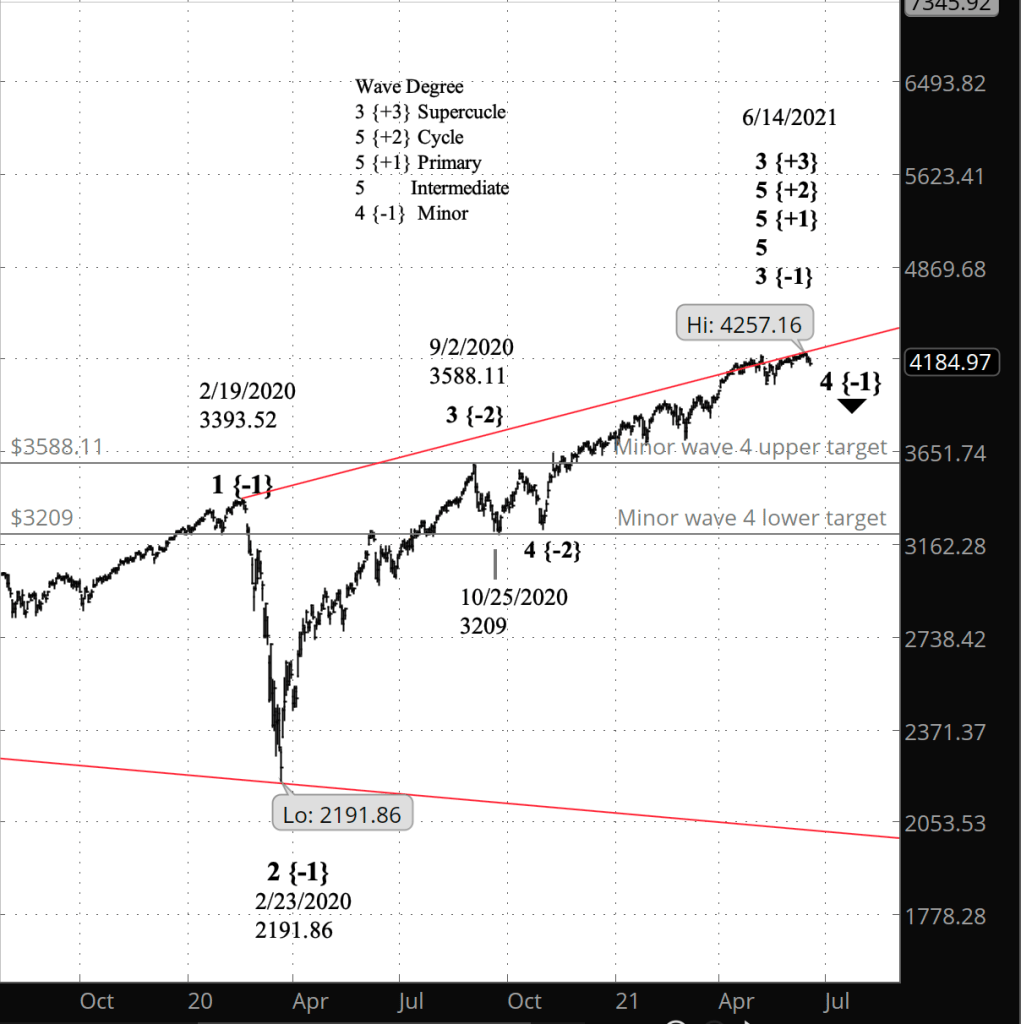
Half an hour before the closing bell. The S&P 500 continued to work its way lower, down to 4161 so far today on the futures. No change in the analysis. I’ve updated the short-term chart. I’ve also updated the long-term chart, adding in the upper and lower boundaries of wave 4 of Minute degree, the target range for for the Minor wave 4 correction that began on June 14.
10:30 a.m. New York time
Added. I’ve added a longer-term chart to the Elliott wave analysis section below.
10:20 a.m. New York time
What’s happening now? The S&P 500 E-mini futures fell in overnight trading and past the opening bell, reaching as low so far as 4170.50.
What does it mean? I had said in an earlier analysis that a decline below 4180.25, the low on June 3 that marked the beginning of an upward push, would make it less likely that the decline from the June 14 peak is a correction within an ongoing uptrend. My revised principle analysis labels the June 14 peak of 4258.25 as the end of the rise that began May 13 and the beginning of a new downtrend.
What’s the alternative? It’s possible that the uptrend that began May 13 is still underway, although at this point I’m uncertain how it could be counted. If the price rises back above the June 14 peak, then this alternative will become the principle analysis.
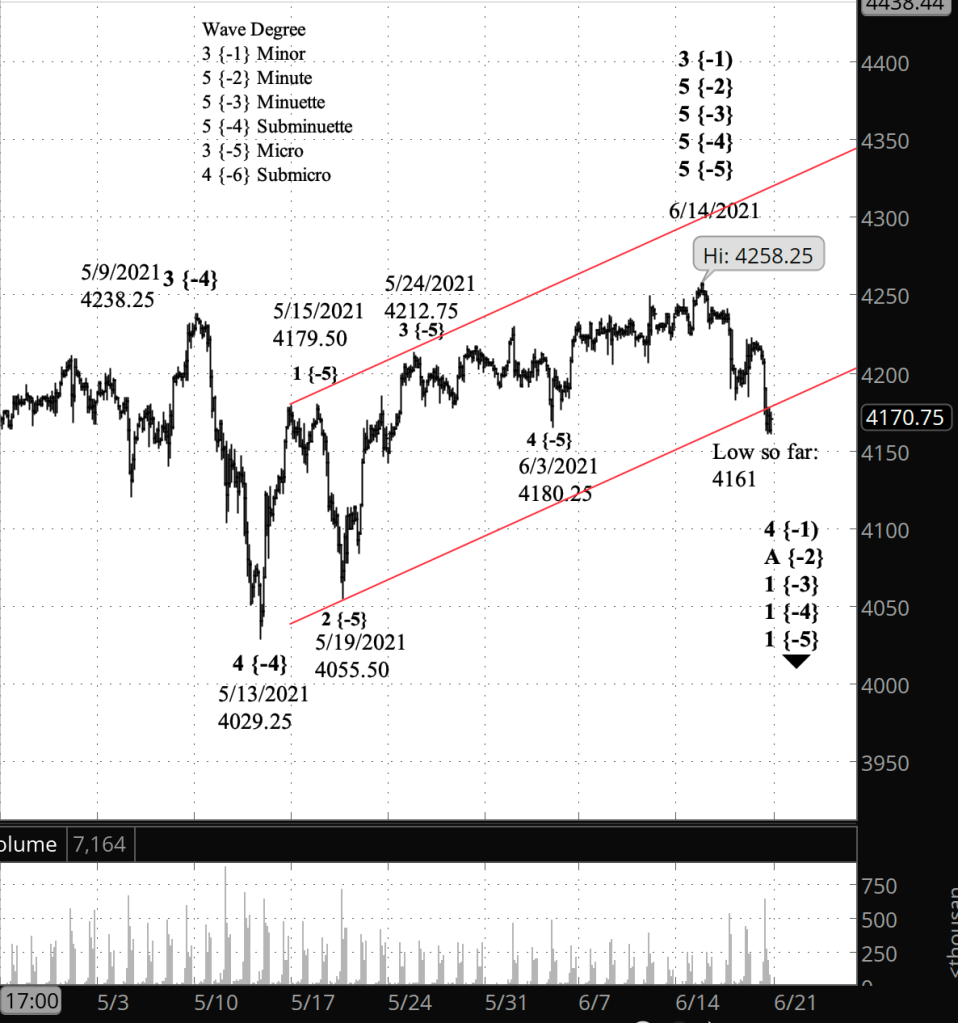
What does Elliott wave theory say? Under my principle analysis, the June 14 peak, ending wave 5 of Micro degree, is also the end of a series of 5th waves of greater degree, up three levels to wave 5 of Minute degree, which in turn marks the end of wave 3 of Minor degree, which began on February 23, 2020 — the end of the crash that marked the beginning of the pandemic.
I’ve redrawn the price channel for wave 5 of Subminuette degree. It shows the final internal wave, the 5th of Micro degree, failing to come close to the upper boundary of the channel. It’s not a truncated wave, since it moved beyond the peak of wave 3, but it’s not typical of 5th waves that I’ve seen.
With wave 3 of Minor degree having reached an end, the next move will be a large-degree 4th wave correction. Fourth waves tend to be on the shallow side, taking the form of a Flat, although not always, and often will extend in compound patterns, linking several corrective forms together, although not always. A 4th wave never moves beyond the end of the preceding wave 1, which is 2191.86 on the index. So that’s an absolute floor on the coming decline, and I expect it to end well above that level. A 4th wave will often end within the range of subwave 4 of the preceding 3rd wave, which would be between 3588 and 3209 on the index, a range set by wave 4 of Minute degree last October.
Learning and other resources. See the menu page Analytical Methods for a rundown on where to go for information on Elliott wave analysis.
By Tim Bovee, Portland, Oregon, June 18, 2021
Disclaimer
Tim Bovee, Private Trader tracks the analysis and trades of a private trader for his own accounts. Nothing in this blog constitutes a recommendation to buy or sell stocks, options or any other financial instrument. The only purpose of this blog is to provide education and entertainment.
No trader is ever 100 percent successful in his or her trades. Trading in the stock and option markets is risky and uncertain. Each trader must make trading decisions for his or her own account, and take responsibility for the consequences.
License
All content on Tim Bovee, Private Trader by Timothy K. Bovee is licensed under a Creative Commons Attribution-ShareAlike 4.0 International License.
Based on a work at www.timbovee.com.

You must be logged in to post a comment.