3:30 p.m. New York time
Half an hour before the closing bell. The S&P 500 continues its rise during the trading day, reaching just above a 61.8% Fibonacci retracement of the fall from June 14 to June 20. This morning’s pause at the 38.2% retracement level was so slight that I’m reluctant to call it the end of wave A and the start of wave B of the Submicro degree. It just doesn’t fit the rule of proportionality in Elliott wave theory. So I’ve counted the full rise so far as wave A, and I anticipate that it will be followed by a wave B decline and then a final push up as wave C.
9:40 a.m. New York time
What’s happening now? The S&P 500 E-mini futures reached a low of 4126.75 in overnight trading and then reversed to the upside, retracing 38% of the decline that began June 14.
What does it mean? The reversal marks the completion of the first leg in what will develop into a significant downtrend, and the upward move overnight is a small correction within that downtrend.
What’s the alternative? My principle analysis counts the high of June 14 as the end of an uptrend that began on February 28, 2020. It’s possible that the uptrend is still ongoing, and the proof of that would be the price continuing to rise from its present level, exceeding the mid-June peak of 4258.25.
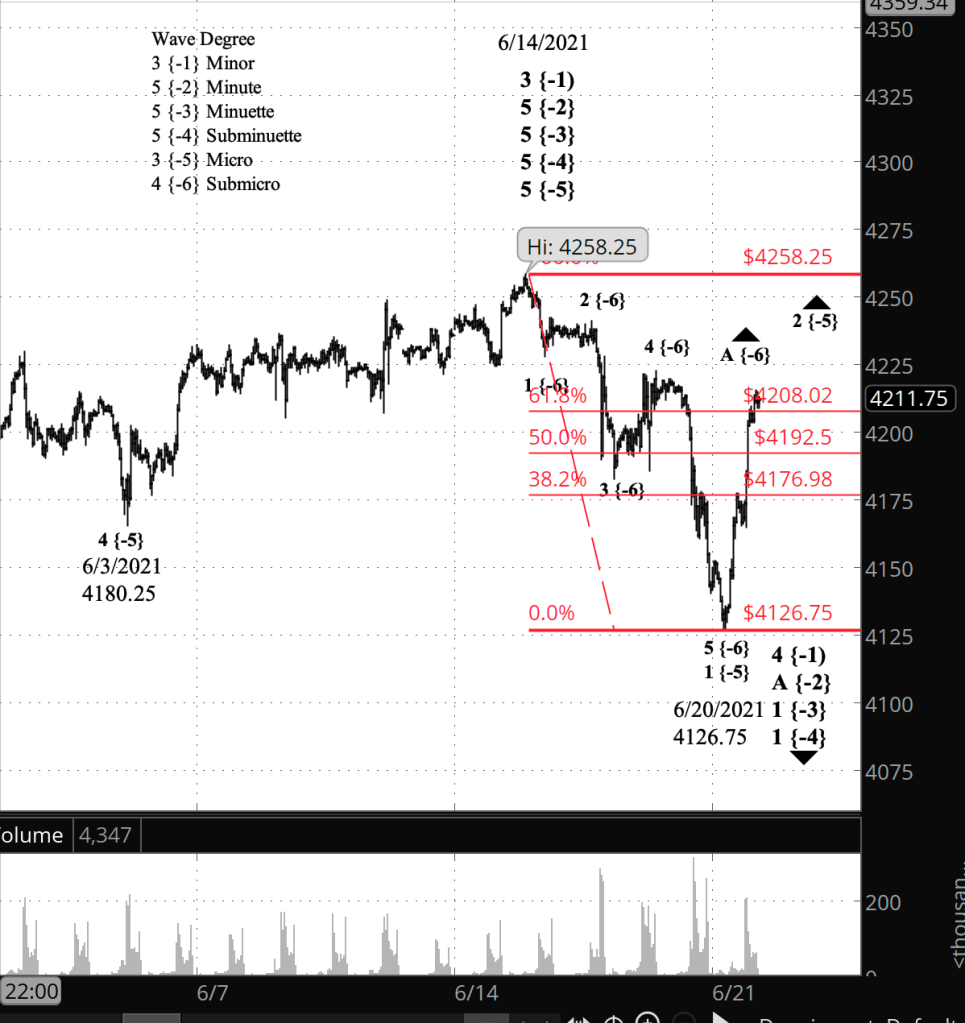
What does Elliott wave theory say? The overnight rise paused at a 38.2% Fibonacci retracement level as it takes back part of the decline that began on June 14, which is wave 1 of Submicro degree within wave 1 of Micro degree, the early stages of a downtrend stretching all the up to Minute degree. The entire downtrend is occurring within wave A of Minute degree within wave 4 of Minor degree.
The overnight rise is wave 2 of Submicro degree within wave 1 of Micro degree. In my experience 2nd waves tend to take the form of a Zigzag, a markedly directional three-wave structure. The pause at the 38.2% Fibonacci level may mark the end of wave A of Submicro degree, although not necessarily. The next move in a Zigzag is a decline that stays above the beginning of wave A, which is 4126.75 in this case, and then a wave C reversal to high highs. The 61.8% Fibonacci level (4208.02) would be a not uncommon end point for wave C, but it could very well go higher, or run out of steam before reaching that level, perhaps at the 50% fibonacci level (4192.50).
Under the alternative analysis, wave 5 of Micro degree didn’t end on June 14 and still underway, with the decline from that date being an A wave within a downward correction. One aspect of the chart that makes this conceivable is the weakness of the Micro wave 5 rise from June 3 to the June 14 peak. It counts as a 5th wave completion, but it doesn’t feel that way, intuitively.
Learning and other resources. See the menu page Analytical Methods for a rundown on where to go for information on Elliott wave analysis.
By Tim Bovee, Portland, Oregon, June 21, 2021
Disclaimer
Tim Bovee, Private Trader tracks the analysis and trades of a private trader for his own accounts. Nothing in this blog constitutes a recommendation to buy or sell stocks, options or any other financial instrument. The only purpose of this blog is to provide education and entertainment.
No trader is ever 100 percent successful in his or her trades. Trading in the stock and option markets is risky and uncertain. Each trader must make trading decisions for his or her own account, and take responsibility for the consequences.
License
All content on Tim Bovee, Private Trader by Timothy K. Bovee is licensed under a Creative Commons Attribution-ShareAlike 4.0 International License.
Based on a work at www.timbovee.com.

You must be logged in to post a comment.