3:30 p.m. New York time
Half an hour before the closing bell. The S&P 500 stayed below its early high today of 4248.25 on the futures, 4256.60 on the index, which kept the price below the June 14 high of 4258.25 on the futures, 4257.16 on the index. The analysis is unchanged. I’ve updated the chart.
9:40 a.m. New York time
What’s happening now? The S&P 500 E-mini futures in overnight trading rose to 4248.25 and then reversed slightly.
What does it mean? The overnight high is 10 points below the June 14 peak of 4258.25. By my principle analysis, the rise from June 20 is the middle portion of an upward correction that will be followed by a resumption of the larger downtrend, as long as the price remains at or below the June 14 peak.
What’s the alternative? If the price exceeds the June 14 peak, then the uptrend that began in February 2020, after the early pandemic crash, is still underway, and the decline from that date to June 20 was a correction within that uptrend.
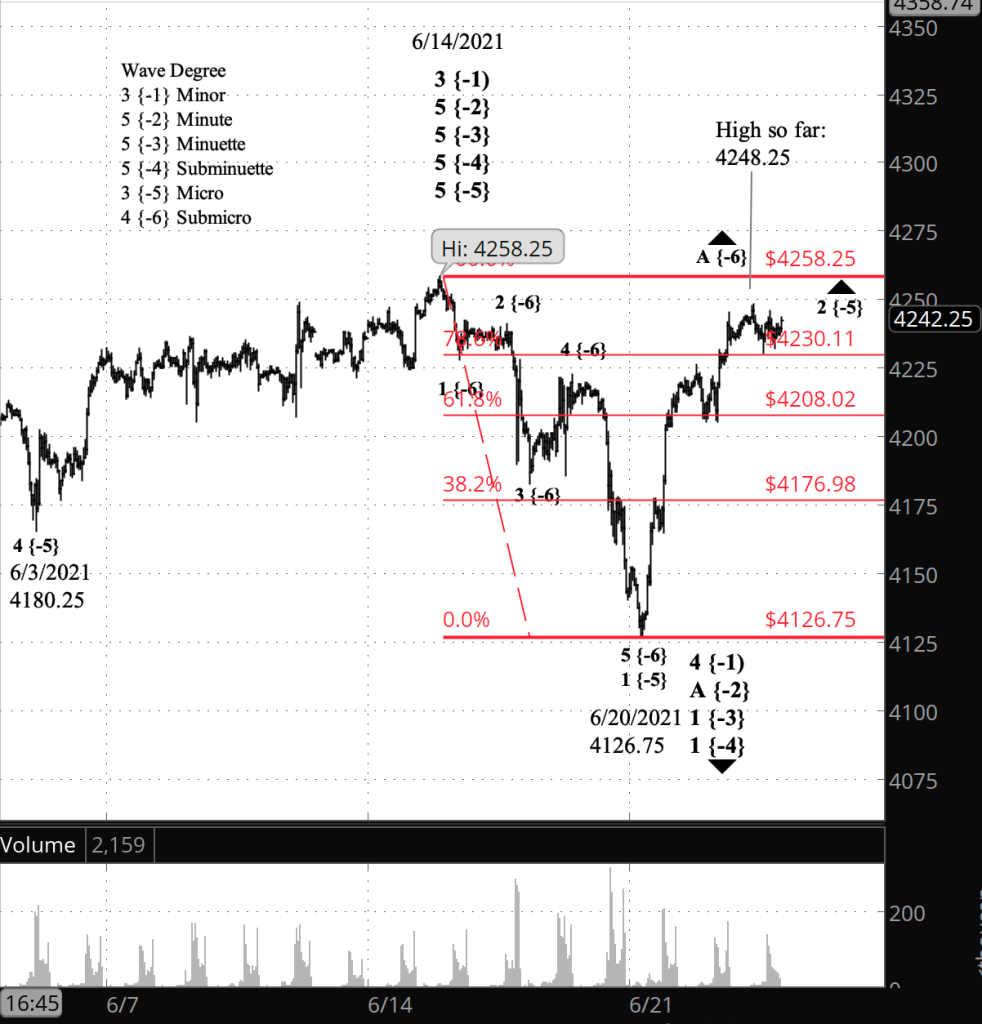
What does Elliott wave theory say? Following the overnight high, which is wave A of Submicro degree within wave 2 of Micro degree under the principle analysis, the price reversed, dropping back to the 78.6% Fibonacci retracement level. Under the Elliott rules, a 2nd wave can’t move beyond the start of the preceding 1st wave, and a move above the June 14 high would violate that rule, requiring a re-analysis.
That being the case, wave A has only 10 more points of upward potential and will be followed by a B wave to the downside and then a final C wave to the upside, which will be the completion of the parent wave 2 and the beginning of an energetic wave 3 to the downside, which will reach below the June 20 minimum of 4126.75, and perhaps significantly below.
If the price exceeds 4258.25, the June 14 peak, then the alternative count kicks in. Under the alternative, the decline from June 14 to June 20 is a corrective wave with three subwaves, and the rise since June 20 is a subwave of wave 5 of Micro degree, which began on June 3 from 4180.25. This scenario has an unknown amount of upward potential. It could be quite a bit, or maybe not so much.
Learning and other resources. See the menu page Analytical Methods for a rundown on where to go for information on Elliott wave analysis.
By Tim Bovee, Portland, Oregon, June 23, 2021
Disclaimer
Tim Bovee, Private Trader tracks the analysis and trades of a private trader for his own accounts. Nothing in this blog constitutes a recommendation to buy or sell stocks, options or any other financial instrument. The only purpose of this blog is to provide education and entertainment.
No trader is ever 100 percent successful in his or her trades. Trading in the stock and option markets is risky and uncertain. Each trader must make trading decisions for his or her own account, and take responsibility for the consequences.
License
All content on Tim Bovee, Private Trader by Timothy K. Bovee is licensed under a Creative Commons Attribution-ShareAlike 4.0 International License.
Based on a work at www.timbovee.com.

You must be logged in to post a comment.