Note: Just as I posted the price of the index moved above the June 14 high. I reworked analysis entirely and posted a new analysis. This analysis is no longer valid, having been overtaken by events. I’m leaving it up for comparison with the new analysis.
9:45 a.m. New York time
What’s happening now? The S&P 500 E-mini futures, in the rise that began on June 20, reached a new high shortly after the opening bell.. That level is at the all-time high of 4258.25, set on June 14. The S&P 500 index exceeded the June 14 high, creating a discrepancy between the two products.
What does it mean, #1? As long as the price remains at or below the June 14 high, my principle analysis is that the S&P 500 futures in an upward correction within a larger downtrend. The longer term expectation is for prices to fall significantly. Talk about hanging by a thread! This analysis is one penny away from being replaced by the alternative.
What does it mean, #2? If the price moves above the June 14 high, then the decline that began on June 14 was a correction within an ongoing uptrend, and the rise that began on June 20 is a resumption of the uptrend after the correction. The longer term expectation is for prices to rise, with no way to tell how high they hight go.
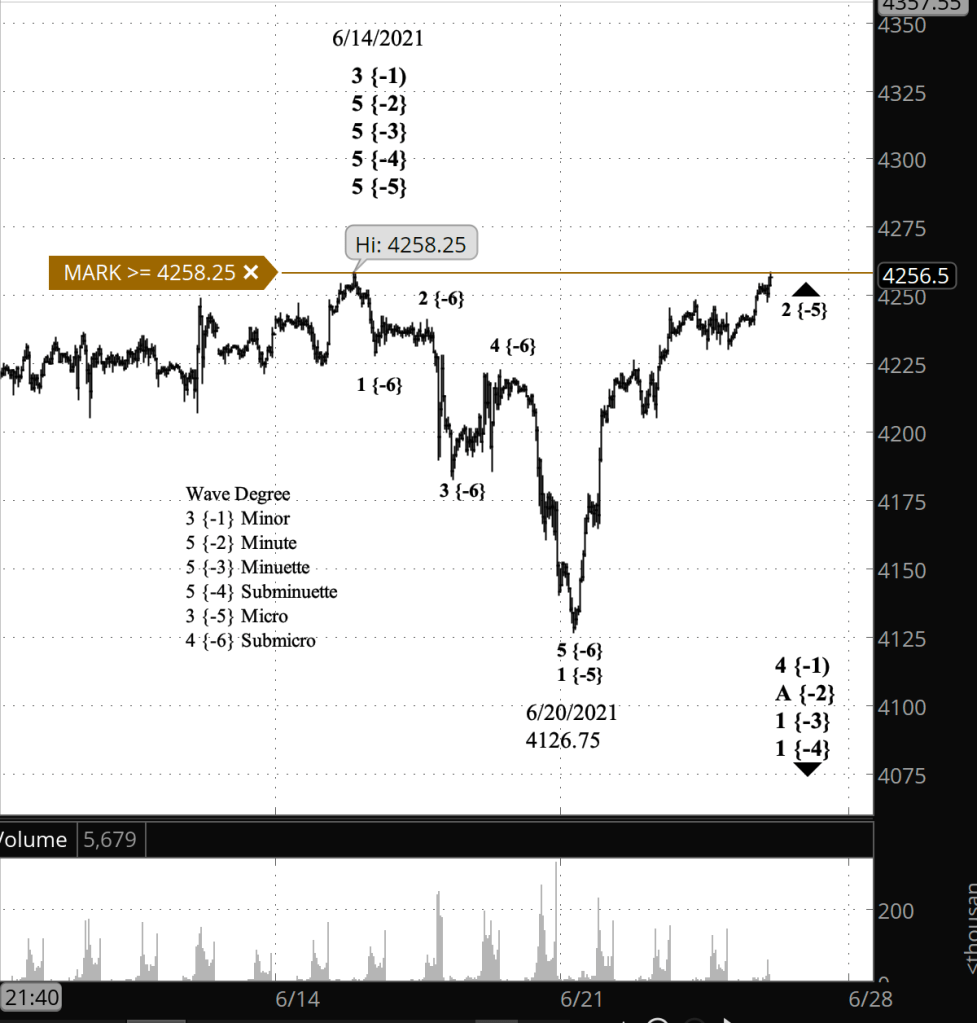
What does Elliott wave theory say? Principle analysis: Wave 2 of Micro degree is underway. I had counted it internally as wave A of Submicro degree within wave 2, but with no room between the wave 2 high and the June 14 peak, I don’t see how the A label can be correct. There’s just not enough space for a future C wave. Under this analysis, the June 14 peak ended a long-running uptrend all the way up to Minute degree.
If the price moves above the June 14 peak, then the rise from June 20 cannot be wave 2, because under the rules of Elliott wave theory, a 2nd wave cannot move beyond the start of the preceding wave 1. A move beyond that peak would mean that the June 14 peak was the start of a small correction within wave 5 of Minute degree and its child waves.
Learning and other resources. See the menu page Analytical Methods for a rundown on where to go for information on Elliott wave analysis.
By Tim Bovee, Portland, Oregon, June 24, 2021
Disclaimer
Tim Bovee, Private Trader tracks the analysis and trades of a private trader for his own accounts. Nothing in this blog constitutes a recommendation to buy or sell stocks, options or any other financial instrument. The only purpose of this blog is to provide education and entertainment.
No trader is ever 100 percent successful in his or her trades. Trading in the stock and option markets is risky and uncertain. Each trader must make trading decisions for his or her own account, and take responsibility for the consequences.
License
All content on Tim Bovee, Private Trader by Timothy K. Bovee is licensed under a Creative Commons Attribution-ShareAlike 4.0 International License.
Based on a work at www.timbovee.com.

[…] This replaces the analysis posted at 9:45 a.m., which was outdated by events shortly after the opening […]
LikeLike