3:30 p.m. New York time
Half an hour before the closing bell. The S&P 500 rose slightly from this morning’s high, to 4260.75 on the futures.
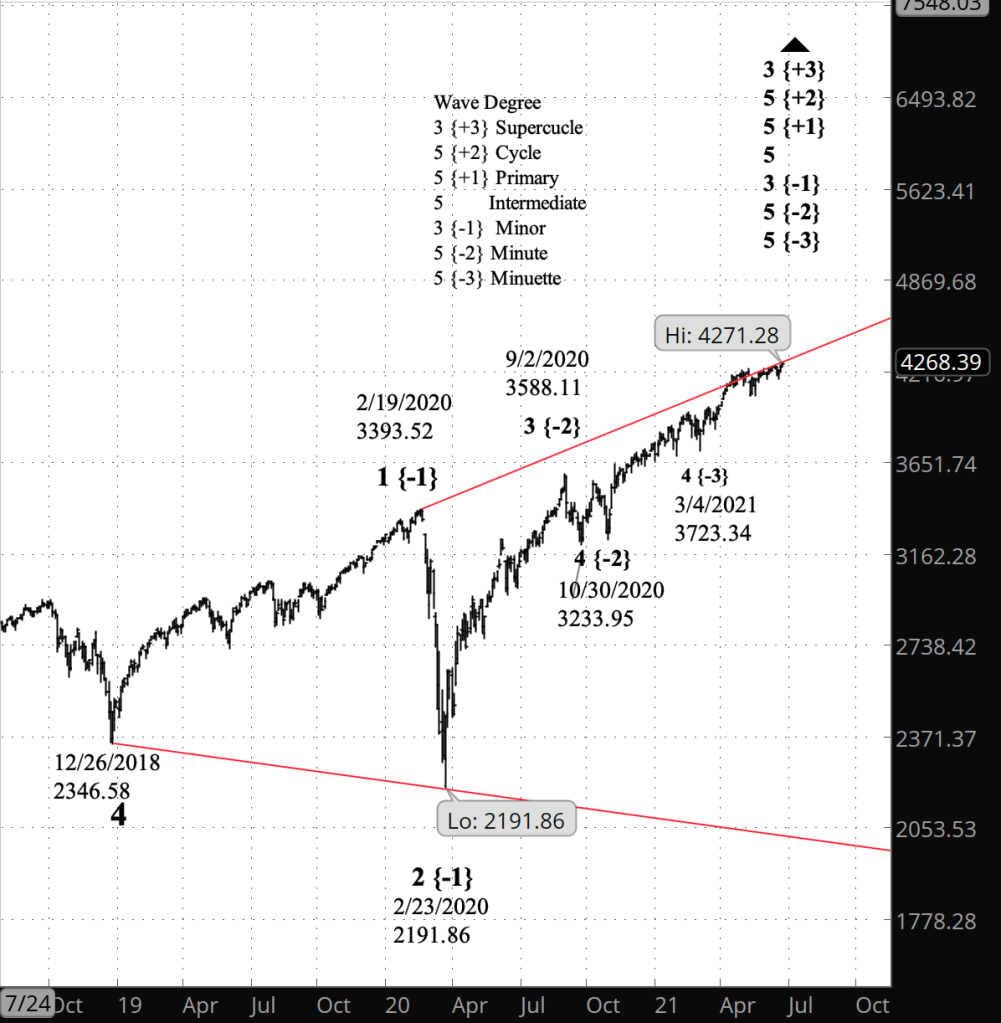
For perspective, here is a longer-term chart, tracing the entirety of the expanding diagonal triangle that marks the form taken by the S&P 500 during wave 5 of Intermediate degree since it began on December 26, 2018 from 2346.58.
The present rise, wave 3 of Minor degree, began on February 23, 2020 from 2191.86, the end of the 2nd wave crash early in the pandemic. Within Minor 3, wave 5 of Minuette degree — two degrees below Minor — began its rise on March 4, 2021 from 3723.40.
With an expanding triangle, we can expect a significant decline after the present wave 3 of Minor degree completes its rise. The decline ideally will reach the lower boundary of the triangle, which is presently around 2040 and declining further each day.
10:30 a.m. New York time
Note: This replaces the analysis posted at 9:45 a.m., which was outdated by events shortly after the opening bell.
What’s happening now? The S&P 500 index moved above its high of June 14, to a new all-time high of 4270.53, extending the rise that began in February 2020, after the crash early in the pandemic. The E-mini futures exceeded its high of Juen 14, reaching a higher high of 4260.25 so far.
What does it mean? The index high means that the prior principle analysis gets tossed out the window and is replaced by the former alternative analysis.
The new principle analysis: The rise of May 13 to June 14 was the middle movement within a larger uptrend that began on May 13. It was followed by a correction, and the final movement within the larger uptrend has begun. I expect it to continue to rise into the 4400s, perhaps, and it could go higher. See the “Elliott wave theory” section below for a discussion.
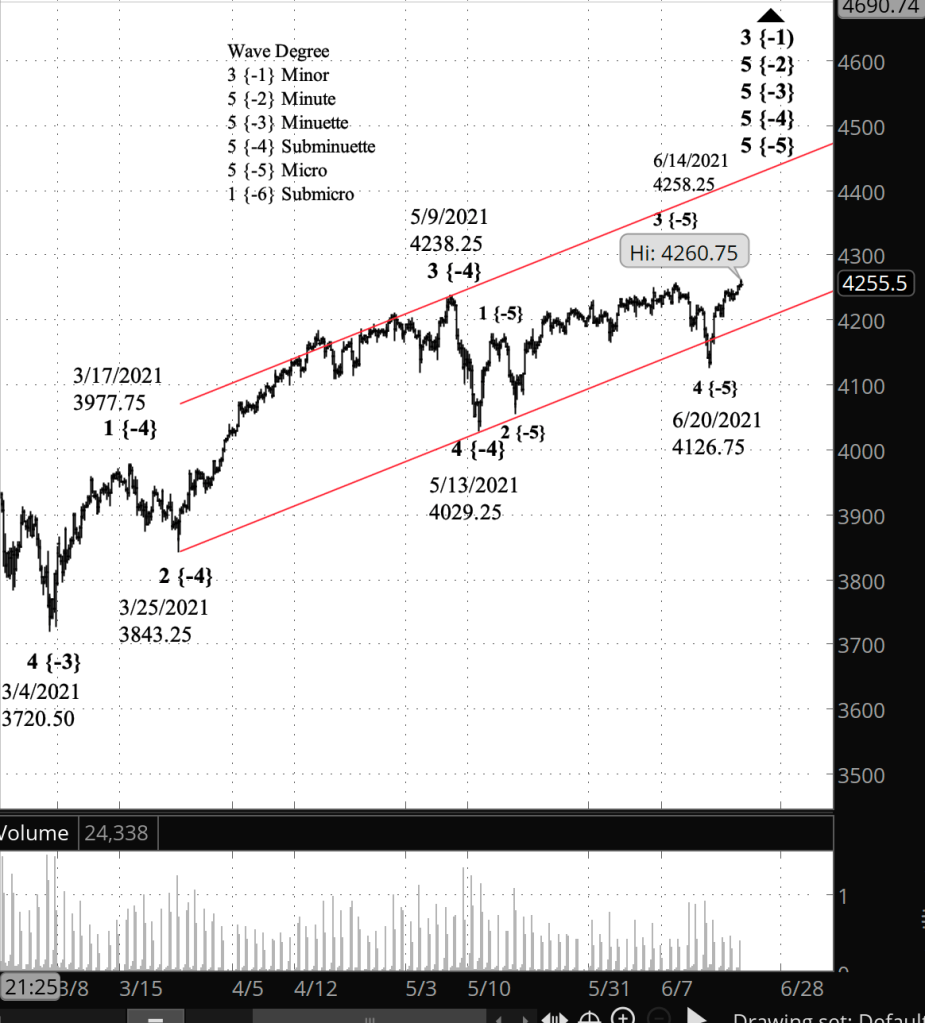
What does Elliott wave theory say? Wave 5 of Subminuette degree began on May 13 from 4029.25, and the present rise, from June 20, is the wave 5 of Micro degree, a child wave of the Subminuette. The decline from June 14 to June 20 was wave 4 of Micro degree. This is all happening within the parent, wave 5 of Minuette degree, which began on March 4 from 3720.50
So how much upside is there in the present Micro 5 rise? Elliott wave theory has few rules the how far a 5th wave can go. Some are short. Some extend far beyond all reasonable expectations. A price channel for the parent wave 5 of Minuette degree can provide some guidance. I’ve drawn it to connect the beginnings of waves 3 and 5 of Subminuette degree, with a parallel wave touching the end of wave 1 of Subminuette degree. If the rise reached the upper boundary on July 5, for example, the price would be in the 4460s. The sooner the price reaches the boundary, the lower the target. The longer it takes to get there, the higher the target.
Learning and other resources. See the menu page Analytical Methods for a rundown on where to go for information on Elliott wave analysis.
By Tim Bovee, Portland, Oregon, June 24, 2021
Disclaimer
Tim Bovee, Private Trader tracks the analysis and trades of a private trader for his own accounts. Nothing in this blog constitutes a recommendation to buy or sell stocks, options or any other financial instrument. The only purpose of this blog is to provide education and entertainment.
No trader is ever 100 percent successful in his or her trades. Trading in the stock and option markets is risky and uncertain. Each trader must make trading decisions for his or her own account, and take responsibility for the consequences.
License
All content on Tim Bovee, Private Trader by Timothy K. Bovee is licensed under a Creative Commons Attribution-ShareAlike 4.0 International License.
Based on a work at www.timbovee.com.

[…] the price of the index moved above the June 14 high. I reworked analysis entirely and posted a new analysis. This analysis is no longer valid, having been overtaken by events. I’m leaving it up for […]
LikeLike