Trader’s Notebook

3:30 p.m. New York time

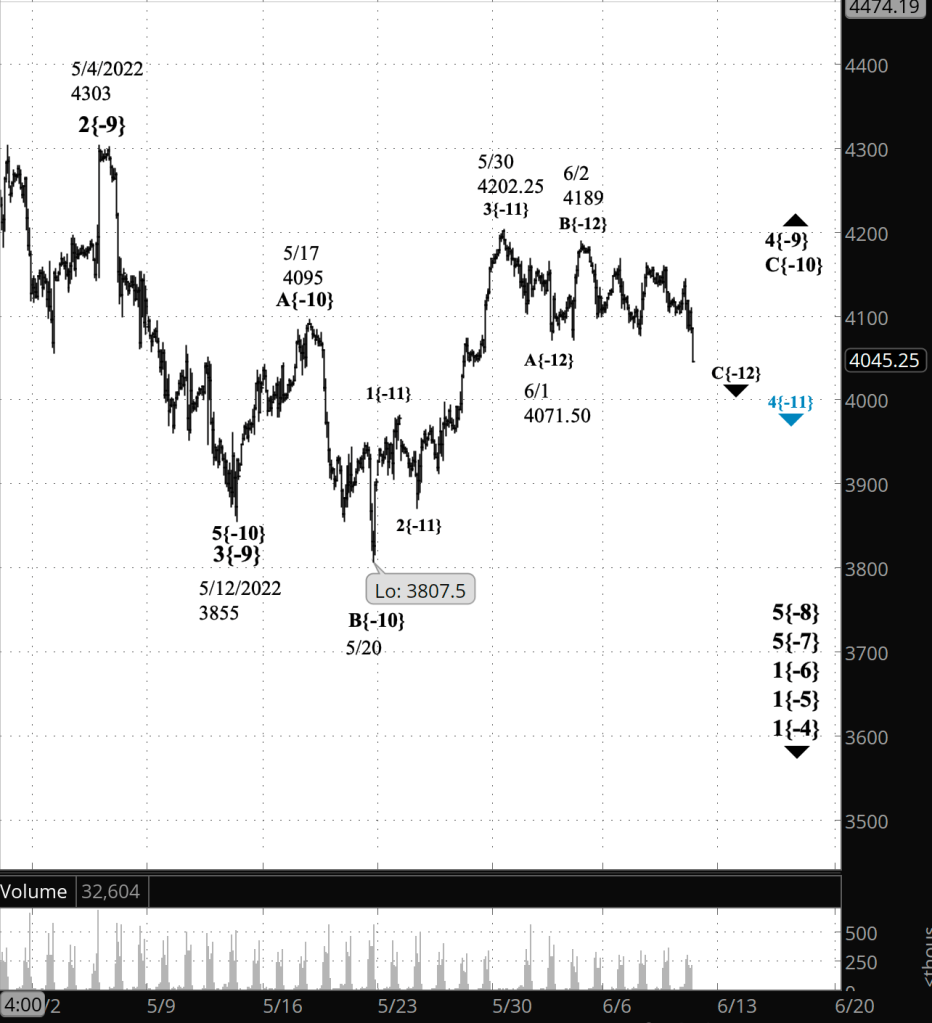
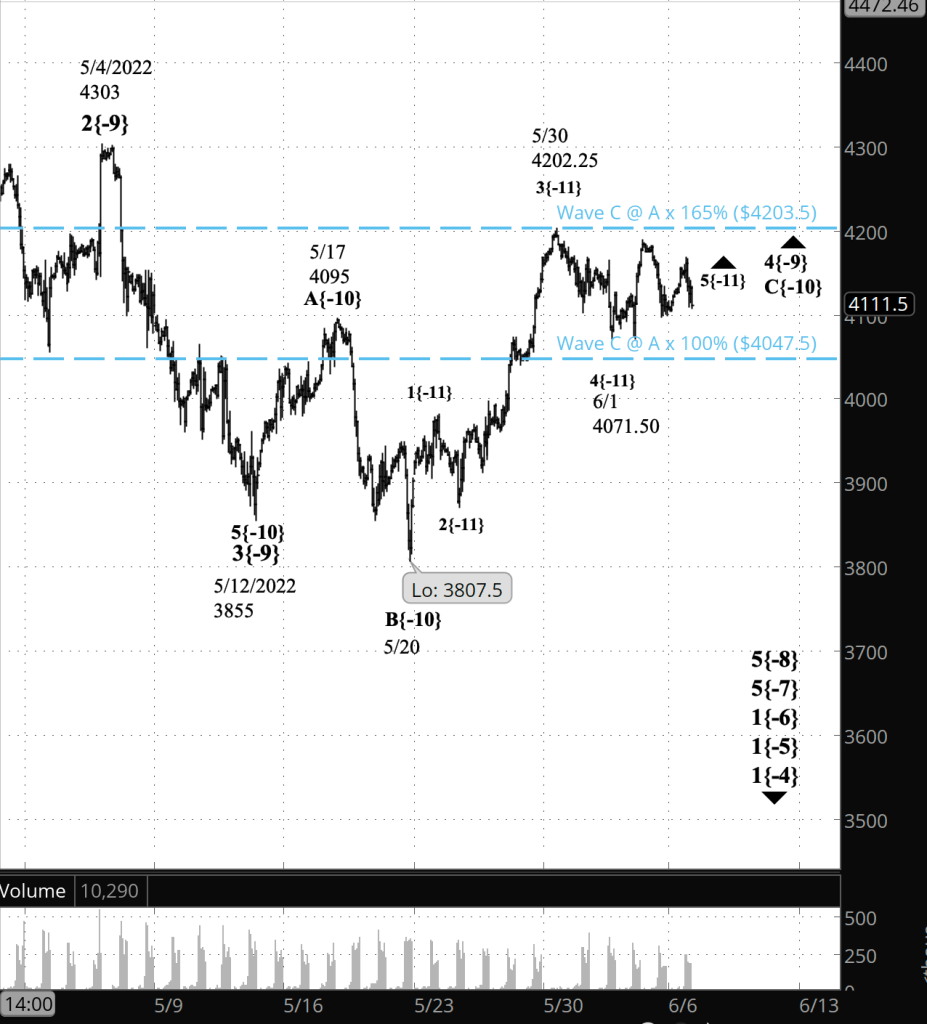
Half an hour before the closing bell. The S&P 500 fell during the session, coming close to 4050 on the futures. No change in the analysis. I’ve updated the upper chart.

9:35 a.m. New York time

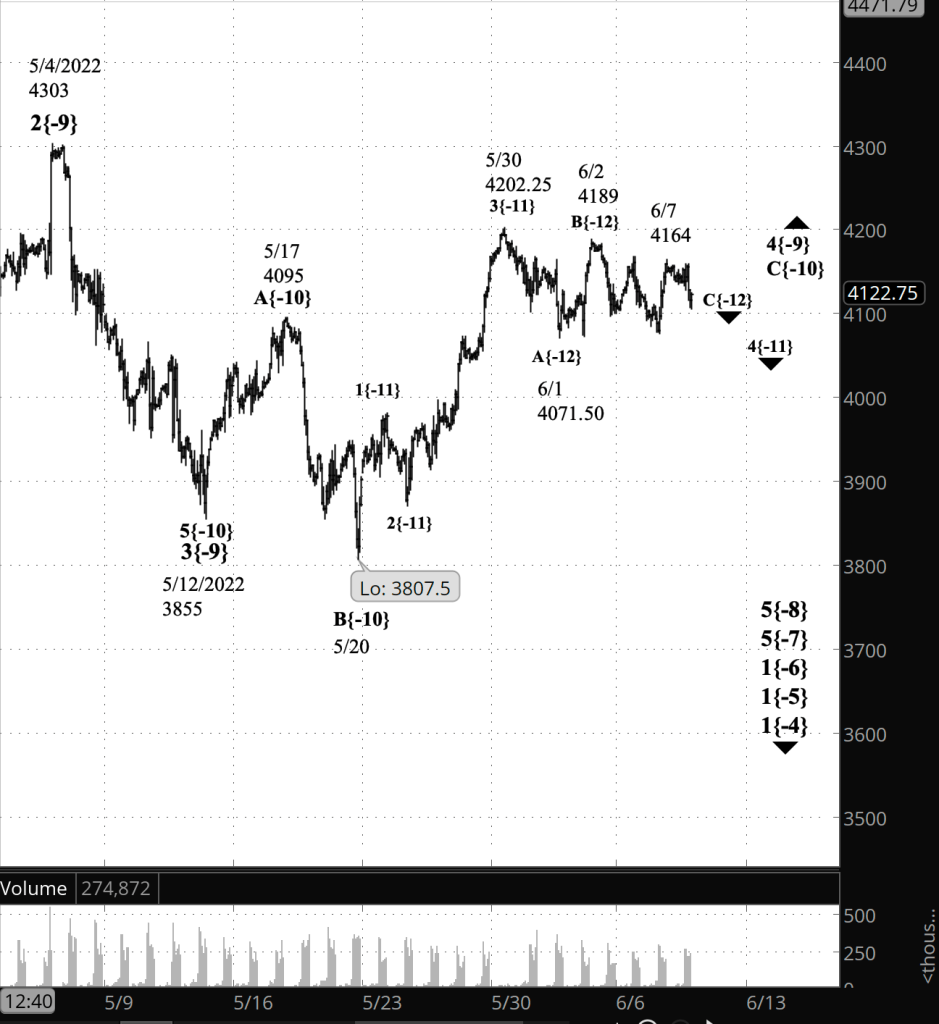
What’s happening now? The S&P 500 E-mini futures stair-stepped lower in overnight trading.

What does it mean? The final segment of a low-level downward corrective pattern that began on May 30 is nearing its end. It will be followed by a rise that will complete the larger upward correction that began on May 12.

What are the alternatives? if the low-level correction forms a compound structure, then the first corrective pattern will be connected to a second corrective pattern and perhaps a third.

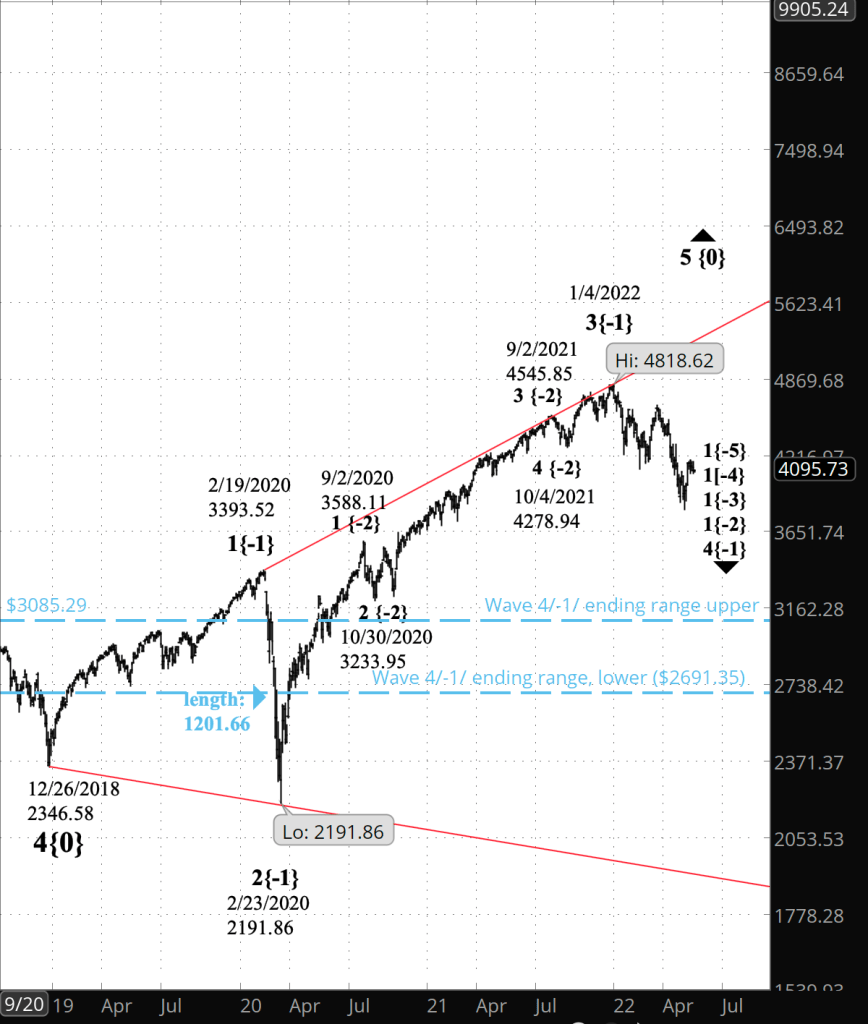
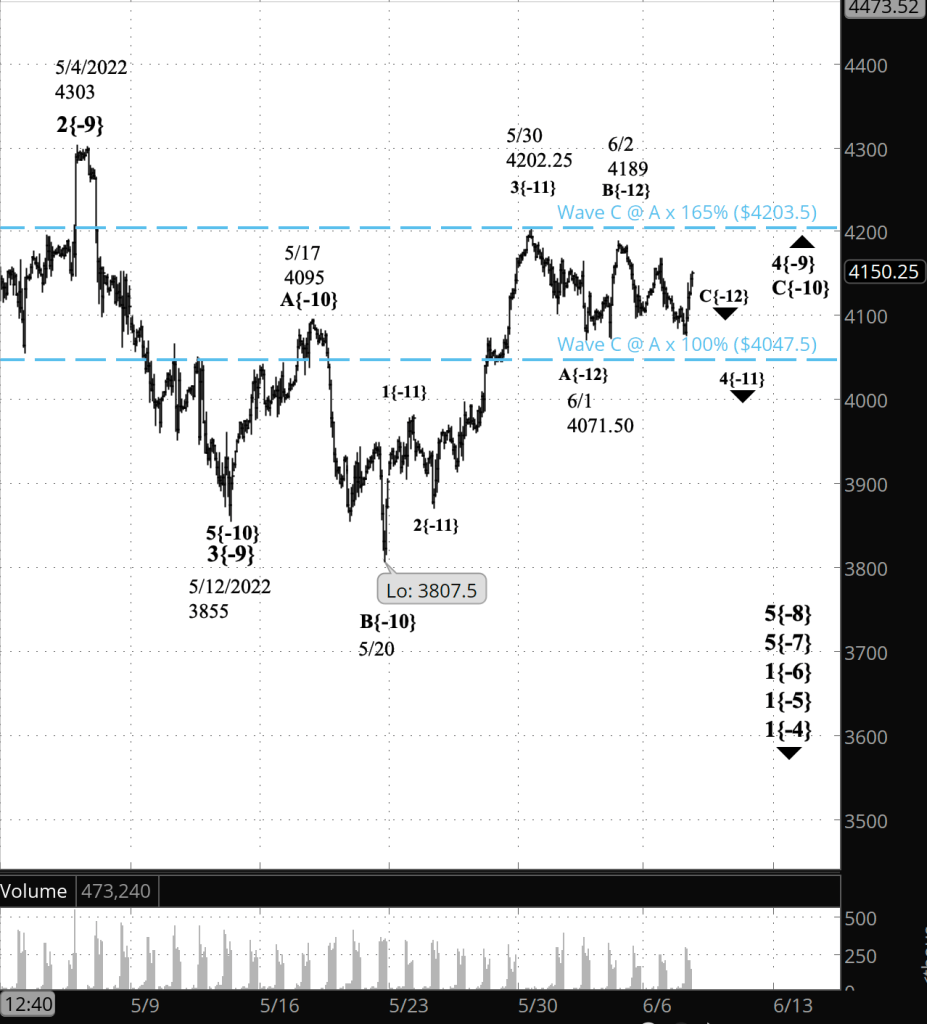
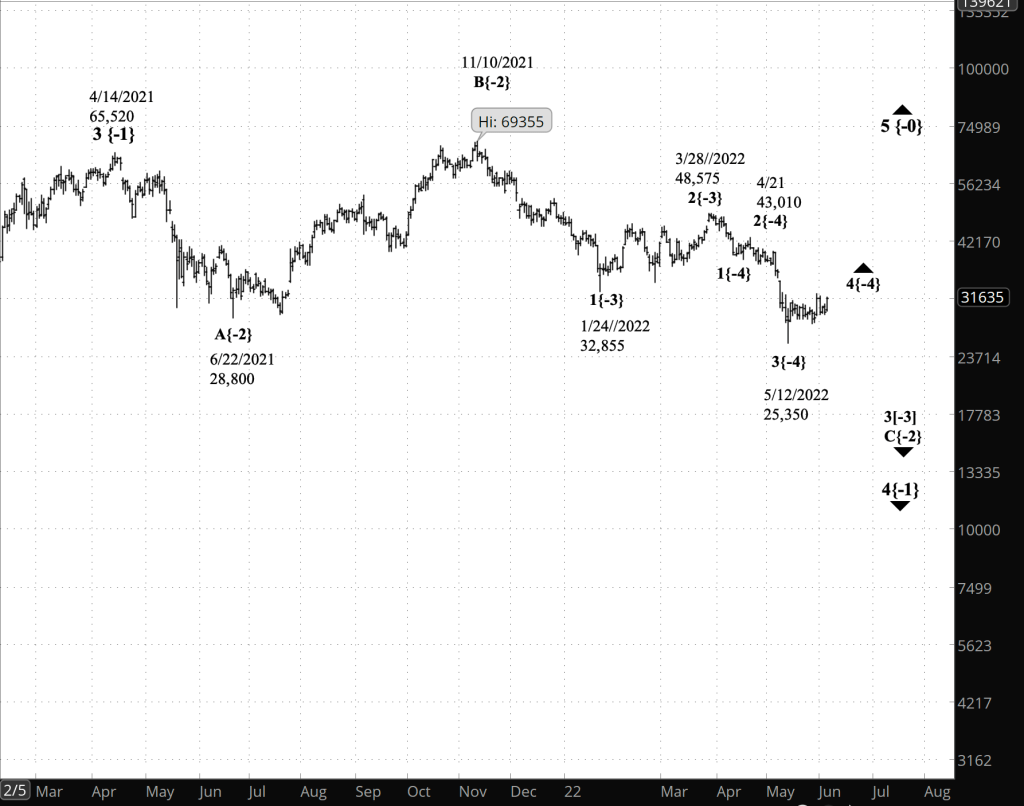
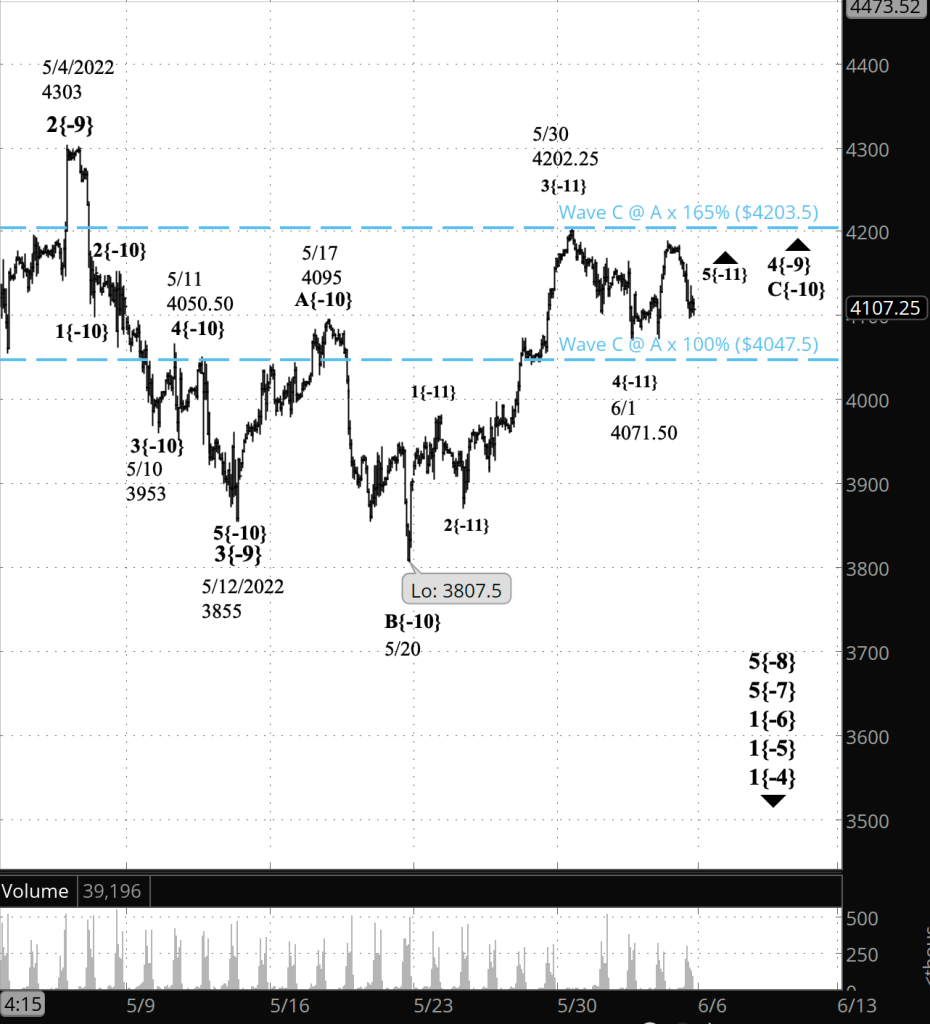
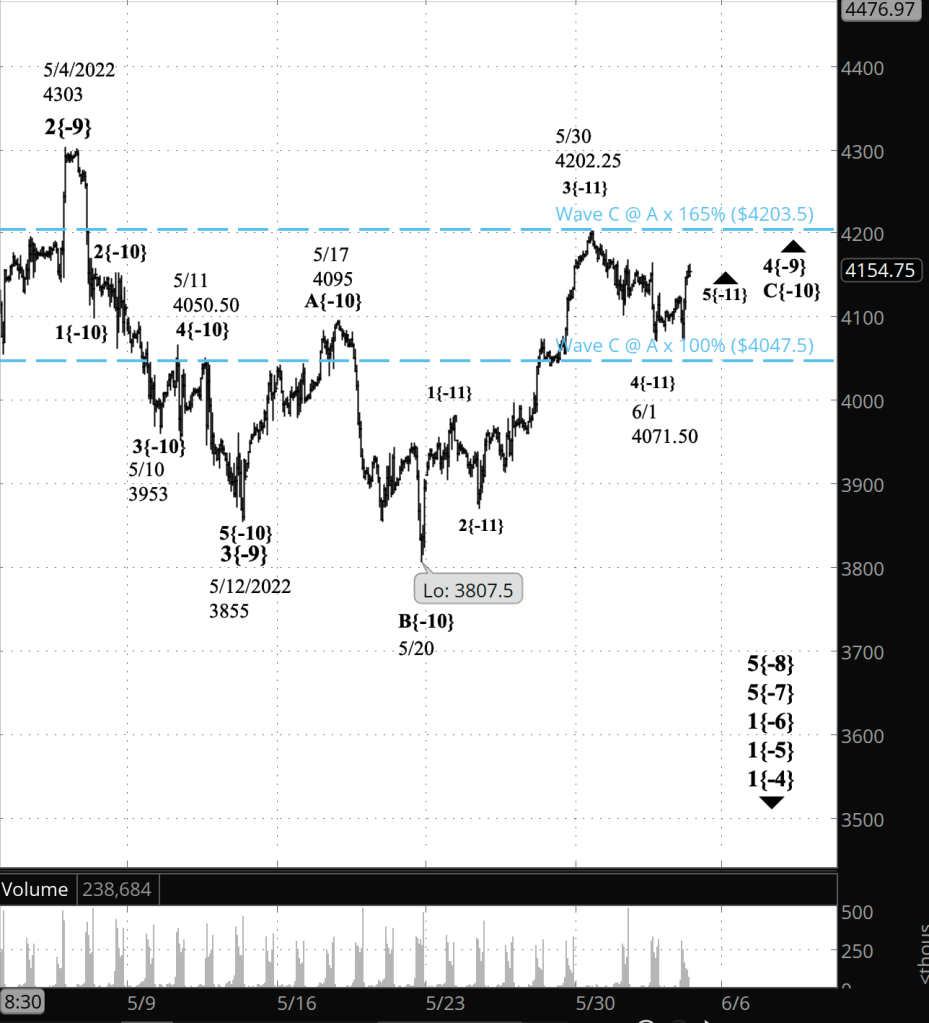
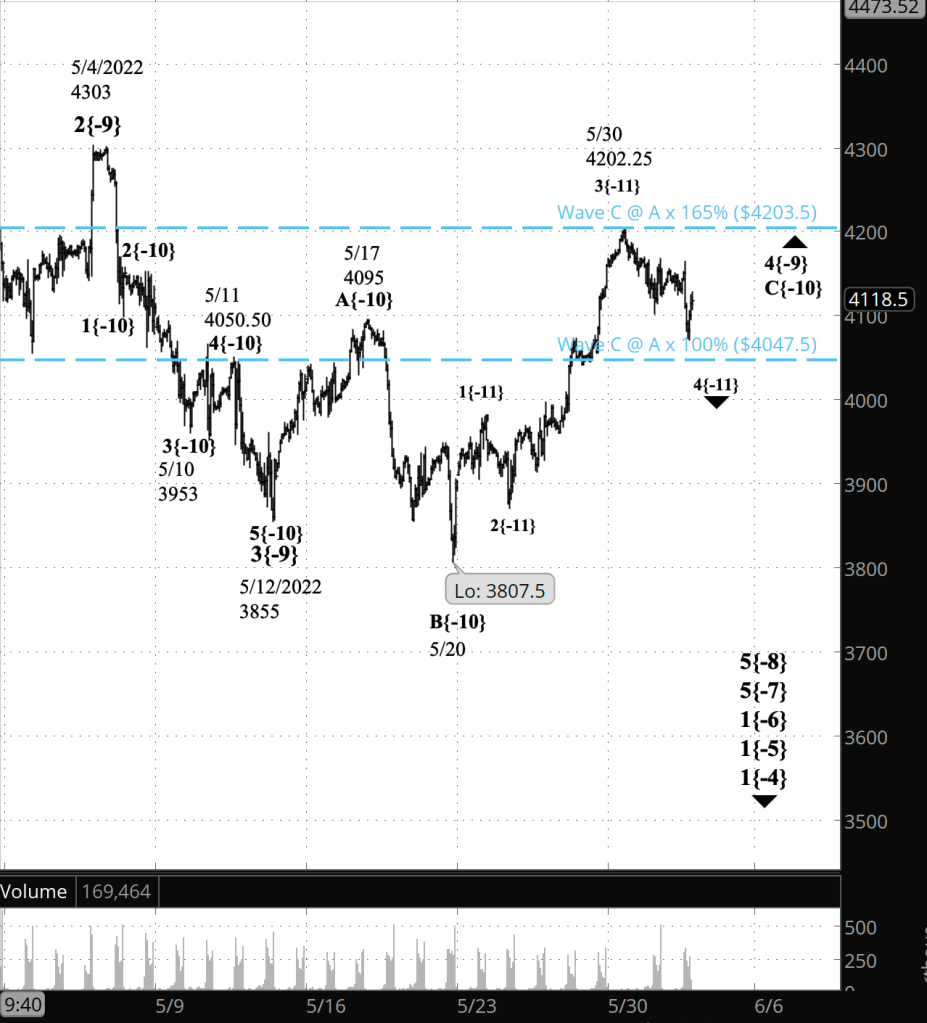
Charts. The upper chart shows the near-term S&P 500 E-mini futures, from early May. The lower chart shows the long term S&P 500 index, from December 2018..

[S&P 500 E-mini futures at 3:30 p.m., 90-minute bars, with volume]
[S&P 500 index at 9:33 a.m., 2-day bars]

What does Elliott wave theory say? There are two corrections of different degrees on the chart.

The lower-degree downward correction, wave 4{-11}, began May 30. Internally, it is the 5th and final wave of its third wave, C{-12}. When wave C{-12} is complete, in the normal course of things that wold be the end of wave 4{-11}. Wave 5{-11} would then carry the price higher. That’s the principal analysis.

Under the alternative analysis, wave 4{-11} will form a compounds structure. Wave C{-12} is followed by a connector, wave X{-12}, and then by a second corrective pattern. Such compound correction can contain up to three patterns. Once wave 4{-11} is complete, then wave 5{-11} will begin its rise.

The higher-degree upward correction is wave 4{-9}, which began on May 12 and is now in its 3rd wave internally, wave C{-10}, which began on May 20. Wave C{-10} will have five waves internally. Wave 4{-11}, the lower degree correction, is the next-to-the-last wave within C{-10}.

The end of wave C{-10} would normally be the the end of wave 4{-9}, but there’s the possibility here, at the higher degree, that wave 4{-9} will form a compound structure. If 4{-9} is a simple correction, wave 5{-9} will follow, carrying the price to significantly lower level. If it’s a simple correction, then wave C{-10} will be followed by a connecting wave, X{-10}, and then another corrective pattern and perhaps a third. After all of that, wave 5{-9} will begin its fall.

Move a degree higher, and things get simple. A downtrend of major proportions began on January 4, ending wave 3{-1}, the rise that began on February 23, 2020, the end of the early pandemic crash. What followed is wave 4{-1} to the downside — it’s still underway — and working up from one step above the future wave 5{-9}, we’re in wave 5{-8}, which began on April 21, within wave 5{-7}, from March 29, and within five increasingly larger waves that began on January 4, waves 1{-6}, 1{-5}, 1{-4}, 1{-3} and 1{2}.

Bottom line: There’s a lot of downside ahead of us in this chart. But as is always the case in the markets, a downtrend is built from smaller uptrends and downtrends, which in turn are built in the same way, at smaller and smaller levels. There will be ways to trade and profit along the way.

Market charts and their wave structures are visual representations of decisions made by millions of traders, and in that respect they are maps of human thought. I find the Elliott wave patterns to be an elegant structure, a thing of profound beauty.

We Are Here.

These are the waves currently in progress under my principal analysis. Each line on the list shows the wave number, with the subscript in curly brackets, the traditional degree name, the starting date, the starting price of the S&P 500 E-mini futures, and the direction of the wave.

  • S&P 500 Index:
  • 5{+3} Supercycle, 7/8/1932, 4.40 (up)
  • 5{+2} Cycle, 12/9/1974, 60.96 (up)
  • 5{+1} Primary, 3/6/2009, 666.79 (up)
  • 5{0} Intermediate, 12/26/2018, 2346.58 (up)
  • 4{-1} Minor, 1/4/2022 4818.62 (down)
  • 1{-2} Minute, 1/4/2022 4818.62 (down)
  • S&P 500 Futures and index:
  • 1{-3} Minuette, 1/4/2022, 4808.25 (down) (futures), 4818.62 (down) (index)
  • S&P 500 Futures:
  • 1{-4} Subminuette, 1/4/2022, 4808.25 (down)
  • 1{-5} Micro, 1/4/2022, 4808.25 (down)
  • 1{-6} Submicro, 1/4/2022, 4808.25 (down)
  • 5{-7} Minuscule, 3/29/2022, 4631 (down)
  • 5{-8} Subminuscule, 4/21/2022, 4509, (down)

Learning and other resources. Elliott wave analysis provides context, not prophecy. As the 20th century semanticist Alfred Korzybski put it in his book Science and Sanity (1933), “The map is not the territory … The only usefulness of a map depends on similarity of structure between the empirical world and the map.” And I would add, in the ever-changing markets, we can judge that similarity of structure only after the fact.

See the menu page Analytical Methods for a rundown on where to go for information on Elliott wave analysis.

By Tim Bovee, Portland, Oregon, June 9, 2022

Disclaimer

Tim Bovee, Private Trader tracks the analysis and trades of a private trader for his own accounts. Nothing in this blog constitutes a recommendation to buy or sell stocks, options or any other financial instrument. The only purpose of this blog is to provide education and entertainment.

No trader is ever 100 percent successful in his or her trades. Trading in the stock and option markets is risky and uncertain. Each trader must make trading decisions for his or her own account, and take responsibility for the consequences.

License
Creative Commons License

All content on Tim Bovee, Private Trader by Timothy K. Bovee is licensed under a Creative Commons Attribution-ShareAlike 4.0 International License.

Based on a work at www.timbovee.com.

Trader’s Notebook

3:30 p.m. New York time

Half an hour before the closing bell. The S&P 500 continued to fall during the session. Wave C{-12} within wave 4{-11} is still underway and internally is in its 5th and final wave. No change in the analysis. The chart has been updated.

1:25 p.m. New York time

OLLI bearish earnings play exit. The delayed earnings announcement by OLLI finally happened this morning. The metrics all pointed to a very negative earnings surprise, OLLI came through with lagging numbers for both earnings and revenue, and the price rose like a 4th of July fireworks rocket. I exited at 100% of maximum potential loss and have updated the trade analysis with details of the sad tale.

9:35 a.m. New York time

What’s happening now? The S&P 500 E-mini futures, in overnight trading, declined slightly from yesterday’s high, 4164.

What does it mean? The decline is the beginning of the final leg of the third segment of a corrective pattern that began on May 30. It will be followed by a resumption of the downtrend that began on April 21.

What are the alternatives? Corrections occasionally will form complex structures, linking two or three corrective patterns together. If this corrective pattern behaves that way, then the resumption of the downtrend will be delayed.

[S&P 500 E-mini futures at 3:30 p.m., 80-minute bars, with volume]

What does Elliott wave theory say? The decline that began on June 2 from 4189 is wave C{-12}, the third wave within a corrective pattern that began on May 30 from 4202.25. With the decline that began from yesterday’s peak, the C wave is now in its 5th and final subwave.

Under my principal analysis, the end of wave C{-12} will also be the end of its parent, wave 4{-9}, an upward correction that began on May 30.

Under my alternative analysis, wave 4{-9} will form a compound correction. In this scenario, wave C{-12} will be followed by a connecting wave, X{-12}, and then by a second corrective pattern, continuing wave 4{-9}.

In any case, once wave 4{-9} is complete, it will be followed by a significant decline, wave 5{-9}, which is likely to drop below the end of the previous downtrending wave, 3{-9}, which was completed on May 12 at 3855. Some 5th waves come up short. And some 5th waves move significantly below the end of wave 5{-9}.

This is all happening within wave 5{-8}, a downtrend that began on April 21 from 4509. The end of wave 5{-9} will also be the end of wave 5{-8} and also of its parent, wave 5{-7}, which began on March 29 from 4631.

It’s a clear illustration of the fractal structure of market movements, with waves within waves that form a quite complex whole.

We Are Here.

These are the waves currently in progress under my principal analysis. Each line on the list shows the wave number, with the subscript in curly brackets, the traditional degree name, the starting date, the starting price of the S&P 500 E-mini futures, and the direction of the wave.

  • S&P 500 Index:
  • 5{+3} Supercycle, 7/8/1932, 4.40 (up)
  • 5{+2} Cycle, 12/9/1974, 60.96 (up)
  • 5{+1} Primary, 3/6/2009, 666.79 (up)
  • 5{0} Intermediate, 12/26/2018, 2346.58 (up)
  • 4{-1} Minor, 1/4/2022 4818.62 (down)
  • 1{-2} Minute, 1/4/2022 4818.62 (down)
  • S&P 500 Futures and index:
  • 1{-3} Minuette, 1/4/2022, 4808.25 (down) (futures), 4818.62 (down) (index)
  • S&P 500 Futures:
  • 1{-4} Subminuette, 1/4/2022, 4808.25 (down)
  • 1{-5} Micro, 1/4/2022, 4808.25 (down)
  • 1{-6} Submicro, 1/4/2022, 4808.25 (down)
  • 5{-7} Minuscule, 3/29/2022, 4631 (down)
  • 5{-8} Subminuscule, 4/21/2022, 4509, (down)

Learning and other resources. Elliott wave analysis provides context, not prophecy. As the 20th century semanticist Alfred Korzybski put it in his book Science and Sanity (1933), “The map is not the territory … The only usefulness of a map depends on similarity of structure between the empirical world and the map.” And I would add, in the ever-changing markets, we can judge that similarity of structure only after the fact.

See the menu page Analytical Methods for a rundown on where to go for information on Elliott wave analysis.

By Tim Bovee, Portland, Oregon, June 8, 2022

Disclaimer

Tim Bovee, Private Trader tracks the analysis and trades of a private trader for his own accounts. Nothing in this blog constitutes a recommendation to buy or sell stocks, options or any other financial instrument. The only purpose of this blog is to provide education and entertainment.

No trader is ever 100 percent successful in his or her trades. Trading in the stock and option markets is risky and uncertain. Each trader must make trading decisions for his or her own account, and take responsibility for the consequences.

License
Creative Commons License

All content on Tim Bovee, Private Trader by Timothy K. Bovee is licensed under a Creative Commons Attribution-ShareAlike 4.0 International License.

Based on a work at www.timbovee.com.

Trader’s Notebook

3:30 p.m. New York time

Half an hour before the closing bell. The S&P 500 declined during the session, reaching a low of 4076 on the futures, and then reversed upward. Wave C{-12} to the downside is still underway. The C wave can be expected to have five waves internally, whether the parent, wave 4{-11}, a downward correction, takes the form of a Flat or a Zigzag. So far wave C has completed three waves internally and today’s upward movement means that it is now in its 4th internal wave.

I’ve updated the chart.

9:35 a.m. New York time

What’s happening now? The S&P 500 E-mini futures fell in overnight trading, returning to the upper 4000s.

What does it mean? The depth of the decline strengthens the case that a downward correction, which began on May 30, is still underway, promoting the alternative analysis in yesterday’s Trader’s Notebook to the principal analysis. Further decline will confirm this scenario.

What is the alternative? The downward correction from May 30 ended on June 1 and a the uptrend that began on May 20 has resumed. A reversal to the upside will confirm this scenario.

Chart. Both the principal and the alternative analyses describe low-level movements within a larger upward correction that began on May 12. The price target range for that larger upward correction is 4047.50 to 4203.50, marked on the chart with blue dashed lines.

[S&P 500 E-mini futures at 3:30 p.m., 80-minute bars, with volume]

What does Elliott wave theory say? Under the principal analysis, the overnight decline is wave C{-12} within an upward correction, wave 4{-11}. Under the alternative analysis, the decline is part of uptrending wave 5{-11}.

Both scenarios are part of wave C{-10}, the final wave of a pattern within an upward correction, wave 4{-9}. This is all happening within wave 5{-8}, a downtrend that began on April 21 that is a wave of lower degree within a series of downtrends of increasingly higher degree, up to wave 4{-1}, which began on January 4.

We Are Here.

These are the waves currently in progress under my principal analysis. Each line on the list shows the wave number, with the subscript in curly brackets, the traditional degree name, the starting date, the starting price of the S&P 500 E-mini futures, and the direction of the wave.

  • S&P 500 Index:
  • 5{+3} Supercycle, 7/8/1932, 4.40 (up)
  • 5{+2} Cycle, 12/9/1974, 60.96 (up)
  • 5{+1} Primary, 3/6/2009, 666.79 (up)
  • 5{0} Intermediate, 12/26/2018, 2346.58 (up)
  • 4{-1} Minor, 1/4/2022 4818.62 (down)
  • 1{-2} Minute, 1/4/2022 4818.62 (down)
  • S&P 500 Futures and index:
  • 1{-3} Minuette, 1/4/2022, 4808.25 (down) (futures), 4818.62 (down) (index)
  • S&P 500 Futures:
  • 1{-4} Subminuette, 1/4/2022, 4808.25 (down)
  • 1{-5} Micro, 1/4/2022, 4808.25 (down)
  • 1{-6} Submicro, 1/4/2022, 4808.25 (down)
  • 5{-7} Minuscule, 3/29/2022, 4631 (down)
  • 5{-8} Subminuscule, 4/21/2022, 4509, (down)

Learning and other resources. Elliott wave analysis provides context, not prophecy. As the 20th century semanticist Alfred Korzybski put it in his book Science and Sanity (1933), “The map is not the territory … The only usefulness of a map depends on similarity of structure between the empirical world and the map.” And I would add, in the ever-changing markets, we can judge that similarity of structure only after the fact.

See the menu page Analytical Methods for a rundown on where to go for information on Elliott wave analysis.

By Tim Bovee, Portland, Oregon, June 7, 2022

Disclaimer

Tim Bovee, Private Trader tracks the analysis and trades of a private trader for his own accounts. Nothing in this blog constitutes a recommendation to buy or sell stocks, options or any other financial instrument. The only purpose of this blog is to provide education and entertainment.

No trader is ever 100 percent successful in his or her trades. Trading in the stock and option markets is risky and uncertain. Each trader must make trading decisions for his or her own account, and take responsibility for the consequences.

License
Creative Commons License

All content on Tim Bovee, Private Trader by Timothy K. Bovee is licensed under a Creative Commons Attribution-ShareAlike 4.0 International License.

Based on a work at www.timbovee.com.

Bitcoin Analysis

10:50 a.m. New York time

What’s happening now? Bitcoin futures continue to trade in a narrow range, as has been the case since May 12.

What does it mean? The sideways pattern is an upward correction, the next-to-the-last segment of a downtrend that began on March 28.

What’s the alternative? There’s some ambiguity in the chart, and the sideways pattern could be a degree smaller, the next-to-the-last segment of a downtrend that began on April 21.

[Bitcoin futures at 10:50 a.m., daily bars]

What does Elliott wave theory say? Under my principal analysis, the sideways pattern is an upward correction, wave 4{-4}, within downtrending wave 3{-3} within downtrending wave C{-2}. The C wave is the third and probably final wave within a large downtrending correction, wave 4{-1}, which began on April 14, 2021.

Under my alternative analysis, the sideways pattern is uptrending wave 4{-5} within a series of downtrending waves, each of greater degree: Wave 3{-4} within wave 3{-3} within wave C{-2}. As is the case with the principal analysis, the alternative is within wave 4{-1}.

Wave 4{-1} is the next-to-the-last wave are playing out within a very a large uptrend, wave 5{0}, which began on December 14, 2018.

So, for the near term, wave 4{-1} is in its last leg, and when that’s done, will have reached its end. It will be followed by wave 5{-1}, an uptrending wave. Fifth waves have a lot of variety. They can extend and cover a surprisingly large distance. They can be truncated and reach their end with unexpected rapidity. There’s no way to know for sure how it will play out.

For the longer term, the end of wave 5{-1} will also be the end of wave 5{0}, which is six months away from completing its the fourth year of its rise. It will be followed by an equally massive downtrend.

Bottom line: Wave 4{-1} has lasted for more than a year, and I would anticipate that uptrending wave 5{-1} could be of equal or greater length. That’s an expectation, not a certainty. However, the end of wave 5{-1} will mark the beginning of a downtrend, wave 5{0}. Bitcoin is too new to know what wave the degree above {0} is in. For convenience call it wave 1{+1}. The decline after the end of 5{0} would, in that case, be wave A{0} of wave 2{+1}. Second waves tend to retrace a large amount of the preceding 1st wave. We don’t know when the 1st wave began, but the low point on the futures is 3,120, the end of wave 4{0}. So we can certainly expect wave 2{+1} to move below that level, several years from now.

We Are Here.

These are the waves currently in progress under my principal analysis. Each line on the list shows the wave number, with the subscript in curly brackets, the traditional degree name, the starting date, the starting price of the S&P 500 E-mini futures, and the direction of the wave.

  • Futures:
  • 5{0} Intermediate, 12/14/2018, 3,120 (up)
  • 4{-1} Minor, 4/14/2021, 65,520 (down)
  • C{-2} Minute, 11/10/2021, 69,355 (down)
  • 3{-3} Minuette, 3/28/2022, 46,550 (down)

Learning and other resources. Elliott wave analysis provides context, not prophecy. As the 20th century semanticist Alfred Korzybski put it in his book Science and Sanity (1933), “The map is not the territory … The only usefulness of a map depends on similarity of structure between the empirical world and the map.” And I would add, in the ever-changing markets, we can judge that similarity of structure only after the fact.

See the menu page Analytical Methods for a rundown on where to go for information on Elliott wave analysis.

By Tim Bovee, Portland, Oregon, June 6, 2022

Disclaimer

Tim Bovee, Private Trader tracks the analysis and trades of a private trader for his own accounts. Nothing in this blog constitutes a recommendation to buy or sell stocks, options or any other financial instrument. The only purpose of this blog is to provide education and entertainment.

No trader is ever 100 percent successful in his or her trades. Trading in the stock and option markets is risky and uncertain. Each trader must make trading decisions for his or her own account, and take responsibility for the consequences.

License
Creative Commons License

All content on Tim Bovee, Private Trader by Timothy K. Bovee is licensed under a Creative Commons Attribution-ShareAlike 4.0 International License.

Based on a work at www.timbovee.com.

Trader’s Notebook

3:30 p.m. New York time

Half an hour before the closing bell. The S&P 500 rose, coming close the upper boundary of the price target range, and then retreated, remaining well above the lower boundary of the range.

So looking at the larger movements since June 1, we have three waves: Up, down and up again, but not as much.

Under my principal analysis, wave 4{-11} ended on June 1, and today’s movements are wave 1{-12}, 2{-12} and the beginning of 3{-12} within wave uptrending wave 5{-11}. Or perhaps wave 2{-12} is still underway.

Under my alternative analysis, the June 1 low is the end of wave A{-12} within wave 4{-11}. Today’s movements: The up wave is wave B{-12}, which may have ended at today’s peak. The subsequent downward movement and upward retreat are wave C{-12} and is still underway.

If the price moves above the upper price target boundary, that lends credence to the principal scenario. If it moves below the lower boundary, then the alternative scenario gain credence.

I’ve updated the chart.

9:35 a.m. New York time

What’s happening now? The S&P 500 E-mini futures rose in overnight trading, returning to the mid-4100s.

What does it mean? The final segment within the third and probably the last leg of an upward correction that began on May 12 is underway. The price remains within the projected range of the end of that upward correction (dashed blue lines on the chart), between 4203.50 and 4047.50.

What is the alternative? The next-to-the-last segment within the third leg of the upward correction is still underway.

[S&P 500 E-mini futures at 3:30 p.m., 80-minute bars, with volume]

What does Elliott wave theory say? Under my principal analysis, wave 5{-11} within wave C{-10} is underway. All of this is happening within wave 4{-9}, an upward correction that began on May 12, within wave 5{-8}, a downtrend that began on January 4.

Under my alternative analysis, wave 4{-11} within wave C{-10} is not yet complete. When it’s done, it will be followed by upward wave 5{-11}.

The wave 4{-9} correction is forming a Flat pattern, with three waves within wave A, three in B and five waves within wave C. I hedged my placement of wave C — “probably the last leg of an upward correction” — because sometimes corrections form a compound pattern, linking two or three corrective patterns together.

We Are Here.

These are the waves currently in progress under my principal analysis. Each line on the list shows the wave number, with the subscript in curly brackets, the traditional degree name, the starting date, the starting price of the S&P 500 E-mini futures, and the direction of the wave.

  • S&P 500 Index:
  • 5{+3} Supercycle, 7/8/1932, 4.40 (up)
  • 5{+2} Cycle, 12/9/1974, 60.96 (up)
  • 5{+1} Primary, 3/6/2009, 666.79 (up)
  • 5{0} Intermediate, 12/26/2018, 2346.58 (up)
  • 4{-1} Minor, 1/4/2022 4818.62 (down)
  • 1{-2} Minute, 1/4/2022 4818.62 (down)
  • S&P 500 Futures and index:
  • 1{-3} Minuette, 1/4/2022, 4808.25 (down) (futures), 4818.62 (down) (index)
  • S&P 500 Futures:
  • 1{-4} Subminuette, 1/4/2022, 4808.25 (down)
  • 1{-5} Micro, 1/4/2022, 4808.25 (down)
  • 1{-6} Submicro, 1/4/2022, 4808.25 (down)
  • 5{-7} Minuscule, 3/29/2022, 4631 (down)
  • 5{-8} Subminuscule, 4/21/2022, 4509, (down)

Learning and other resources. Elliott wave analysis provides context, not prophecy. As the 20th century semanticist Alfred Korzybski put it in his book Science and Sanity (1933), “The map is not the territory … The only usefulness of a map depends on similarity of structure between the empirical world and the map.” And I would add, in the ever-changing markets, we can judge that similarity of structure only after the fact.

See the menu page Analytical Methods for a rundown on where to go for information on Elliott wave analysis.

By Tim Bovee, Portland, Oregon, June 6, 2022

Disclaimer

Tim Bovee, Private Trader tracks the analysis and trades of a private trader for his own accounts. Nothing in this blog constitutes a recommendation to buy or sell stocks, options or any other financial instrument. The only purpose of this blog is to provide education and entertainment.

No trader is ever 100 percent successful in his or her trades. Trading in the stock and option markets is risky and uncertain. Each trader must make trading decisions for his or her own account, and take responsibility for the consequences.

License
Creative Commons License

All content on Tim Bovee, Private Trader by Timothy K. Bovee is licensed under a Creative Commons Attribution-ShareAlike 4.0 International License.

Based on a work at www.timbovee.com.

Trader’s Notebook

3:30 p.m. New York time

Half an hour before the closing bell. The S&P 500 fell during the trading session, reaching a low of 4096.75 on the futures, and then rose slightly. The movement is consistent with this morning’s principal analysis: Rising wave 5{-11} within rising wave C{-10} within an upward correction, wave 4{-9], is underway. The depth of the pullback suggests an additional alternative analysis: Wave 4{-11}, a downward correction within wave C{-10}, is still underway. I’m not ready to adopt that as the principal analysis yet, but it’s a possibility.

I’ve updated the chart.

9:35 a.m. New York time

What’s happening now? The S&P 500 E-mini futures rose to 4189 in overnight trading and then reversed, dropping by almost 60 points. At the overnight peak the price was within 14 points of the upper boundary of the target price range (the dashed blue lines on the chart).

What does it mean? The overnight peak ended the middle segment of the rise that began on June 1. After a small downward correction, that rise will resume in the final segment of the rise that began on May 20. When that rise is complete, it will also, most likely, mark the end of the upward correction that began on May 12 from 3855.

What are the alternatives? There are two.

Alternative #1: The overnight peak may have marked the end of the rise that began on May 20. That interpretation of the chart seems like a stretch to me, but charts always contain ambiguities, so i can’t rule it out entirely.

Alternative #2: The overnight peak marked the end of a three-segment corrective pattern, an upward correction that began on May 12.

[S&P 500 E-mini futures at 9:35 a.m., 75-minute bars, with volume]

What does Elliott wave theory say? In my principal analysis, the overnight peak, marked the end of wave 3{-12}, the middle wave of a five-wave pattern within wave 5{-11}, which in turn is the final wave of wave C{-9}. That C wave is likely to be the final wave of an upward correction, wave 4{9}, that began on May 12.

Under alternative #1, the overnight peak, 4189, was the end of wave 5{-12], the final wave within 5{-11} and its parent C{-10}, and it most likely marks the end of wave 4{-9}.

Under alternative #2, wave 4{-9} take for a compound structure. The three-wave pattern that will end with wave C{-10} will be followed by a downward connector, wave X{-10}, and then another corrective pattern.

The two blue dashed lines on the chart are the price range of the likely ending level of wave C{-10}. A tendency, according to Elliott wave analysis, is from wave C at a minimum to be the same length as the preceding wave A or to be up to 65% longer than wave A. The upper line marks the 65% longer level (4203.50), and the lower line marks the same length level (4047.50).

We Are Here.

These are the waves currently in progress under my principal analysis. Each line on the list shows the wave number, with the subscript in curly brackets, the traditional degree name, the starting date, the starting price of the S&P 500 E-mini futures, and the direction of the wave.

  • S&P 500 Index:
  • 5{+3} Supercycle, 7/8/1932, 4.40 (up)
  • 5{+2} Cycle, 12/9/1974, 60.96 (up)
  • 5{+1} Primary, 3/6/2009, 666.79 (up)
  • 5{0} Intermediate, 12/26/2018, 2346.58 (up)
  • 4{-1} Minor, 1/4/2022 4818.62 (down)
  • 1{-2} Minute, 1/4/2022 4818.62 (down)
  • S&P 500 Futures and index:
  • 1{-3} Minuette, 1/4/2022, 4808.25 (down) (futures), 4818.62 (down) (index)
  • S&P 500 Futures:
  • 1{-4} Subminuette, 1/4/2022, 4808.25 (down)
  • 1{-5} Micro, 1/4/2022, 4808.25 (down)
  • 1{-6} Submicro, 1/4/2022, 4808.25 (down)
  • 5{-7} Minuscule, 3/29/2022, 4631 (down)
  • 5{-8} Subminuscule, 4/21/2022, 4509, (down)

Learning and other resources. Elliott wave analysis provides context, not prophecy. As the 20th century semanticist Alfred Korzybski put it in his book Science and Sanity (1933), “The map is not the territory … The only usefulness of a map depends on similarity of structure between the empirical world and the map.” And I would add, in the ever-changing markets, we can judge that similarity of structure only after the fact.

See the menu page Analytical Methods for a rundown on where to go for information on Elliott wave analysis.

By Tim Bovee, Portland, Oregon, June 3, 2022

Disclaimer

Tim Bovee, Private Trader tracks the analysis and trades of a private trader for his own accounts. Nothing in this blog constitutes a recommendation to buy or sell stocks, options or any other financial instrument. The only purpose of this blog is to provide education and entertainment.

No trader is ever 100 percent successful in his or her trades. Trading in the stock and option markets is risky and uncertain. Each trader must make trading decisions for his or her own account, and take responsibility for the consequences.

License
Creative Commons License

All content on Tim Bovee, Private Trader by Timothy K. Bovee is licensed under a Creative Commons Attribution-ShareAlike 4.0 International License.

Based on a work at www.timbovee.com.

Trader’s Notebook

3:30 p.m. New York time

Half an hour before the closing bell. The S&P 500 reversed and is rising. I’ve labeled the June 1 low of 4071.50 as the end wave 4{-11} and the present rise as wave 5{-11}. When 5{-11} is complete, wave C{-10} will also be complete, and most likely, the upward correction that began on May 12 will also be complete.

An alternative analysis is that the June 1 low marked the end of the first wave within 4{-11}. If that’s the case, then there are most likeIy two more waves to go before wave 4{-11} is complete. As is often the case, the degree of each movement is somewhat ambiguous.

I’ve updated the chart.

9:35 a.m. New York time

What’s happening now? The S&P 500 E-mini futures rose slightly overnight but then fell slightly at the opening bell.

What does it mean? A low-level downward correction is underway, within a the final, rising leg of a larger upward correction, all happening in a downtrend that began on April 21. The downward correction will be followed by a push to the upside that will exceed the May 30 high, 4202.25, completing the larger upward correction and resume the downtrend.

What are the alternatives? There are three.

Alternative #1: The final leg of the larger, upward correction ended on May 30 at 4202.25, and the downtrend has resumed.

Alternative #2: The final push to the upside may be truncated, falling short of the May 30 high.

Alternative #3: The end of the final, rising leg of larger upward correction won’t be the final leg. Instead, the correction will take a compound structure, adding on a second corrective pattern.

[S&P 500 E-mini futures at 9:35 a.m., 70-minute bars, with volume]

What does Elliott wave theory say? Principal analysis: An upward correction, wave 4{-9}, is in its final wave internally, wave C{-10}. The C wave in turn is in its next-to-the-last movement, wave 4{-11}. When wave C{-10} reaches completion with the end of wave 5{-11}, most likely above the May 30 high of 4202.25, it will also be the end of wave 4{-9} and the beginning of wave 5{-9}, resuming the downtrend that began on April 21.

Alternative #1: Wave 4{-9} ended on May 30, and wave 5{-9} is underway.

Alternative #2: Wave C{-10} within wave 4{-9} will fall short of 4202.25, a pattern known as truncation in Elliott wave terminology.

Alternative #3: The end of wave C{-10} won’t be the end of wave 4{-9}. Instead, wave 4{-9} will form a compound structure, with wave C{-10} being followed by wave X{-10}, which in turn will be followed by a second corrective pattern.

We Are Here.

These are the waves currently in progress under my principal analysis. Each line on the list shows the wave number, with the subscript in curly brackets, the traditional degree name, the starting date, the starting price of the S&P 500 E-mini futures, and the direction of the wave.

  • S&P 500 Index:
  • 5{+3} Supercycle, 7/8/1932, 4.40 (up)
  • 5{+2} Cycle, 12/9/1974, 60.96 (up)
  • 5{+1} Primary, 3/6/2009, 666.79 (up)
  • 5{0} Intermediate, 12/26/2018, 2346.58 (up)
  • 4{-1} Minor, 1/4/2022 4818.62 (down)
  • 1{-2} Minute, 1/4/2022 4818.62 (down)
  • S&P 500 Futures and index:
  • 1{-3} Minuette, 1/4/2022, 4808.25 (down) (futures), 4818.62 (down) (index)
  • S&P 500 Futures:
  • 1{-4} Subminuette, 1/4/2022, 4808.25 (down)
  • 1{-5} Micro, 1/4/2022, 4808.25 (down)
  • 1{-6} Submicro, 1/4/2022, 4808.25 (down)
  • 5{-7} Minuscule, 3/29/2022, 4631 (down)
  • 5{-8} Subminuscule, 4/21/2022, 4509, (down)

Learning and other resources. Elliott wave analysis provides context, not prophecy. As the 20th century semanticist Alfred Korzybski put it in his book Science and Sanity (1933), “The map is not the territory … The only usefulness of a map depends on similarity of structure between the empirical world and the map.” And I would add, in the ever-changing markets, we can judge that similarity of structure only after the fact.

See the menu page Analytical Methods for a rundown on where to go for information on Elliott wave analysis.

By Tim Bovee, Portland, Oregon, June 2, 2022

Disclaimer

Tim Bovee, Private Trader tracks the analysis and trades of a private trader for his own accounts. Nothing in this blog constitutes a recommendation to buy or sell stocks, options or any other financial instrument. The only purpose of this blog is to provide education and entertainment.

No trader is ever 100 percent successful in his or her trades. Trading in the stock and option markets is risky and uncertain. Each trader must make trading decisions for his or her own account, and take responsibility for the consequences.

License
Creative Commons License

All content on Tim Bovee, Private Trader by Timothy K. Bovee is licensed under a Creative Commons Attribution-ShareAlike 4.0 International License.

Based on a work at www.timbovee.com.

Trader’s Notebook

3:30 p.m. New York time

Morning Trader’s Notebook disppeared. This morning’s Trader’s Notebook somehow never made it to the blog and is now wandering aimlessly around the Metaverse, a ghost of a post.

So, this post takes care of both this morning and this afternoon.

Half an hour before the closing bell. The S&P 500 E-mini futures fell in morning part of the session and then began to rise.

What does it mean? The decline from the May 30 high is a downward correction within the final leg of a larger upward correction within a still larger downtrend.

What are the alternatives? There are three, the same as those discussed yesterday.

Alternative #1: The May 30 peak marks the end of the larger upward correction and the downtrend that began on April 21 has resumed.

Alternative #2: The final move to the upside may fall short of the May 30 peak, a condition known as truncation.

Alternative #3: The correction could take a compound form, stringing several corrective patterns together.

[S&P 500 E-mini futures at 3:30 p.m., 70-minute bars, with volume]

What does Elliott wave theory say? Under my principal analysis, a upward correction, wave 4{-9} has been underway since May 12. It is now in the final wave, C{-10}, of a three-wave Flat corrective pattern. Within wave C, a downward correction, wave 4{-11}, began on May 30. It can be counted as being in its 4th of five waves internally. When complete, wave 4{-9} will be followed by wave 5{-9}, a continuation of the downtrend that began on April 21 from 4509.

Alternative #1: Wave 4{-9} ended at the May 30 peak, 4202.25.

Alternative #2: Although the 5th and final wave within wave C would normally move above the prior peak, it’s possible that wave 5{-10} will be truncated, coming in below 4202.25.

Alternative #3: Most of the time in a flat, the C wave marks the end of the correction. Sometimes, the correction forms a compound structure, stringing two or three corrective patterns together. If wave 4{-9} forms a compound structure, wave C{-10} will be followed by a connecting wave, X{-10}, and then another corrective pattern.

We Are Here.

These are the waves currently in progress under my principal analysis. Each line on the list shows the wave number, with the subscript in curly brackets, the traditional degree name, the starting date, the starting price of the S&P 500 E-mini futures, and the direction of the wave.

  • S&P 500 Index:
  • 5{+3} Supercycle, 7/8/1932, 4.40 (up)
  • 5{+2} Cycle, 12/9/1974, 60.96 (up)
  • 5{+1} Primary, 3/6/2009, 666.79 (up)
  • 5{0} Intermediate, 12/26/2018, 2346.58 (up)
  • 4{-1} Minor, 1/4/2022 4818.62 (down)
  • 1{-2} Minute, 1/4/2022 4818.62 (down)
  • S&P 500 Futures and index:
  • 1{-3} Minuette, 1/4/2022, 4808.25 (down) (futures), 4818.62 (down) (index)
  • S&P 500 Futures:
  • 1{-4} Subminuette, 1/4/2022, 4808.25 (down)
  • 1{-5} Micro, 1/4/2022, 4808.25 (down)
  • 1{-6} Submicro, 1/4/2022, 4808.25 (down)
  • 5{-7} Minuscule, 3/29/2022, 4631 (down)
  • 5{-8} Subminuscule, 4/21/2022, 4509, (down)

Learning and other resources. Elliott wave analysis provides context, not prophecy. As the 20th century semanticist Alfred Korzybski put it in his book Science and Sanity (1933), “The map is not the territory … The only usefulness of a map depends on similarity of structure between the empirical world and the map.” And I would add, in the ever-changing markets, we can judge that similarity of structure only after the fact.

See the menu page Analytical Methods for a rundown on where to go for information on Elliott wave analysis.

By Tim Bovee, Portland, Oregon, June 1, 2022

Disclaimer

Tim Bovee, Private Trader tracks the analysis and trades of a private trader for his own accounts. Nothing in this blog constitutes a recommendation to buy or sell stocks, options or any other financial instrument. The only purpose of this blog is to provide education and entertainment.

No trader is ever 100 percent successful in his or her trades. Trading in the stock and option markets is risky and uncertain. Each trader must make trading decisions for his or her own account, and take responsibility for the consequences.

License
Creative Commons License

All content on Tim Bovee, Private Trader by Timothy K. Bovee is licensed under a Creative Commons Attribution-ShareAlike 4.0 International License.

Based on a work at www.timbovee.com.