3:30 p.m. New York time
Half an hour before the closing bell. The S&P 500 futures rose sharply at 1:30 p.m. when Federal Reserve President Jerome Powell said interest rate increases would continue but the pace would slow, perhaps as early as the December 13-14 Federal Open Market Committee meeting.
- As inflation took hold, the FOMC began raising rates, first in March, by 25 basis, then again in May, 50 basis points, and then by 75 basis points the next four times the committee met.
- Powell’s remark suggests a 50 basis point increase in December, perhaps, or perhaps early next year.
The S&P 500 futures responded by rising 87 basis points, to 4043, in an hour.
The price pushed past the 61.8% retracement of the downtrend Fibonacci retracement that began on August 16. The price has stalled twice at that level in November. Today the price broke through the November 15 high, 4050.75, reaching into the 4060s as the closing bell approached.
The final upward drive. The break beyond the 61.8% retracement, at 4013, suggests that the end of the correction has come one step nearer.
- The final wave within the final wave of the correction is now underway.
- On the chart, the wave labels are wave E{-9} within wave C{-8} within wave 2{-7}.
- The alternative analysis presented this morning is no longer a contender.
9:35 a.m. New York time
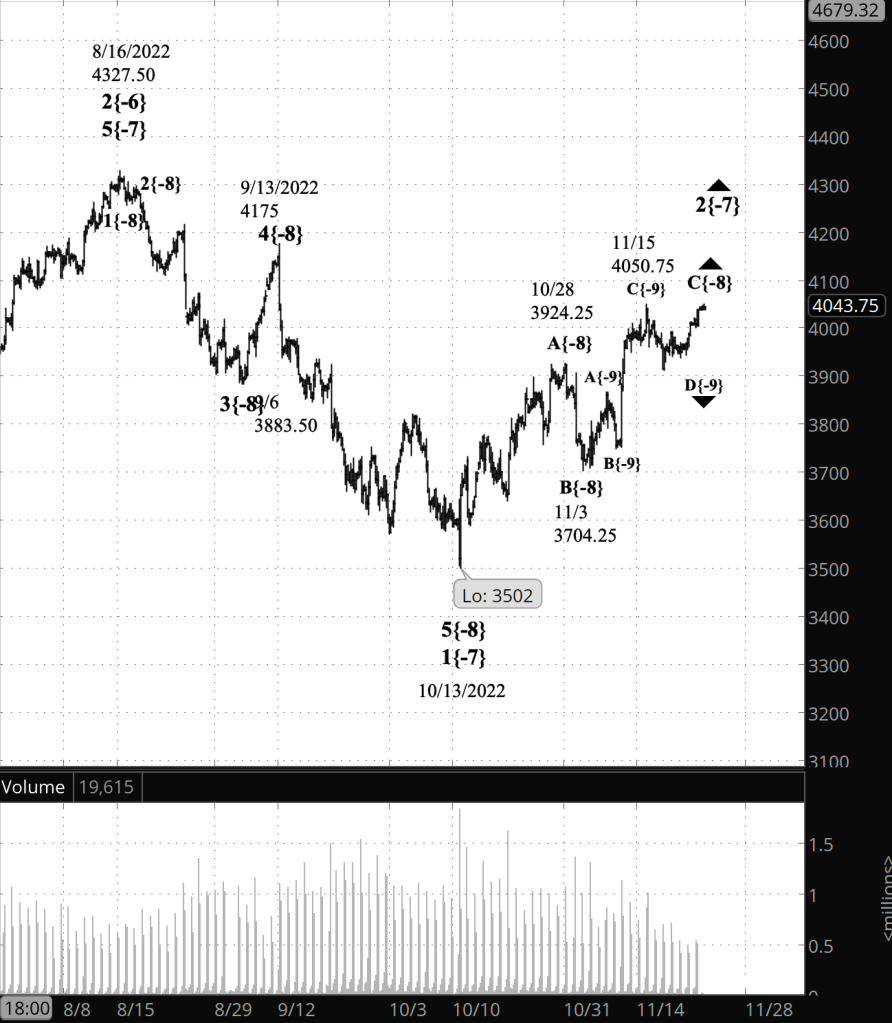
What’s happening now? The S&P 500 E-mini futures rose into the 3960s and 3970s and continued to fluctuate around that level overnight. At 8:30 a.m., as the opening bell approached, the price took a sudden quick dip into the 3950s, coinciding with release of a sneak preview of Friday’s jobs numbers.
What does it mean? The upward correction that began on October 13 is nearing its end. It will be followed by a powerful decline into the 3400s or lower.
- The retreat from the recent peak is the fourth part of a five part movement that on balance has brought the price higher. The fifth part will carry the price still higher.
- The five parts of the rise are the building blocks of the third leg of the upward correction. When the third leg is complete, it will also mean that the correction is complete.
- After the correction is done, the downtrend that began on August 16 will resume.
What are the alternatives? It’s possible that the recent peak was the end of the upward correction, and the movement that followed is the early stage of the resumed downtrend.
Elliott wave theory. The analysis is based on Elliott wave theory, a way of reading charts developed in the 1930s by R.N. Elliott, an accountant. Elliott called each movement on the chart, up or down, a “wave”. Although his Wave Principle has many observations, it is based on three key discoveries.
- All market trends contain five waves, three in the direction of the trend and two corrections in the opposite direction.
- Most market corrections contain three waves, although there are exceptions.
- Most importantly, each wave in a trend or correction contains smaller waves and is itself part of a larger wave. And those waves, big or small, all trace the same patterns and can be analyzed in the same way.
Elliott’s theory gives every market movement a context. If we know the placement of a wave, we will know how far along a trend or correction has gone, how much remains, and how it will play out.
Chart notes. On the chart I follow Elliott by giving each wave a number, for waves within trends, or a letter, for waves within corrections. I use subscripts, in curly brackets, to denote the relative size — what Elliott called the “degree” — of each wave within the complex structure of the chart.
For this chart I have added red lines showing likely turning points, called Fibonacci retracement levels. They show how much of a trend that a correction has retraced.
- On this chart, the price is between the 50% an 61.8% retracement levels. The present wave, labeled D{-9}, is likely to end around the 50% level — a price of3915 — and the next wave, E{-9}, may well carry the price up to the next Fibonacci turning point, the 78.6% retracement level — a price of 4151.
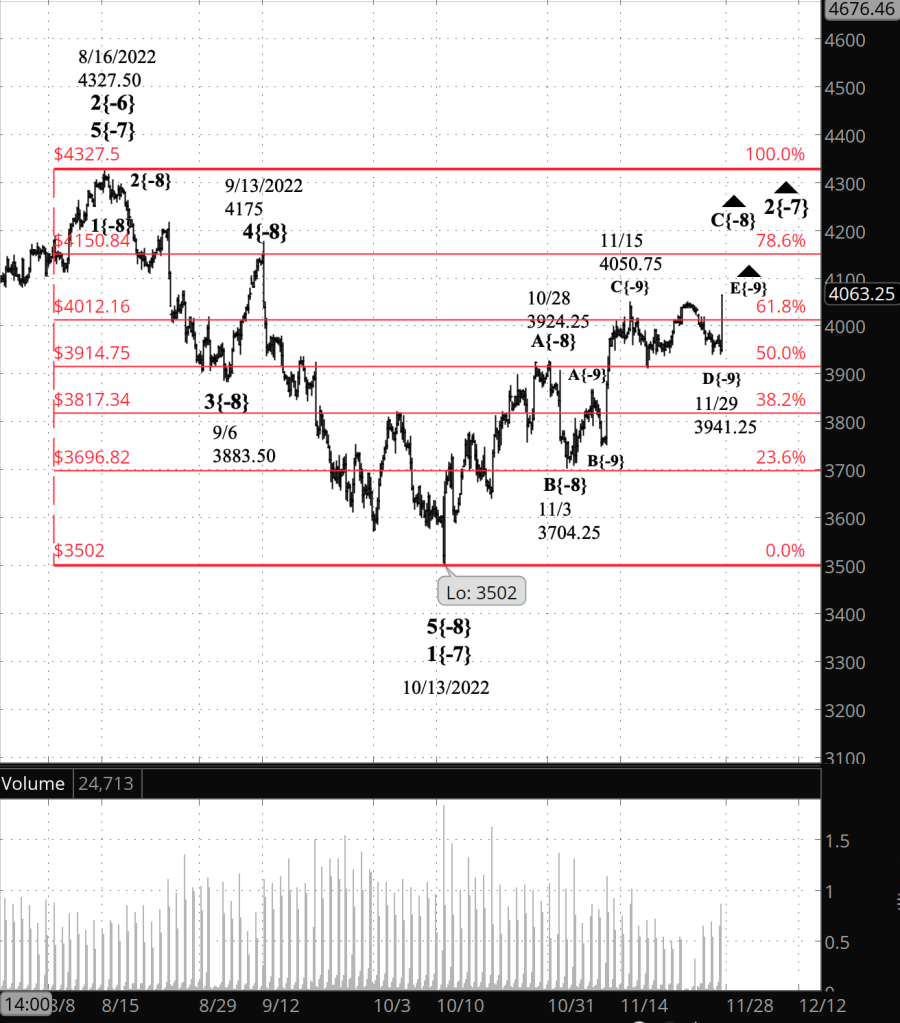
[S&P 500 E-mini futures at 3:30 p.m., 4-hour bars, with volume]
What does Elliott wave theory say? The three waves powering the action illustrate Elliott’s waves-within-waves idea.
- The largest wave is the upward correction as a whole, wave 2{-7}.
- Within it is the third and final leg of the three-wave correction, wave C{-8}.
- And that third leg has a five wave structure and is presently in wave D{-9}, with the final wave, E{-9}, still to ome.
The alternative shows wave 2{-7} as having ended at the recent high, 4050.75.
Under both the principal scenario and its alternative, wave 2{-7} will be a followed by wave 3{-7}, a resumption of the downtrend.
- Third waves are usually the most powerful of them all. Expect wave 3{-7} to produce an energetic decline.
- All of the waves mentioned so far are parts of wave 3{-6}. a downtrend that began on August 16 from 4327.50.
It’s mainly down from here. Within the larger downtrend, wave 3{-6}, the next wave to come, wave 3{-7}, will be a downtrend within a downtrend. It will be followed by wave 4{-7}, a second upward correction, and then by wave 5{-7}, another resumption of the downtrend.
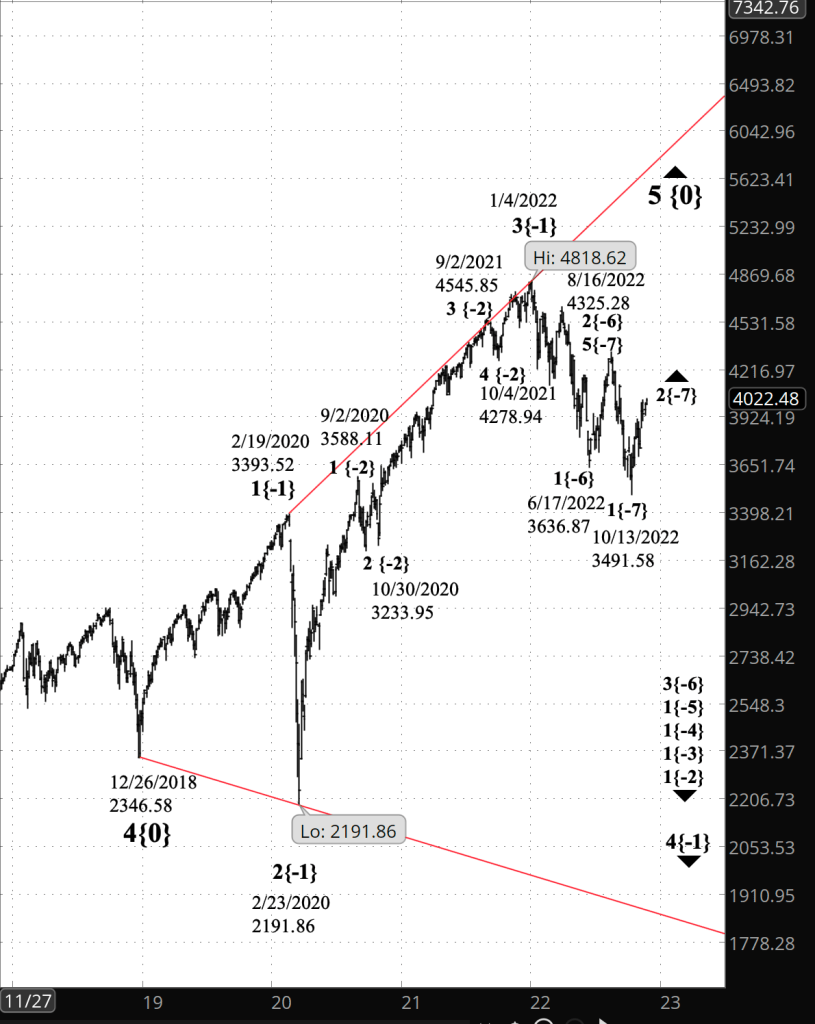
- And at a larger level, we’ve been in a downtrend all year, within wave 1{-2}. which began on January 4, from slightly above 4800.
The message of Elliott wave analysis is clear: Expect prices to decline more than they rise well into next year and perhaps beyond. We won’t see that January 4 peak for awhile.
We Are Here.
These are the waves currently in progress under my principal analysis. Each line on the list shows the wave number, with the subscript in curly brackets, the traditional degree name, the starting date, the starting price of the S&P 500 E-mini futures, and the direction of the wave.
- S&P 500 Index:
- 5{+3} Supercycle, 7/8/1932, 4.40 (up)
- 5{+2} Cycle, 12/9/1974, 60.96 (up)
- 5{+1} Primary, 3/6/2009, 666.79 (up)
- 5{0} Intermediate, 12/26/2018, 2346.58 (up)
- 4{-1} Minor, 1/4/2022 4818.62 (down)
- 1{-2} Minute, 1/4/2022 4818.62 (down)
- S&P 500 Futures and index:
- 1{-3} Minuette, 1/4/2022, 4808.25 (down) (futures), 4818.62 (down) (index)
- S&P 500 Futures:
- 1{-4} Subminuette, 1/4/2022, 4808.25 (down)
- 1{-5} Micro, 1/4/2022, 4808.25 (down)
- 3{-6} Submicro, 8/16/2022, 4327.50 (down)
- 2{-7} Minuscule, 10/13/2022, 3502 (up)
- C{-8} Subminuscule, 11/3/2022, 3704.25 (up)
Learning and other resources. Elliott wave analysis provides context, not prophecy. As the 20th century semanticist Alfred Korzybski put it in his book Science and Sanity (1933), “The map is not the territory … The only usefulness of a map depends on similarity of structure between the empirical world and the map.” And I would add, in the ever-changing markets, we can judge that similarity of structure only after the fact.
See the menu page Analytical Methods for a rundown on where to go for information on Elliott wave analysis.
By Tim Bovee, Portland, Oregon, November 30, 2022
Disclaimer
Tim Bovee, Private Trader tracks the analysis and trades of a private trader for his own accounts. Nothing in this blog constitutes a recommendation to buy or sell stocks, options or any other financial instrument. The only purpose of this blog is to provide education and entertainment.
No trader is ever 100 percent successful in his or her trades. Trading in the stock and option markets is risky and uncertain. Each trader must make trading decisions for his or her own account, and take responsibility for the consequences.
License
All content on Tim Bovee, Private Trader by Timothy K. Bovee is licensed under a Creative Commons Attribution-ShareAlike 4.0 International License.
Based on a work at www.timbovee.com.


You must be logged in to post a comment.