3:30 p.m. New York time
Half an hour before the closing bell. The S&P 500 futures stair-stepped downward during the session, reaching a low so far of 7199.50, then bounced back to 7239.50.
Elliott Wave Theory: This morning’s Decision Points said that a rise above 7300.75 would strengthen the case for wave D{-5} still being underway, and that a sustained move below 7213.75 would strengthen the case that wave E{-5} is now underway.
The price today has stayed below the upper level and has also failed to remain below the lower level. It poked below 7213.75 a couple of times, and in each case quickly rebounded.
The futures have spent nearly all of the session in the foggy gray area of uncertainty, confirming neither the continuation of wave D{-5} nor the beginning of wave E{-5}.
Decision Points. A rise above 7239.50 would weaken the immediate bearish case but would not by itself confirm that wave D{-5} is still underway. A rise above 7300.75 would do more to strengthen the D-wave interpretation. A sustained fall below 7199.50 would strengthen the case that wave E{-5} has begun. A further decline back beneath the upper boundary of the Expanding Triangle would add weight to the E-wave interpretation.
9:35 a.m. New York time
What’s happening now. The S&P 500 E-mini futures gapped above Friday’s close when trading resumed on Sunday, reached a high of 7300.75, and then fell sharply to 7213.75 after President Trump said the United States military would escort ships through the Strait of Hormuz, a key sea route disrupted by the Iran War.
What does it mean? The price remains above the upper boundary of the Expanding Triangle that has been underway since the end of October 2025. The Triangle is the form taken by wave 4{-4}, a downward correction. When Elliott Wave Theory is applied, the downward movement weakens the case for rising wave D{-5} being underway, but not enough to verify the end of wave D and the beginning of falling wave E{-5}.
Waves D and E are each subwaves within wave 4{-4}. Wave E{-5} will be the final wave within wave 4{-4}. The end of the E wave will also be the beginning of uptrending wave 5{-4}.
Decision Points. A rise above 7300.75 would strengthen the case that wave D{-5} is still underway. A sustained move below 7213.75 would strengthen the case that wave D{-5} has ended and that falling wave E{-5} has begun. A fall back beneath the upper boundary of the Expanding Triangle would further support the E-wave interpretation.
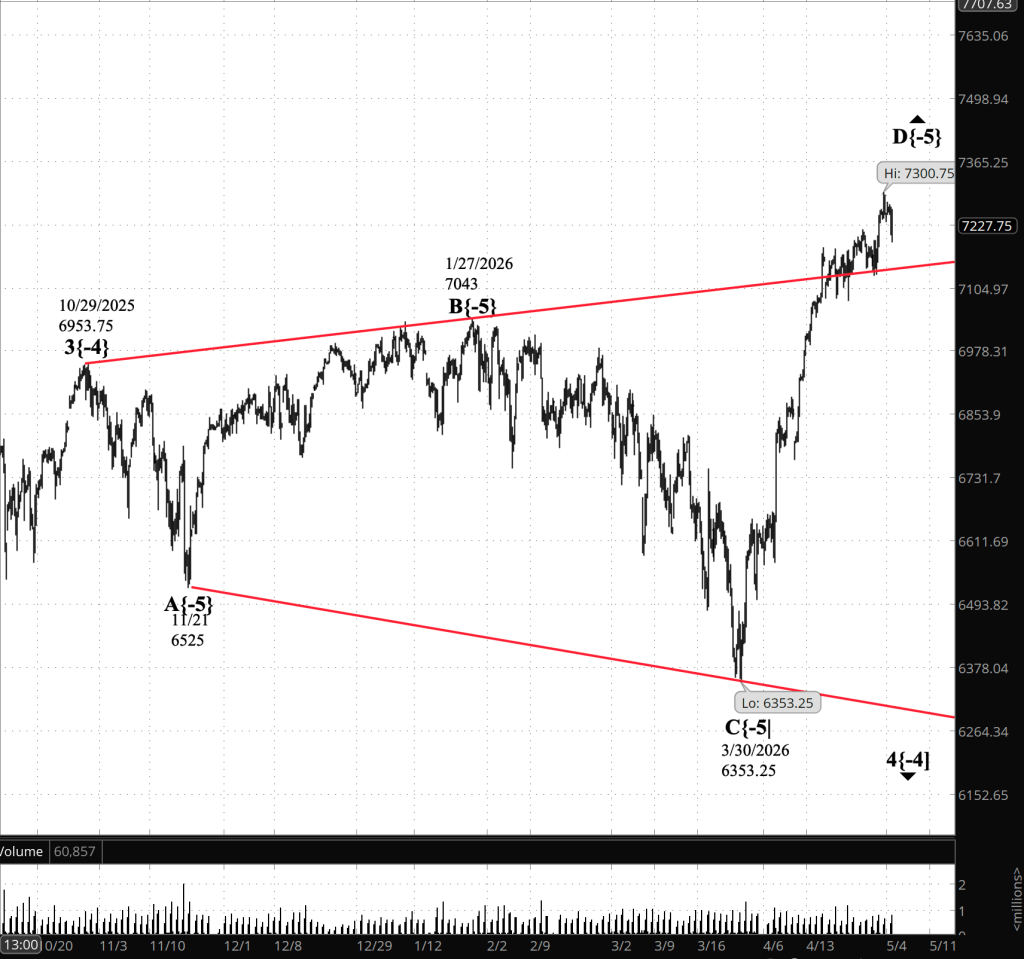
[S&P 500 E-mini futures 3:30 p,m., 5-hour bars with volume]
Waves Now Underway
These are the waves currently in progress under my principal analysis. Each line on the list shows the wave number, with the subscript in curly brackets, the traditional degree name, the starting date, the starting price of the S&P 500 E-mini futures, and the direction of the wave.
- S&P 500 Index:
- 5{+3} Supercycle, 7/8/1932, 4.40 (up)
- 5{+2} Cycle, 12/9/1974, 60.96 (up)
- 5{+1} Primary, 3/6/2009, 666.79 (up)
- 5{0} Intermediate, 2/11/2016, 1810.10 (up)
- 3{-1} Minor, 3/23/2020, 2191.36 (up)
- 1{-2} Minute, 7/31/2025, 6468.50 (down)
- S&P 500 E-mini futures
- 5{-3} Minuette 8/1/2025, 6239.50 (up}
- 4{-4} Subminutte 10/29/2025, 6953.75 (down}
- D{-5} Micro, 3/30/2026, 6353.25 (up}
Reading the chart. Price movements — waves – – in Elliott Wave Theory analysis are labeled with numbers within trending waves and letters with corrective waves. The subscripts — numbers in curly brackets — designate the wave’s degree, which, in Elliott Wave analysis, means the relative position of a wave within the larger and smaller structures that make up the chart. R.N. Elliott, who in the 1930s developed the form of analysis that bears his name, viewed the chart as a complex structure of smaller waves nested within larger waves, which in turn are nested within still larger waves. In mathematics it’s called a fractal structure, where at every scale the pattern is similar to the others.
Learning and other resources. Elliott Wave analysis provides context, not prophecy. As the 20th century semanticist Alfred Korzybski put it in his book Science and Sanity (1933), “The map is not the territory … The only usefulness of a map depends on similarity of structure between the empirical world and the map.” And I would add, in the ever-changing markets, we can judge that similarity of structure only after the fact.
See the menu page Analytical Methods for a rundown on where to go for information on Elliott Wave analysis.
By Tim Bovee, Portland, Oregon, May 4, 2026
Disclaimer
Tim Bovee, Private Trader tracks the analysis and trades of a private trader managing his own accounts. The content reflects my interpretation of market structure, including Elliott Wave Theory and related tools.
Nothing in this blog constitutes a recommendation to buy or sell stocks, options, or any other financial instrument, or to pursue any particular strategy. The purpose of this blog is education and entertainment.
No trader is ever 100 percent successful. Trading in stock and options markets involves risk and uncertainty. Each trader must make decisions for his or her own account and accept full responsibility for the outcomes.
Charts and tools are used to support my personal analysis. Any data displayed is illustrative of that analytical process and is not presented as a source of market data for redistribution.
All content on Tim Bovee, Private Trader by Timothy K. Bovee is licensed under a Creative Commons Attribution-ShareAlike 4.0 International License.
License
Based on work at www.timbovee.com

You must be logged in to post a comment.