3:30 p.m. New York time
Half an hour before the closing bell. The S&P 500 futures rose overnight and throughout the session, reaching into the 7290s.
Elliott Wave Theory. I’ve moved the chart closer in to better see the structure of rising wave D{-5}, which has been underway since March 30. Wave D{-5} is a subwave of downward corrective wave 4{-4}, which is taking the form of an Expanding Triangle.
The subwaves of corrective triangles each have three subwaves. I’ve marked one interpretation of the D{-5} subwaves, treating the first pullback of notable size as the end of wave A{-6}, the reversal of the decline as the end of wave B{-6}, and the strong rise that has followed as wave C{-6}, still underway.
It would be just as reasonable to treat the entire rise as wave A{-6}, still underway, and change the waves I marked by moving them one degree smaller: A{-7}, B{-7}, and C{-7}, also still underway.
I realize that it’s starting to sound boring, but: Time will tell.
Decision Points. The futures are now pressing close to the recent high at 7300.75. A move above that level would show that wave D{-5} is still extending and that the upward leg of the Expanding Triangle has not yet finished.
A reversal from this area would not by itself prove that wave E{-5} has begun. The first useful warning would be a decline back below the 7270s, followed by a failure to recover the 7290s. A stronger warning would come from a return below the 7220s, which would erase today’s intraday rise and suggest that the upward pressure inside D{-5} is weakening.
Until that happens, the count remains the same: wave D{-5} is still best treated as underway, but its internal degree remains ambiguous. The map is useful, but the terrain has not yet forced a final choice between the two labels.
9:35 a.m. New York tim
What’s happening now. The S&P 500 E-mini futures continued to climb after yesterday’s session ended, so far reaching into the 7260s.
What does it mean? The overnight high remains below yesterday’s session high, which in turn was below the high point of the Expanding Triangle that began on October 29, 2025. That triangle is declining corrective wave 4{-4}, which has encompassed all that has happened in the S&P 500 in the past seven-plus months.
Elliott Wave Theory analysis tells us that wave 4{-4} is in its next-to-the-last subwave, D{-5}, a rising wave within the falling parent wave 4{-4}. The next wave, declining wave E{-5}, will carry wave 4{-4} to a close.
Expanding Triangles tend to be dramatic. The “Expanding” part means that each rising subwave moves higher than the prior rising subwave, and each falling subwave moves lower than the previous falling subwave.
The chart below tracks wave 4{-4} in its entirety, illustrating that wave D{-5} has already risen higher than wave B{-5}. Wave E{-5} will move below the end of wave C{-5}, at 6353.25.
Decision Points. As long as the futures remain above the upper boundary of the Expanding Triangle, the best working count is that wave D{-5} remains underway. A rise above the recent high at 7300.75 would strengthen that interpretation and show that wave D{-5} is still extending.
A decline into the 7220s would weaken the rise but would not, by itself, prove that wave E{-5} has begun. The first stronger warning would come if the futures returned below the upper boundary of the triangle and the decline began to take the form of a five-wave move. That would suggest the map may be shifting from late-stage D{-5} to the early stages of E{-5}.
Between those levels, ambiguity remains the dominant fact. Price is still high enough to keep wave D{-5} alive, but not strong enough to prove that it has much farther to run.
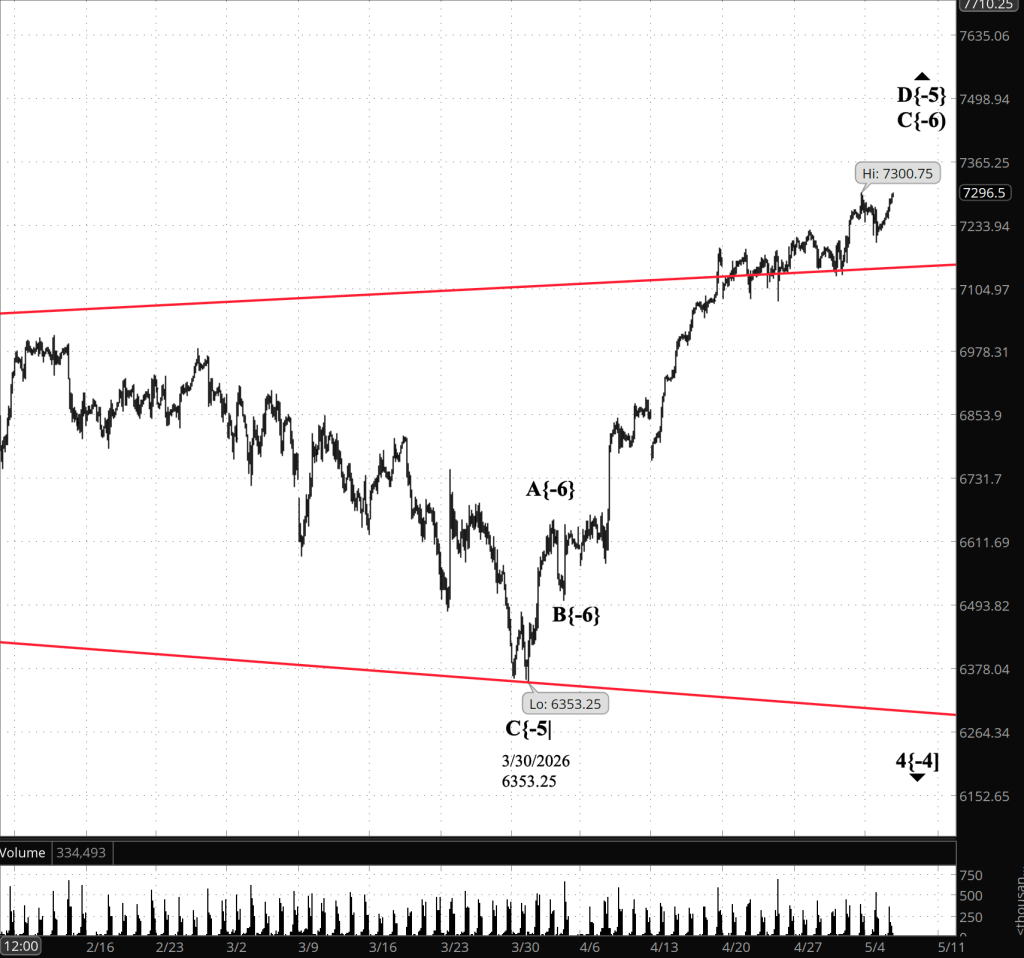
[S&P 500 E-mini futures 3:30 p,m., 5-hour bars with volume]
Waves Now Underway
These are the waves currently in progress under my principal analysis. Each line on the list shows the wave number, with the subscript in curly brackets, the traditional degree name, the starting date, the starting price of the S&P 500 E-mini futures, and the direction of the wave.
- S&P 500 Index:
- 5{+3} Supercycle, 7/8/1932, 4.40 (up)
- 5{+2} Cycle, 12/9/1974, 60.96 (up)
- 5{+1} Primary, 3/6/2009, 666.79 (up)
- 5{0} Intermediate, 2/11/2016, 1810.10 (up)
- 3{-1} Minor, 3/23/2020, 2191.36 (up)
- 1{-2} Minute, 7/31/2025, 6468.50 (down)
- S&P 500 E-mini futures
- 5{-3} Minuette 8/1/2025, 6239.50 (up}
- 4{-4} Subminutte 10/29/2025, 6953.75 (down}
- D{-5} Micro, 3/30/2026, 6353.25 (up}
Reading the chart. Price movements — waves – – in Elliott Wave Theory analysis are labeled with numbers within trending waves and letters with corrective waves. The subscripts — numbers in curly brackets — designate the wave’s degree, which, in Elliott Wave analysis, means the relative position of a wave within the larger and smaller structures that make up the chart. R.N. Elliott, who in the 1930s developed the form of analysis that bears his name, viewed the chart as a complex structure of smaller waves nested within larger waves, which in turn are nested within still larger waves. In mathematics it’s called a fractal structure, where at every scale the pattern is similar to the others.
Learning and other resources. Elliott Wave analysis provides context, not prophecy. As the 20th century semanticist Alfred Korzybski put it in his book Science and Sanity (1933), “The map is not the territory … The only usefulness of a map depends on similarity of structure between the empirical world and the map.” And I would add, in the ever-changing markets, we can judge that similarity of structure only after the fact.
See the menu page Analytical Methods for a rundown on where to go for information on Elliott Wave analysis.
By Tim Bovee, Portland, Oregon, May 5, 2026
Disclaimer
Tim Bovee, Private Trader tracks the analysis and trades of a private trader managing his own accounts. The content reflects my interpretation of market structure, including Elliott Wave Theory and related tools.
Nothing in this blog constitutes a recommendation to buy or sell stocks, options, or any other financial instrument, or to pursue any particular strategy. The purpose of this blog is education and entertainment.
No trader is ever 100 percent successful. Trading in stock and options markets involves risk and uncertainty. Each trader must make decisions for his or her own account and accept full responsibility for the outcomes.
Charts and tools are used to support my personal analysis. Any data displayed is illustrative of that analytical process and is not presented as a source of market data for redistribution.
All content on Tim Bovee, Private Trader by Timothy K. Bovee is licensed under a Creative Commons Attribution-ShareAlike 4.0 International License.
License
Based on work at www.timbovee.com

You must be logged in to post a comment.