Trader’s Notebook

3:30 p.m. New York time

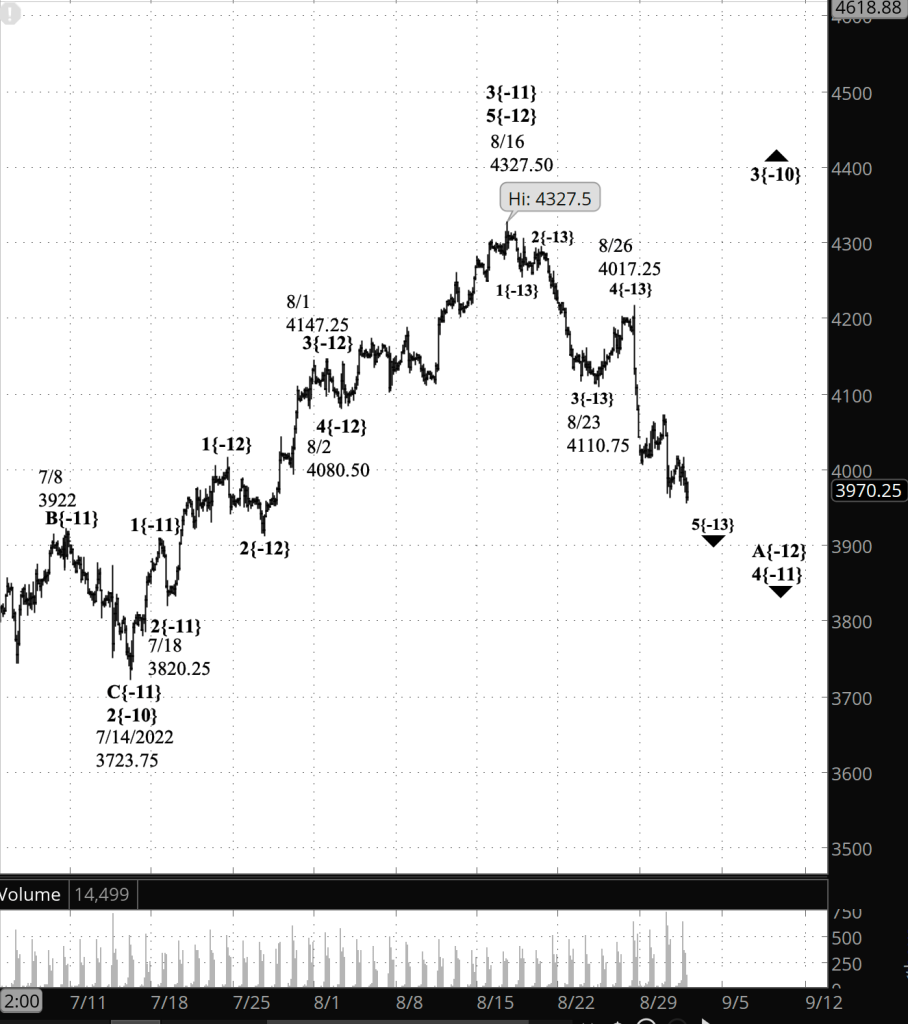
Half an hour before the closing bell. I noted this morning that the S&P 500 was close to violating a rule of Elliott wave analysis under the principal scenario I’ve been working with for the past month or so. And around midday, it did just that, reaching a low of 3903.50. I discussed the rule in question in this morning’s post, below.

When an analysis falls afoul of a rule, it’s not the case that the market got it wrong. It’s that the analysis doesn’t match the reality of the chart. Down toward the end of every Trader’s Notebook I quote the 20th century semanticist Alfred Korzybski, who wrote: “The map is not the territory … The only usefulness of a map depends on similarity of structure between the empirical world and the map.”

And that’s what happened today. The map no longer matched the territory, the empirical world had developed differently, and as is always the case when that happens, it’s time to redraw the map. I’ve retained the chart posted this morning, which shows the earlier analysis, now outdated by the new analysis.

A good basis for any analysis is the adage, “When in doubt, return to the beginning.” The beginning on stock charts in September 2022 is the high of January 4, 2022, which marked the end of a major rise that began on February 23, 2020, the low point of the early pandemic crash.

The decline after January 4 is a major correction within that rise. And within that corrective decline, the market movements are structured as a series of smaller downtrends and upward corrections, as we would expect, given the fractal nature of the market’s charts.

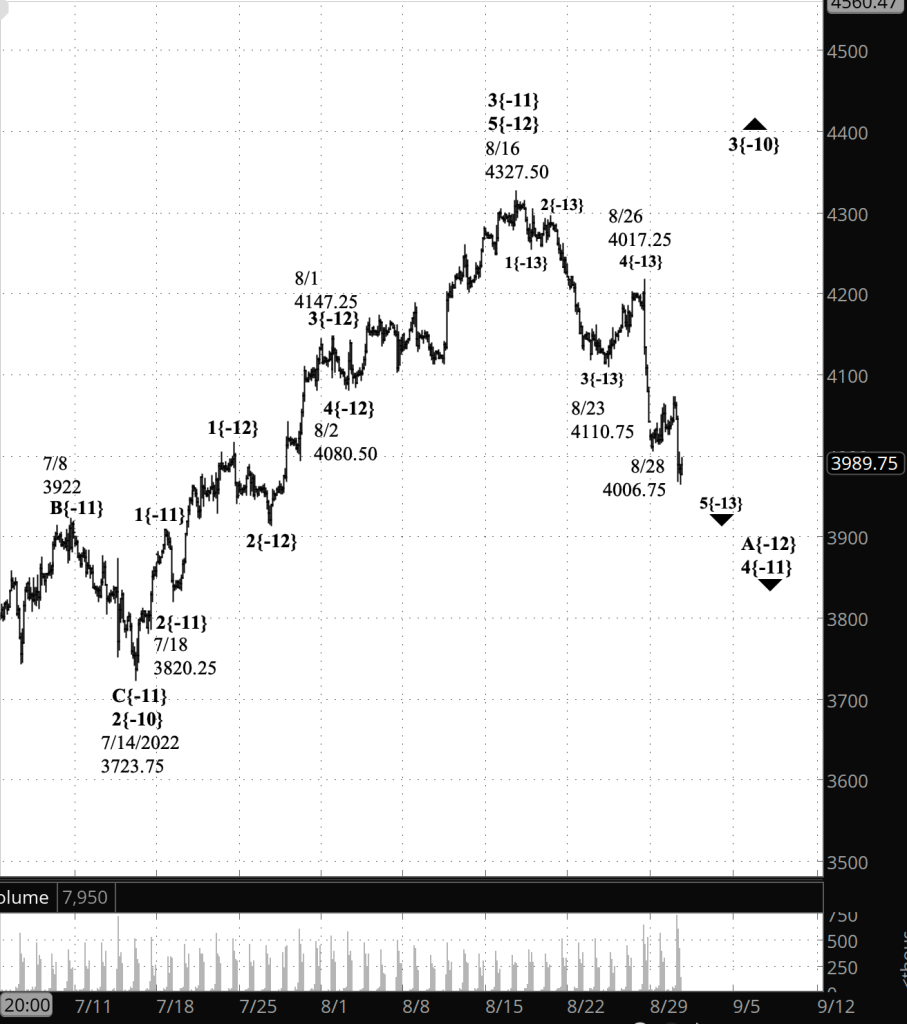
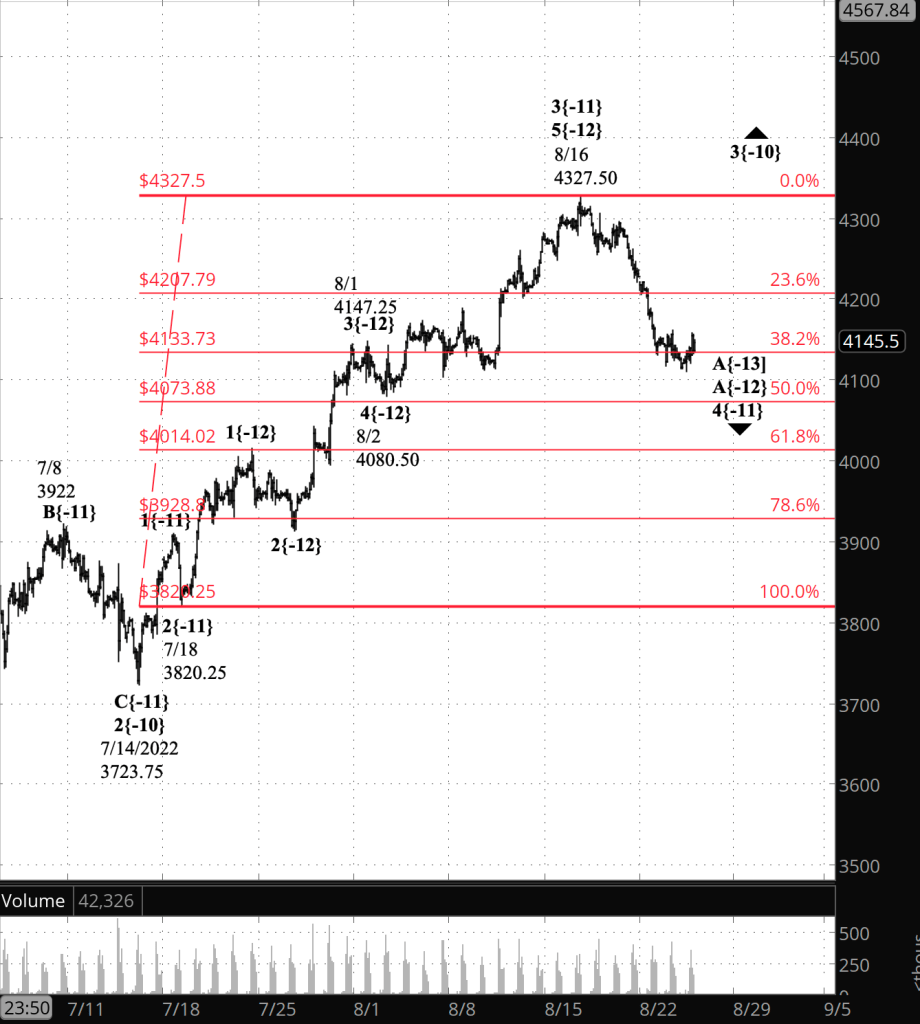
At this point, I’m going to switch to Elliott wave terminology, first posting a chart that shows the S&P 500 E-mini futures from the January 4 peak to the present, marked with the new analysis.

[S&P 500 E-mini futures at 3:30 p.m., 10-hour bars, with volume]

Under my new principal analysis, the downward correction that began on January 4 is wave 4{-1} within a larger expanding Diagonal Triangle, wave 5{0}, which began on December 27, 2018.

Early on in a trend, the degree of the wave being tracked is more or less a guess. I’ve chosen to treat the decline from January 4 to June 16 was wave 1{-6} within wave 4{-1}. The preceding rise, wave 3{-1}, took nearly two years to complete, so the {-6} degree for the first wave down doesn’t seem out of proportion. That may well change as wave 4{-1} continues to unfold.

Wave 1{-6} has been followed by an upward correction, wave 2{-6}, which ended on August 16. Alternatively, the August 16 high could be the end of wave A{-7}, the first leg of the correction.

Under the principal analysis, the decline that began on August 16 is downtrending wave 3{-6}, and internally it is in the middle leg, wave 3{-8} within the larger downtrend, wave 3{-6}.

This is all happening within a nested series of larger 1st waves, from wave 1{-5} up to wave 1{-2}, all of which began on January 4. And of course, above wave 1{-2} is wave 4{-1}, discussed above.

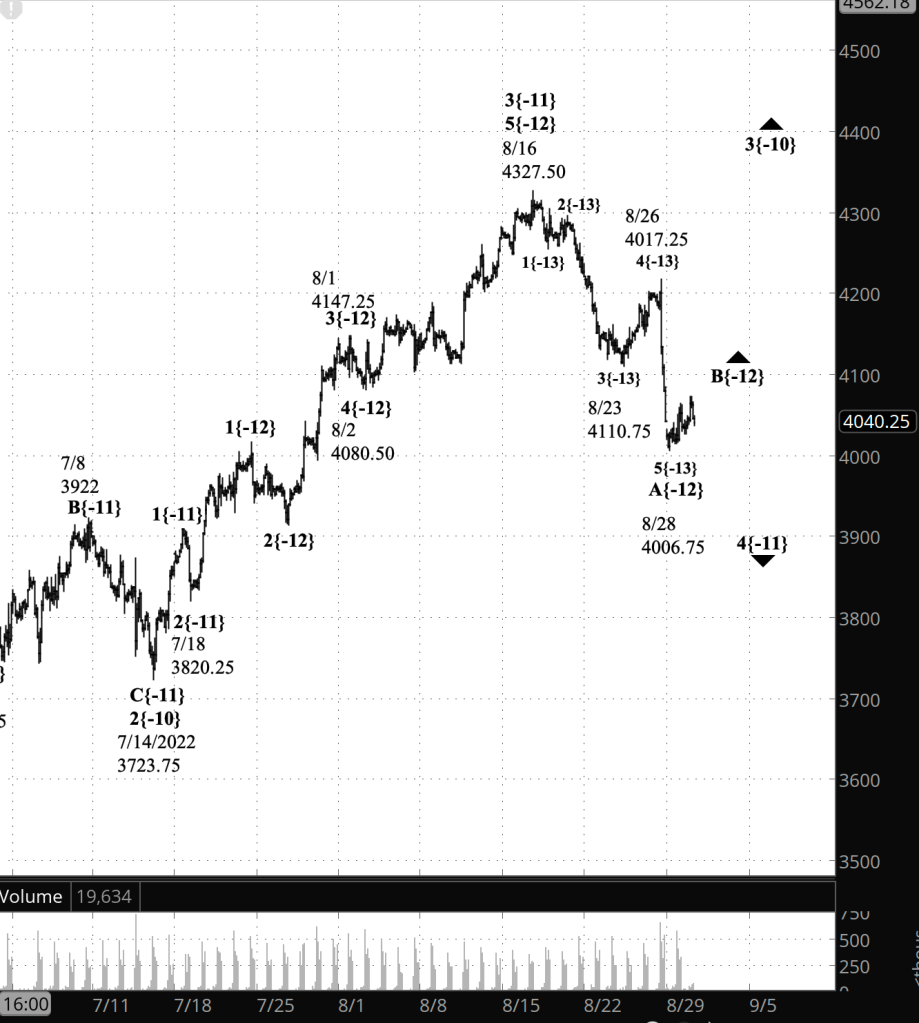
Here is a chart of the S&P 500 index showing the entire expanding Diagonal Triangle that began in December 2018.

[S&P 500 index, 3-day bars, with volume]

Beginning with tomorrow’s Trader’s Notebook, I’ll focus more closely on understanding the new analysis of the internals of the decline that began on August 16.

10 a.m. New York time

NTNX earnings play exit. I’ve exited my short bull put options spread on NTNX for 66.3% of maximum potential profit and have updated the trade analysis with full results.

9:35 a.m. New York time

What’s happening now? The S&P 500 E-mini futures fell further overnight, reaching a low of 3921.

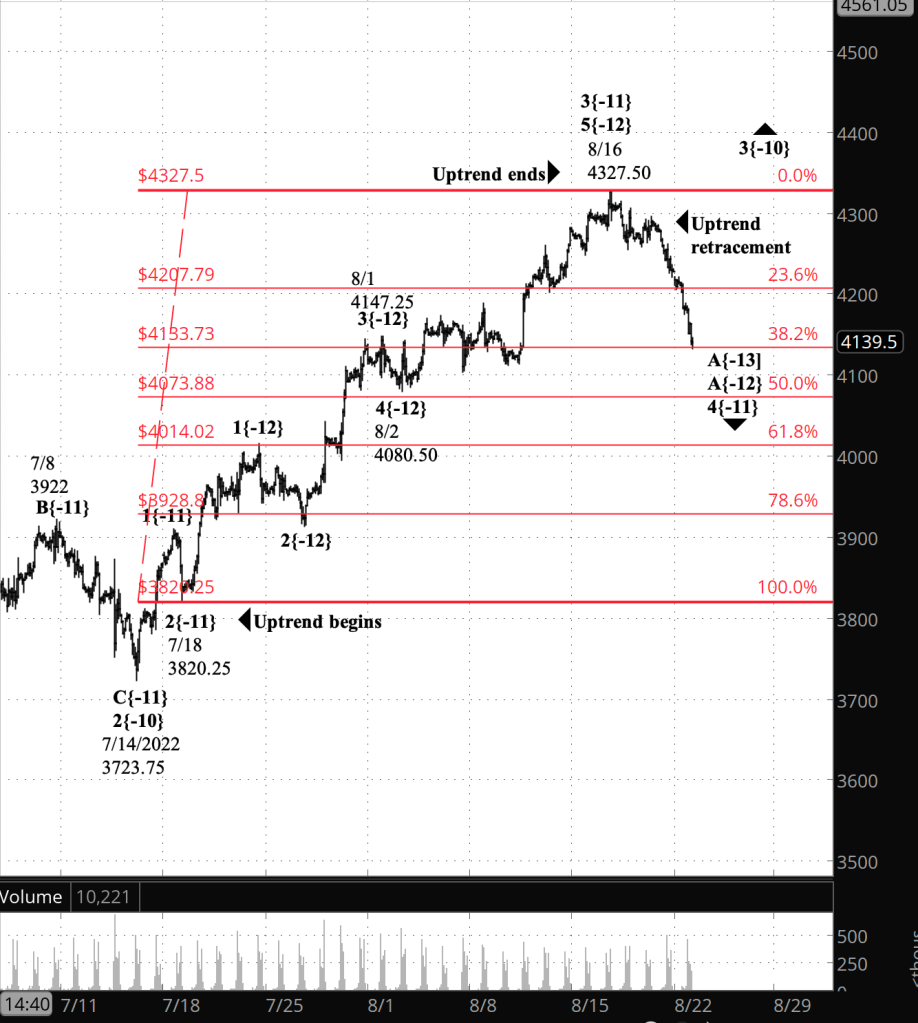
What does it mean? The downtrend within a downward correction that began on August 16 continues.

What are the alternatives? The preceding uptrend that began on July 14 ended on August 16 and the subsequent decline is a downtrend of higher degree than the principal analysis would have it.

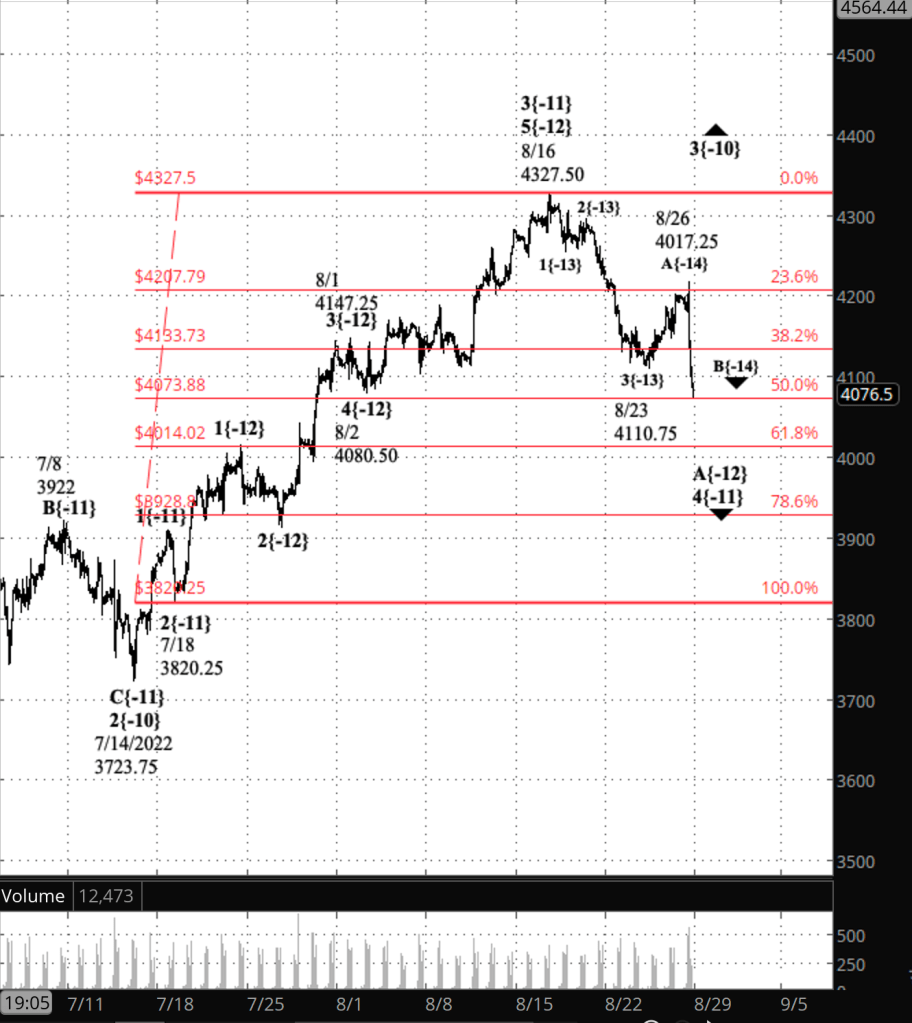
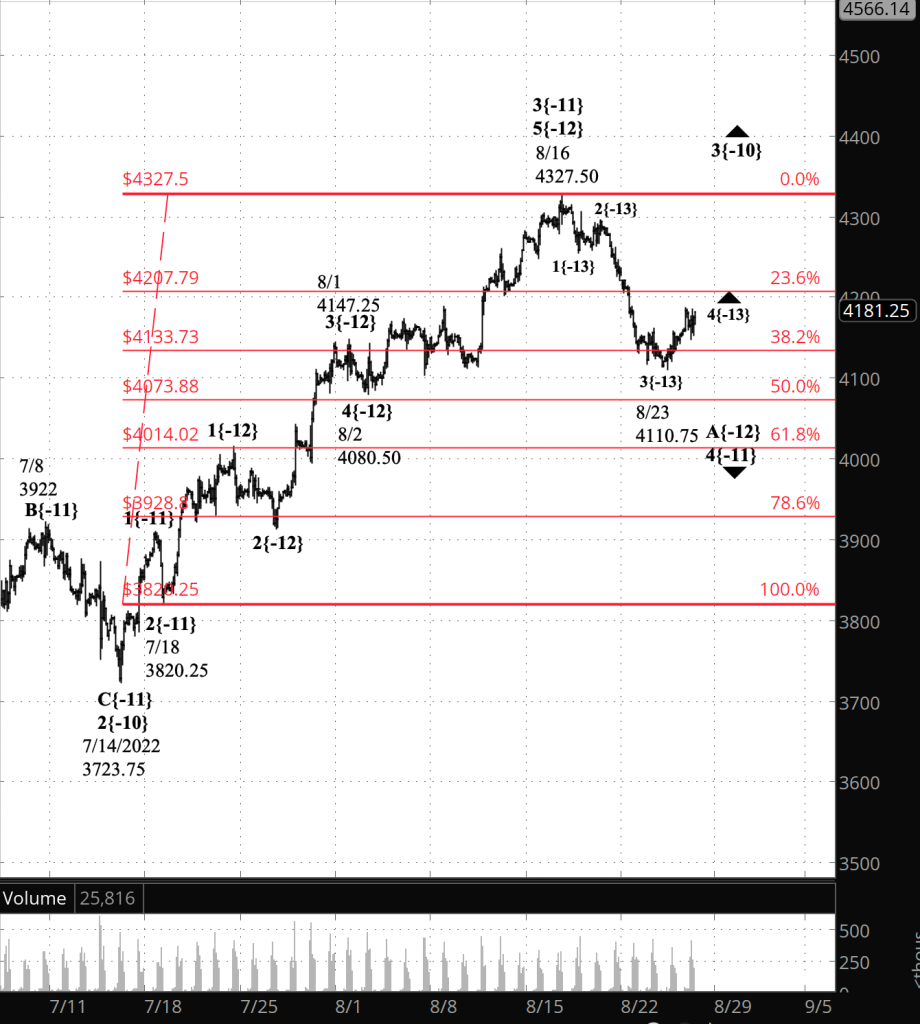
The chart. I’ve added in the Fibonacci retracement ladder, in red, showing that the retracement has reached the 78.6% level.

[Outdated analysis: S&P 500 E-mini futures at 9:35 a.m., 2-hour bars, with volume]

What does Elliott wave theory say? Under the principal analysis, wave 4{-11} within uptrending wave 3{-10}, a downward retracement, has been underway since August 16. A 78.6% retracement is deep for a 4th wave. Typically, this 4th wave would have ended around the 38.2% to 50% retracements. But that’s a tendency, not a rule, and the analysis complies with the rules of Elliott wave analysis.

There are very few rules that apply to 4th waves. One is that it cannot move past the end of the preceding wave 1, which was at 3909.50 in this case — wave 1{-11} on July 18. The overnight low is only 11.5 points above that level, which means that wave 4{-11}, under the principal analysis, is perilously close to breaking an Elliott rule. If it does, then the alternative analysis normally would replace the present principal analysis.

Under the alternative analysis, the August 16 peak was the end of wave 5{-11} within wave 3{-10}. That is, the internal count of the rise from July 14 to August 16 would be revised. the subsequent decline is wave 4{-10}. However, wave 4{-10} under this scenario has moved beyond the end of wave 1{-10}, which peaked on June 28 at 3950, breaking a rule of Elliott wave analysis.

So the count will have to be revised in some other way. Figuring that out is my project for today.

Learning and other resources. Elliott wave analysis provides context, not prophecy. As the 20th century semanticist Alfred Korzybski put it in his book Science and Sanity (1933), “The map is not the territory … The only usefulness of a map depends on similarity of structure between the empirical world and the map.” And I would add, in the ever-changing markets, we can judge that similarity of structure only after the fact.

See the menu page Analytical Methods for a rundown on where to go for information on Elliott wave analysis.

By Tim Bovee, Portland, Oregon, September 1, 2022

Disclaimer

Tim Bovee, Private Trader tracks the analysis and trades of a private trader for his own accounts. Nothing in this blog constitutes a recommendation to buy or sell stocks, options or any other financial instrument. The only purpose of this blog is to provide education and entertainment.

No trader is ever 100 percent successful in his or her trades. Trading in the stock and option markets is risky and uncertain. Each trader must make trading decisions for his or her own account, and take responsibility for the consequences.

License
Creative Commons License

All content on Tim Bovee, Private Trader by Timothy K. Bovee is licensed under a Creative Commons Attribution-ShareAlike 4.0 International License.

Based on a work at www.timbovee.com.

NTNX Trade

Nutanix Inc. (NTNX)

Update 9/1/2022: I exited my short bull put vertical spread on NTNX, 50 days before expiration, for a $0.32 debit per contract/share, a profit before fees of $63 per contract. Shares were trading at $21.50, up $3.83 from the entry level.

The Implied Volatility Rank at exit was 51.3%, down 27.9 points from the entry level.

I exited on the day after entry because the position reached 66.3% of maximum potential profit, well above the 25% of max that is my normal exit point for earnings plays.

Shares rose by 21.7% over one day for a +7,911% annual rate. The options position produced a 196.9% return for a +71,859% annual rate.


I have entered a short bull put vertical spread on NTNX, using options that trade for the last time 51 days hence, on October 21. The premium is a $0.95 credit per contract share and the stock at the time of entry was priced at $17.67.

The Implied Volatility Ratio stood at 79.2%.

Premium:$0.95Expire OTM
NTNX-bull put spreadStrikeOddsDelta
Puts
Long15.0067.2%22
Break-even18.4557.6%31
Short17.5048.0%40

The premium is 76% of the width of the position’s short/long spread. The profit zone covers a 4.4% move to the downside and an unlimited move to the upside.

The risk/reward ratio is 1.6:1, with maximum risk of $155 and maximum reward of $95 per contract.

How I chose the trade. The trade was placed to coincide with NTNX’s earnings announcement, after the closing bell on the day of entry. The short strikes were set to coincide with the expected move of $0.76 either way, based on options pricing, which gives a price range of $17.37 to $18.88. The Zacks Investment Research earnings surprise predictor gave NTNX a score of 4.66%, with a rank of 3. The Zacks momentum and overall style scores were both C.

By Tim Bovee, Portland, Oregon, August 31, 2022

Disclaimer

Tim Bovee, Private Trader tracks the analysis and trades of a private trader for his own accounts. Nothing in this blog constitutes a recommendation to buy or sell stocks, options or any other financial instrument. The only purpose of this blog is to provide education and entertainment.

No trader is ever 100 percent successful in his or her trades. Trading in the stock and option markets is risky and uncertain. Each trader must make trading decisions for his or her own account, and take responsibility for the consequences.

License
Creative Commons License

All content on Tim Bovee, Private Trader by Timothy K. Bovee is licensed under a Creative Commons Attribution-ShareAlike 4.0 International License.

Based on a work at www.timbovee.com.

Trader’s Notebook

3:30 p.m. New York time

Half an hour before the closing bell. The S&P 500 continued to fall during the session, reaching beyond the overnight low down to 3956.50 on the futures. No change in the analysis. Downward wave 5{-13} with wave A{-12} within 4{-11} is still underway. I’ve updated the chart.

1 p.m. New York time

NTNX earnings play entry. I’ve entered a short bull put vertical spread on NTNX, using options that trade for the last time on October 21, and have posted an analysis of the trade.

9:35 a.m. New York time

What’s happening now? The S&P 500 E-mini futures reached a low overnight of 3979.25 and then bounced slightly.

What does it mean? The sharp price drop that began on August 26 continues, although at a more moderate pace.

What are the alternatives? There are two.

Alternative #1: The overnight low was the end of the price drop and an uptrend is underway.

Alternative #2: The uptrend that began on June 14 ended on August 16 and a larger downward movement is underway.

[S&P 500 E-mini futures at 3:30 p.m., 2-hour bars, with volume]

What does Elliott wave theory say? Under the principal analysis, downward wave 5{-13} within wave A{-12} within wave 4{-11}, a downward correction, is underway. It will be followed by a B wave to the upside, and then a continuation of the correction with a C wave to the downside.

Under the first alternative analysis, the overnight low marked the end of wave 4{-11}, and uptrending wave 5{-11} is now underway and will reach into the 4300s.

Under the second alternative, the August 16 peak was the end of wave 5{-11} and its parent, wave 3{-10}, which began on July 14. This scenario sees a downward correction, wave 4{-10}, as being underway.

Learning and other resources. Elliott wave analysis provides context, not prophecy. As the 20th century semanticist Alfred Korzybski put it in his book Science and Sanity (1933), “The map is not the territory … The only usefulness of a map depends on similarity of structure between the empirical world and the map.” And I would add, in the ever-changing markets, we can judge that similarity of structure only after the fact.

See the menu page Analytical Methods for a rundown on where to go for information on Elliott wave analysis.

By Tim Bovee, Portland, Oregon, August 31, 2022

Disclaimer

Tim Bovee, Private Trader tracks the analysis and trades of a private trader for his own accounts. Nothing in this blog constitutes a recommendation to buy or sell stocks, options or any other financial instrument. The only purpose of this blog is to provide education and entertainment.

No trader is ever 100 percent successful in his or her trades. Trading in the stock and option markets is risky and uncertain. Each trader must make trading decisions for his or her own account, and take responsibility for the consequences.

License
Creative Commons License

All content on Tim Bovee, Private Trader by Timothy K. Bovee is licensed under a Creative Commons Attribution-ShareAlike 4.0 International License.

Based on a work at www.timbovee.com.

Trader’s Notebook

3:30 p.m. New York time

Half an hour before the closing bell. The rise overnight proved to be a bump within the sharp decline that began on August 26. In today’s session the price reached a low of 3964.50 on the futures. The first leg of the downward correction that began on August 16 — wave A{-12} within wave 4{-11} — is still underway. That first leg is in turn in its last segment, wave 5{-13}. I’ve added an afternoon the chart, retaining this morning’s chart for comparison

[S&P 500 E-mini futures at 3:30 p.m., 2-hour bars, with volume]

9:35 a.m. New York time

What’s happening now? The S&P 500 E-mini futures rose overnight, returning to the 4070s after reaching a low on August 28 of 4006.75.

What does it mean? The rising second leg of a downward correction that began on August 16 is now underway. The correction is taking a Zigzag pattern, and so the price will remain below the start of the correction, 4327.50.

What is the alternative? The entire rise from July 14 to August 16, which I’ve labeled as the middle wave of an uptrend, may in fact be the final wave. If so, then the decline that followed is a downtrend rather than being part of a downward correction.

[S&P 500 E-mini futures at 9:35 a.m., 2-hour bars, with volume]

What does Elliott wave theory say? Under the principal analysis, the rise from August 28 is wave B{-12} within wave 4{-11}, the downward correction that began on August 16 from 4327.50, the peak of wave 3{-11}. The first leg of correction, wave A{-12}, has five waves internally, so the correction is most likely taking the form of a Zigzag. The B wave of a Zigzag typically retraces 38% to 79% of the preceding A wave, giving a rather broad target range of 4129 to 4260, more or less. The overnight high was 4072.75.

Under the alternative analysis, the August 16 peak marked the end of wave 5{-11}, and the decline that followed is the early stage of wave 4{-10}, whose preceding 3rd wave began on July 14.

Learning and other resources. Elliott wave analysis provides context, not prophecy. As the 20th century semanticist Alfred Korzybski put it in his book Science and Sanity (1933), “The map is not the territory … The only usefulness of a map depends on similarity of structure between the empirical world and the map.” And I would add, in the ever-changing markets, we can judge that similarity of structure only after the fact.

See the menu page Analytical Methods for a rundown on where to go for information on Elliott wave analysis.

By Tim Bovee, Portland, Oregon, August 30, 2022

Disclaimer

Tim Bovee, Private Trader tracks the analysis and trades of a private trader for his own accounts. Nothing in this blog constitutes a recommendation to buy or sell stocks, options or any other financial instrument. The only purpose of this blog is to provide education and entertainment.

No trader is ever 100 percent successful in his or her trades. Trading in the stock and option markets is risky and uncertain. Each trader must make trading decisions for his or her own account, and take responsibility for the consequences.

License
Creative Commons License

All content on Tim Bovee, Private Trader by Timothy K. Bovee is licensed under a Creative Commons Attribution-ShareAlike 4.0 International License.

Based on a work at www.timbovee.com.

Trader’s Notebook

3:30 p.m. New York time

Half an hour before the closing bell. The S&P 500 has risen during the session, reaching a high so far of 4064 on the futures, nearly 60 points above the overnight low. The rise carried the price from 61.8% retracement of the rise from July 18 to August 16 up to near the 50% retracement level of that rise. In Elliott wave analysis terms, wave 5{-13} may have ended its decline at the overnight low. If so, then the subsequent rise the beginning of wave B{-12}. That’s have I’ve updated the chart. If not, then the rise is a bump during wave 5{-13}’s continuing decline.

9:35 a.m. New York time

What’s happening now? The S&P 500 E-mini futures opened nearly 20 points below Friday’s close when trading resumed Sunday evening. The price then traded overnight in a narrow range with a slight downward tilt, bringing the price to a low so far of 4006.75.

What does it mean? Because of the power and length of Friday’s steep fall, I’ve redone the analysis of the rise and fall that began on August 23. Under the new principal analysis, the rise that ended on August 26 is an upward correction of small degree, the next to the last part of a downward movement that began on August 16. The decline that followed is the final portion of that downtrend, which is itself the first leg of a larger downward correction. See the Elliott wave theory section for more detail.

What are the alternatives? There are two.

Alternative #1: It’s still possible that Friday’s principal analysis, now discarded, was in fact correct. That scenario labelled the rise that ended on August 26 as the first leg of the upward correction. Under this labeling, the subsequent swift decline would be the second leg, and a quick reversal to the upside would be the third leg.

Alternative #2: Another alternative changes the labeling of the entire rise from July 14 as having reached completion on August 16, and the decline that followed as being the early stages of a downtrend rather as a portion of a downward correction.

[S&P 500 E-mini futures at 3:30 p.m., 115-minute bars, with volume]

What does Elliott wave theory say? Under the principal analysis, Friday’s sharp decline, which fell further to 4006.75 overnight, is wave 5{-13}, the final wave within wave A{-12}, which is itself the first leg of a downward correction, wave 4{-11}, that began on August 16. Wave A{-12} will be followed by upward wave B{-12}, the second wave of the wave 4{-11} correction, and then downward wave C{-12}, which will bring the correction to completion. Some corrections form compound structures, and if that’s the cases here, then wave C{-12} will be followed by a second corrective pattern.

Under this scenario, wave A{-12} has reached a Fibonacci level that retraces 61.8% of wave 3{-11}, which ran from July 18 to August 16. A 61.8% retracement is one of the most common that I’ve seen while working with Elliott wave theory, and a reversal from that point would lend credence to the principal analysis.

Under the first alternative, the rise that ended August 26 was the end of wave A{-14}, the first leg of an upward correction, wave 4{-13}, that began on August 23. The decline that began on Friday is wave B{-14}, and it will be followed by a rise, wave C{-14}, that will complete the correction, unless it extends in a compound structure. Wave 4{-13} will be followed by a decline, wave 5{-13}, that will complete the parent, wave A{-12}, and it will be followed by uptrending wave B{-12}, the middle wave the downward correction, wave 4{-11}, which began on August 16. Basically, this scenario moves the wave labeling of the principal analysis up by one degree.

The second alternative makes a larger change to the chart. Under this scenario, the August 16 peak is the end of wave 5{-11} and its parent, wave 3{-10}, an uptrend that began on July 14. The subsequent decline is wave 4{-10}. This scenario moves the wave labeling still higher.

At a larger level, the S&P 500 is in a downtrend of large degree, wave 4{-1}, which began on January 4 from 4808.25 and which will be with us into 2023 and perhaps into 2024.

That’s a lot of ambiguity, and I’m not confident that the principal analysis is indeed the most likely of the three. As always, the charts movements to come will make things clear.

And what all three scenarios have in common is that 1) the S&P 500 is in a downward correction that will be a followed by a rise back into the 4300s.

At a larger level, the S&P 500 is in a downtrend of large degree, wave 4{-1}, which began on January 4 from 4808.25 and which will be with us into 2023 and perhaps into 2024.

So, longer term, think downward thoughts. Elliott wave analysis shows that this is not a bull market, and won’t be one for some time to come.

Learning and other resources. Elliott wave analysis provides context, not prophecy. As the 20th century semanticist Alfred Korzybski put it in his book Science and Sanity (1933), “The map is not the territory … The only usefulness of a map depends on similarity of structure between the empirical world and the map.” And I would add, in the ever-changing markets, we can judge that similarity of structure only after the fact.

See the menu page Analytical Methods for a rundown on where to go for information on Elliott wave analysis.

By Tim Bovee, Portland, Oregon, August 29, 2022

Disclaimer

Tim Bovee, Private Trader tracks the analysis and trades of a private trader for his own accounts. Nothing in this blog constitutes a recommendation to buy or sell stocks, options or any other financial instrument. The only purpose of this blog is to provide education and entertainment.

No trader is ever 100 percent successful in his or her trades. Trading in the stock and option markets is risky and uncertain. Each trader must make trading decisions for his or her own account, and take responsibility for the consequences.

License
Creative Commons License

All content on Tim Bovee, Private Trader by Timothy K. Bovee is licensed under a Creative Commons Attribution-ShareAlike 4.0 International License.

Based on a work at www.timbovee.com.

Trader’s Notebook


3:30 p.m. New York time

Half an hour before the closing bell. The S&P 500 has continued to fall, reaching into the 4070s on the futures as the closing bell. approached. All that has transpired is part of a larger downward correction of the rise from July 18 to August 16. Today’s decline carried the correction from the 23.6% Fibonacci retracement level to the 50% retracement level. (The Fibonacci ladder is shown on the chart in red.)

I’ve updated the upper chart.

1:30 p.m. New York time

Falling Down Jackson Hole. The S&P 500 fell sharply from an hour before Lewis Powell, the Federal Reserve Chair, began his remarks at the Fed’s symposium in Jackson’s Hole, Wyoming. The price on the futures peaked at 4217.25 at 9 a.m., and reached its low of the day — so far — at 4099.25, about three hours later. A 118-point plunge — not bad for an 11-minute speech.

The decline introduced huge ambiguity onto the chart. In Elliott wave terminology: The decline either (scenario 1) ended rising wave A{-14} within wave 4{-13}, an upward correction that began on August 23, or (scenario 2) it ended that correction entirely.

Scenario 1 will require that wave 4{-13} take the form of a Flat within wave A{-14}. The reason is that the Jackson’s Hole decline, wave B{-14}, carried the price below the start of wave 4{-13}, and that breaks a firm rule of behavior for a Zigzag corrective pattern. A Flat corrective pattern can move below that level within the rules of Elliott wave analysis.

The A wave within a Zigzag has five waves internally. Within a Flat, the A wave has three waves internally. I count five waves within wave A{-14}, which this morning was how I labeled the rise from August 23 to August 26 (today). That’s scenario 1. However, scenario 2 — today’s high marks the end of wave 4{-13} in its entirely — also requires three waves for the August 23 to August 26 rise.

Basically, we’re left with two bad choices with no way to distinguish between them.

If I squint my eyes and suspend my disbelief, I can sort of see three waves within that rise, if I treat the first very small bump up and retreat as being a wave of a lower degree. And so that’s what I’ll do, and in doing so, it makes more sense to see today’s high as the end of the A wave, with the parent 4th wave correction still underway: Scenario 1.

That’s the minimum necessary change to resolve the contradictions, and that’s how I’ve updated the upper chart. Wave B{-14} with wave 4{-13} is now underway.

9:35 a.m. New York time

What’s happening now? The S&P 500 E-mini futures traded narrowly overnight, fluctuating from the 4180s to the 4210s. Federal Reserve Chair Jerome Powell is scheduled to speak at the agency’s Jackson Hole Wyoming symposium at 10 a.m., half an hour after the opening bell, a venue closely watched for clues to the Federal Open Market Committee’s intentions regarding interest rates.

What does it mean? The downward correction that began on August 16 is still underway and is in its first of three legs. Internally, the first leg is in its 4th segment, a rising correction that will be followed by a 5th, declining wave. The first leg will be followed by the rising 2nd leg.

What is the alternative? At this point I see little ambiguity in the chart, although I’m certain that ambiguities will develop, as they as always do.

The charts. The upper chart shows the S&P 500 futures dating back to July. the lower chart shows the S&P 500 index and the expanding Diagonal Triangle, which has been underway since December 2018 and which is now in its 4th subwave.

[S&P 500 E-mini futures at 3:30 p.m., 115-minute bars, with volume]

What does Elliott wave theory say? The downward correction, wave 4{-11}, is in its first wave, falling wave A{-12}, which in turn is in its next to the last segment, rising wave 4{-13}. When wave 4{-13} is complete, it will be followed by falling wave 5{-13}, which will complete wave A{-12}. Rising wave B {-12} will follow, retracing a portion of the wave A{-12} decline, and then declining wave C{-12} will follow, completing the corrective pattern.

This is all happening within wave 3{-10}, an uptrending wave that began on July 14. Looking at the longer term, the S&P 500 has been in a large downward movement, wave 4{-1}, since January 4. It is the next to the last wave of an expanding Diagonal Triangle, wave 5{0}, which began on December 26, 2018.

To give some idea of scale of the triangle, rising wave 1{-1} took 14 months to reach completion, wave 2{-1} — the early pandemic crash — was over in four days, and rising wave 3{-1} stretched out for nearly two years. Most likely, wave 4{-1} will carry us to 2023 and perhaps later by a year. Or two.

[S&P 500 index at 9:30 a.m., 3-day bars]

Learning and other resources. Elliott wave analysis provides context, not prophecy. As the 20th century semanticist Alfred Korzybski put it in his book Science and Sanity (1933), “The map is not the territory … The only usefulness of a map depends on similarity of structure between the empirical world and the map.” And I would add, in the ever-changing markets, we can judge that similarity of structure only after the fact.

See the menu page Analytical Methods for a rundown on where to go for information on Elliott wave analysis.

By Tim Bovee, Portland, Oregon, August 26, 2022

Disclaimer

Tim Bovee, Private Trader tracks the analysis and trades of a private trader for his own accounts. Nothing in this blog constitutes a recommendation to buy or sell stocks, options or any other financial instrument. The only purpose of this blog is to provide education and entertainment.

No trader is ever 100 percent successful in his or her trades. Trading in the stock and option markets is risky and uncertain. Each trader must make trading decisions for his or her own account, and take responsibility for the consequences.

License
Creative Commons License

All content on Tim Bovee, Private Trader by Timothy K. Bovee is licensed under a Creative Commons Attribution-ShareAlike 4.0 International License.

Based on a work at www.timbovee.com.

Trader’s Notebook

3:30 p.m. New York time

Half an hour before the closing bell. The S&P 500 has traded narrowly during the session, from the 4140s to the 4180s on the futures. The downward correction, wave 4{-11}, continues. No change in the analysis. I’ve updated the chart.

9:35 a.m. New York time

What’s happening now? The S&P 500 E-mini futures rose in overnight trading, reaching a high of 4187.75, nearly 80 points above the August 23 low,4110.75, and then reversed to the downside slightly.

What does it mean? This gets a bit complicated because of the fractal nature of the structure. It involves three degrees of size, from the smallest to the largest. The August 23 low was the end of the downward middle subwave within the larger downward first subwave within the downward correction that began on August 16.

What is the alternative? It’s possible to count the internal movement within the first subwave as being complete at the August 23 low. If that proves to be the case, then the second subwave within the larger correction is now underway.

[S&P 500 E-mini futures at 3:30 p.m., 110-minute bars, with volume]

What does Elliott wave theory say? A downward correction, wave 4{-11}, has been underway since August 16 and is taking the form of a Zigzag. A Zigzag correction has three internal waves: A, with five waves within it; B, with three internal waves, and C, with five waves internally.

Under the principal analysis, the first leg of the correction, wave A{-12}, is underway. The August 23 low marked the end of wave 3{-13}, the middle wave of wave A{-12}’s five-wave structure. Wave 4{-13} will be followed by wave 5{-13}, the final wave within A{-12}. It would be reasonable to expected wave 5{-13} to carry the price down to the 50% Fibonacci retracement level, around 4074. (The Fibonacci retracement ladder is shown in red on the chart.)

Under the alternative analysis, the August 23 low was the end of wave 5{-13} and also the end of its parent, wave A{-12}. Under this scenario, wave B{-12} is now underway.

The principal analysis seems more proportional to me. Under the alternative analysis, a quite shallow reversal on August 22 is the 4th wave within A{-12} and is followed by an extremely small 5th wave. There’s no rule against it in Elliott wave analysis, but I think the more proportional reading of the chart, as the principal analysis has it, is more likely to be the correct interpretation.

In any case, wave B{-12} will be followed by downward wave C{-12}, which may fall below the wave A{-12} low and which will complete its parent, wave 4{-11}.

This is all happening within uptrending wave 3{-10}, which began on July 14 from 3723.75. When wave 4{-11} is complete, wave 5{-11} will most likely carry wave 3{-10} above August 16 high, 4327.50, and it will remain below the January 4 high, 4808.75, the beginning of wave 4{-1}, a major downward movement that may not be complete until 2023 or 2024.

Learning and other resources. Elliott wave analysis provides context, not prophecy. As the 20th century semanticist Alfred Korzybski put it in his book Science and Sanity (1933), “The map is not the territory … The only usefulness of a map depends on similarity of structure between the empirical world and the map.” And I would add, in the ever-changing markets, we can judge that similarity of structure only after the fact.

See the menu page Analytical Methods for a rundown on where to go for information on Elliott wave analysis.

By Tim Bovee, Portland, Oregon, August 25, 2022

Disclaimer

Tim Bovee, Private Trader tracks the analysis and trades of a private trader for his own accounts. Nothing in this blog constitutes a recommendation to buy or sell stocks, options or any other financial instrument. The only purpose of this blog is to provide education and entertainment.

No trader is ever 100 percent successful in his or her trades. Trading in the stock and option markets is risky and uncertain. Each trader must make trading decisions for his or her own account, and take responsibility for the consequences.

License
Creative Commons License

All content on Tim Bovee, Private Trader by Timothy K. Bovee is licensed under a Creative Commons Attribution-ShareAlike 4.0 International License.

Based on a work at www.timbovee.com.

Trader’s Notebook

3:30 p.m. New York time

Half an hour before the closing bell. The S&P 500 has worked its way higher during the session, reaching into the 4150s on the futures. The rise isn’t enough to draw any conclusions about whether the first leg of the downward correction that began on August 16 is complete. That’s wave A{-12} within wave 4{-11}. So, no change in the analysis. I’ve updated the chart.

9:35 a.m. New York time

What’s happening now? The S&P 500 E-mini futures continued to trade in a narrow range overnight, falling to 4110.25 and then reversed, reaching back into the 4140s,

What does it mean? The downward correction that began on August 16 continues and is in its first of what will likely be three legs. When complete, the first leg will be followed by a rise that will remain below the August 16 peak, 4327.50, and then will fall again. If the correction forms the common three-leg pattern, then that fall will be the end of the correction and a rise that will probably reach above the August 16 peak.

What is the alternative? Each lower low could be the end of that first leg decline. The higher any reversal travels, the more likely it is that the alternative analysis best matches the chart.

[S&P 500 E-mini futures at 3:30 p.m., 110-minute bars, with volume]

What does Elliott wave theory say? Wave 4{-11}, a downward correction, began on August 14 from 4327.50. Internally, under the principal analysis, it is in the late stages of wave A{-12}, the first wave of the correction. Fourth waves tend to take the three-wave Flat pattern, with three waves within wave A, three within B and five within C (3-3-5).

The price has spent two trading sessions trading narrowly around the 38.2% Fibonacci retracement level (the Fibonacci ladder is shown on the chart in red). The most common end points for 4th wave are retracement levels 38.2%, 50% and 61.8%. Typically, the end point will be reached within the third subwave of the correction, wave C{-12} in this case.

Fourth waves tend to end within the range of the 4th subwave of the preceding 3rd-wave rise. Wave 4{-12} within wave 3{-11} ran from 4147.25 to 4080.50, so wave A{-12} is already within that range.

Wave 4{-11} will be followed by uptrending wave 5{-11}, which likely will carry the wave above 4327.50, the starting point of wave 4{-11}. Fifth waves sometimes fall short of that level, in which case it’s called a “truncated 5th”. Other times 5th waves add subwaves and rise higher, sometimes to extraordinary heights, in which case it’s called an “extended 5th”.

In any case, wave 5{-11} will remain below the January 4 high, 4808.25, which was the beginning of a major downward wave of much higher degree, wave 4{-1}.

Bottom line: We have some upside ahead but the future beyond that is a major downer, with the usual smaller ups and downs along the way.

Learning and other resources. Elliott wave analysis provides context, not prophecy. As the 20th century semanticist Alfred Korzybski put it in his book Science and Sanity (1933), “The map is not the territory … The only usefulness of a map depends on similarity of structure between the empirical world and the map.” And I would add, in the ever-changing markets, we can judge that similarity of structure only after the fact.

See the menu page Analytical Methods for a rundown on where to go for information on Elliott wave analysis.

By Tim Bovee, Portland, Oregon, August 24, 2022

Disclaimer

Tim Bovee, Private Trader tracks the analysis and trades of a private trader for his own accounts. Nothing in this blog constitutes a recommendation to buy or sell stocks, options or any other financial instrument. The only purpose of this blog is to provide education and entertainment.

No trader is ever 100 percent successful in his or her trades. Trading in the stock and option markets is risky and uncertain. Each trader must make trading decisions for his or her own account, and take responsibility for the consequences.

License
Creative Commons License

All content on Tim Bovee, Private Trader by Timothy K. Bovee is licensed under a Creative Commons Attribution-ShareAlike 4.0 International License.

Based on a work at www.timbovee.com.

Trader’s Notebook

3:30 p.m. New York time

Half an hour before the closing bell. The S&P 500 has traded in a narrow range during the session, sticking close to the 38.2% Fibonacci retracement level, in the 4730s on the futures. The analysis is unchanged. I’ve updated the chart.

9:35 a.m. New York time

What’s happening now? The S&P 500 E-mini futures continued to fluctuate around the 38.2% Fibonacci retracement level in overnight trading, hitting a low of 4118.

What does it mean? The downward correction that began on August 16 continues and is in the first of three legs. In my experience, three Fibonacci retracement levels are most likely to be pause or reversal points in retracements: The 38.2% level, the 50% and the 61.8%.

What is the alternative? So far it’s unclear whether this pause will turn into a reversal or not. The low is within the correction’s target range. If it’s a reversal, then the second (middle) leg of the correction will begin, or has begun already.

[S&P 500 E-mini futures at 3:30 p.m., 100-minute bars, with volume]

What does Elliott wave theory say? The downward correction, wave 4{-11}, began on August 16 from 4370.50. Internally, it is its 1st wave, A{-12}. Under the principal analysis, wave A{-12} has more downside ahead of it. Under the alternative analysis, wave A{-12} ended at the overnight low, 4118, and wave B{-12} has begun its rise.

Fourth wave corrections tend to end within the 4th subwave of the preceding 3rd wave — that is, within the 4th wave of the wave that’s being corrected. Wave 4{-12} within wave 3{-11} went from 4147.25 down to 4080.50, and that’s the target range for the wave 4{-11} correction.

This is all happening within wave 3{-10}, an uptrend that began July 14 from 3723.75. In the larger picture, the S&P 500 is in a downtrend, wave 4{-1}, which began on January 4 from 4818.64.

Learning and other resources. Elliott wave analysis provides context, not prophecy. As the 20th century semanticist Alfred Korzybski put it in his book Science and Sanity (1933), “The map is not the territory … The only usefulness of a map depends on similarity of structure between the empirical world and the map.” And I would add, in the ever-changing markets, we can judge that similarity of structure only after the fact.

See the menu page Analytical Methods for a rundown on where to go for information on Elliott wave analysis.

By Tim Bovee, Portland, Oregon, August 23, 2022

Disclaimer

Tim Bovee, Private Trader tracks the analysis and trades of a private trader for his own accounts. Nothing in this blog constitutes a recommendation to buy or sell stocks, options or any other financial instrument. The only purpose of this blog is to provide education and entertainment.

No trader is ever 100 percent successful in his or her trades. Trading in the stock and option markets is risky and uncertain. Each trader must make trading decisions for his or her own account, and take responsibility for the consequences.

License
Creative Commons License

All content on Tim Bovee, Private Trader by Timothy K. Bovee is licensed under a Creative Commons Attribution-ShareAlike 4.0 International License.

Based on a work at www.timbovee.com.

Trader’s Notebook

6:25 p.m. New York time

Correction. I’ve corrected paragraph 2 of the 3:30 p.m. post to clarify that wave 5{-11} likely will move above the August 16 high but will remain below the January 4 high, when a major downward movement, wave 4{-1}, began.

3:30 p.m. New York time

Half an hour before the closing bell. The S&P 500 E-mini futures having continued their decline during the session, reaching a low of 4133, a few cents below the 38.2% Fibonacci retracement level. The decline also put wave 4{-11} within the target range for a 4th wave, the range covered by wave 4{-12} in early August, within the preceding uptrend, wave 3{-11}, which ran from July 18 to August 16.

The downward correction, wave 4{-11}, is in its first internal wave, downward wave A{-12}, and if it takes the pattern of a Flat, as 4th waves tend to do, it still has two waves left before completion: Rising wave B{-12} and then downward wave C{-12}. Typically, the C wave will end the correction, and uptrending wave 5{-11} will begin its rise, most likely above the August 16 high, 4327.50, although it will remain below the January 4 high, 4808.25.

No change in the analysis. I’ve updated the chart.

9:35 a.m. New York time

What’s happening now? The S&P 500 E-mini futures continued to fall when trading resumed Sunday evening, reaching a low of 4170 shortly after the opening bell.

What does it mean? A downward correction that began on August 16 from 4237.50 is underway. So far it has retraced more than a quarter of the rise that began on July 18 from 3820.25.

What are the alternatives? The further the price falls, the less plausible the alternative analysis becomes, that the decline from August 16 is a correction within the uptrend from July 18. Less plausible falls short of impossible, so I’m keeping the alternative on the table for now.

The chart. I’ve superimposed a Fibonacci grid, in red, to provide context for the extent of the decline. So far the price has pushed beyond the 23.6% Fibonacci retracement level.

[S&P 500 E-mini futures at 3:30 p.m., 100-minute bars, with volume]

What does Elliott wave theory say? Under the principal analysis, the downward correction that began on August 16 is wave 4{-11} within a still ongoing uptrend, wave 3{-10}, which began on July 14 from 3723.75. Wave 4{-11} is retracing wave 3{-11}, which began on July 18 from 3820.25.

Internally, I count wave 4{-11} as being in the first wave, A{-13} within the larger first wave, A{-12}, of the downward correction. However, the early waves of a trend or correction are notoriously ambiguous regarding where they fit in the fractal hierarchy of Elliott wave analysis, and that is certainly the case here. “Fit in the fractal hierarchy” is a technical way of saying, “How big is this wave compared to other waves?”.

Since the correction is a 4th wave, it typically will end within the range of the 4th wave within the preceding 3rd wave, which is between the 4190s and the 4070s, a retracement between the 38.2% and 50% Fibonacci levels.

Under the alternative analysis, wave 3{-11} is continuing its rise that began on July 18.

Learning and other resources. Elliott wave analysis provides context, not prophecy. As the 20th century semanticist Alfred Korzybski put it in his book Science and Sanity (1933), “The map is not the territory … The only usefulness of a map depends on similarity of structure between the empirical world and the map.” And I would add, in the ever-changing markets, we can judge that similarity of structure only after the fact.

See the menu page Analytical Methods for a rundown on where to go for information on Elliott wave analysis.

By Tim Bovee, Portland, Oregon, August 22, 2022

Disclaimer

Tim Bovee, Private Trader tracks the analysis and trades of a private trader for his own accounts. Nothing in this blog constitutes a recommendation to buy or sell stocks, options or any other financial instrument. The only purpose of this blog is to provide education and entertainment.

No trader is ever 100 percent successful in his or her trades. Trading in the stock and option markets is risky and uncertain. Each trader must make trading decisions for his or her own account, and take responsibility for the consequences.

License
Creative Commons License

All content on Tim Bovee, Private Trader by Timothy K. Bovee is licensed under a Creative Commons Attribution-ShareAlike 4.0 International License.

Based on a work at www.timbovee.com.