Trader’s Notebook

3:30 p.m. New York time

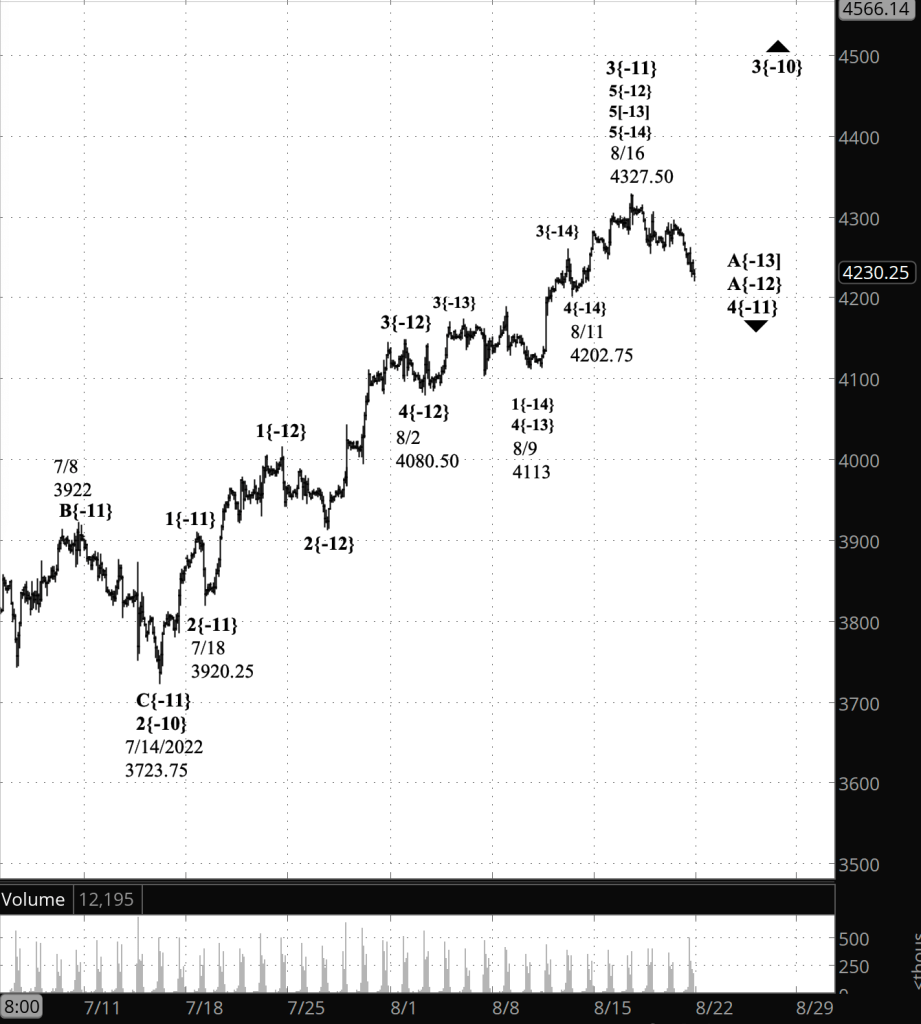
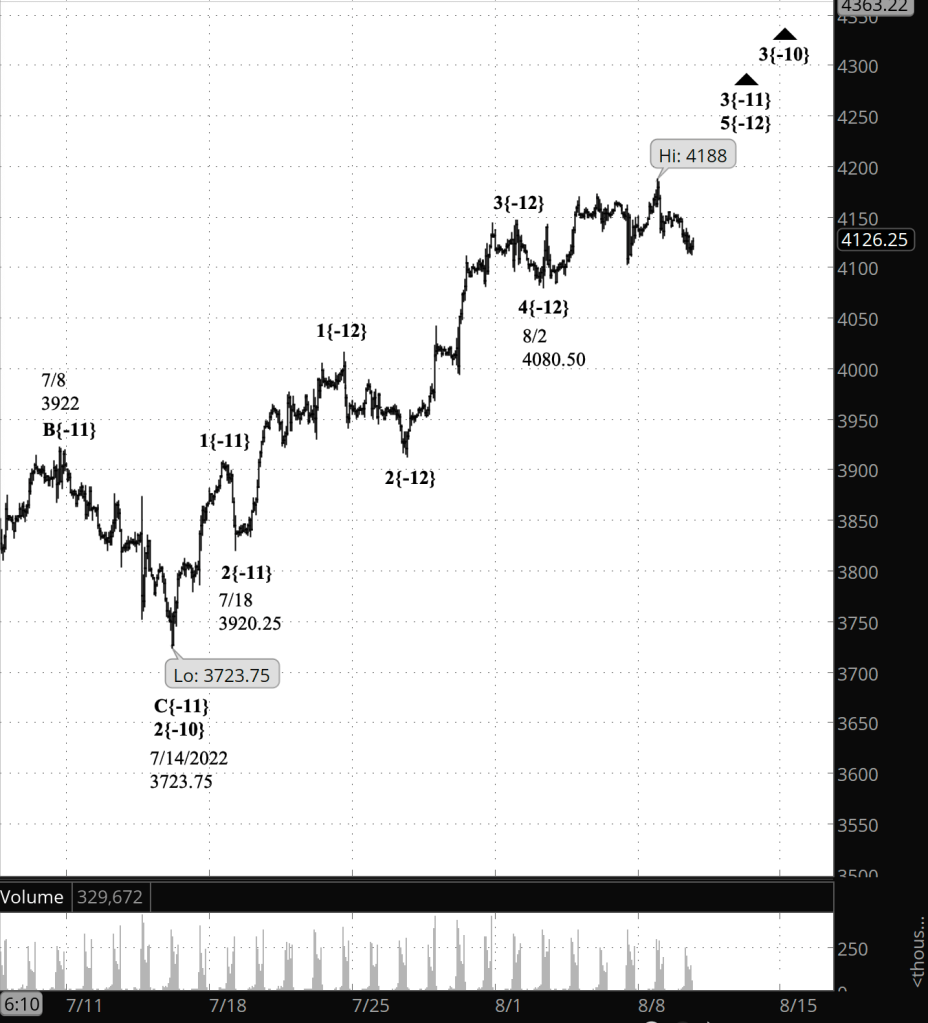
Half an hour before the closing bell. The S&P 500 has trended downward during the session, reaching a low so far of 4220.75 on the futures. Wave 4{-11}, a downward correction, continues. I’ve updated the chart.

9:35 a.m. New York time

What’s happening now? The S&P 500 E-mini futures fell overnight, reaching into the 4240s, nearly 90 points below the August 16 peak.

What does it mean? At this point I’d say that the principal analysis, shown on the chart, and the alternative analysis are of nearly equal likelihood.

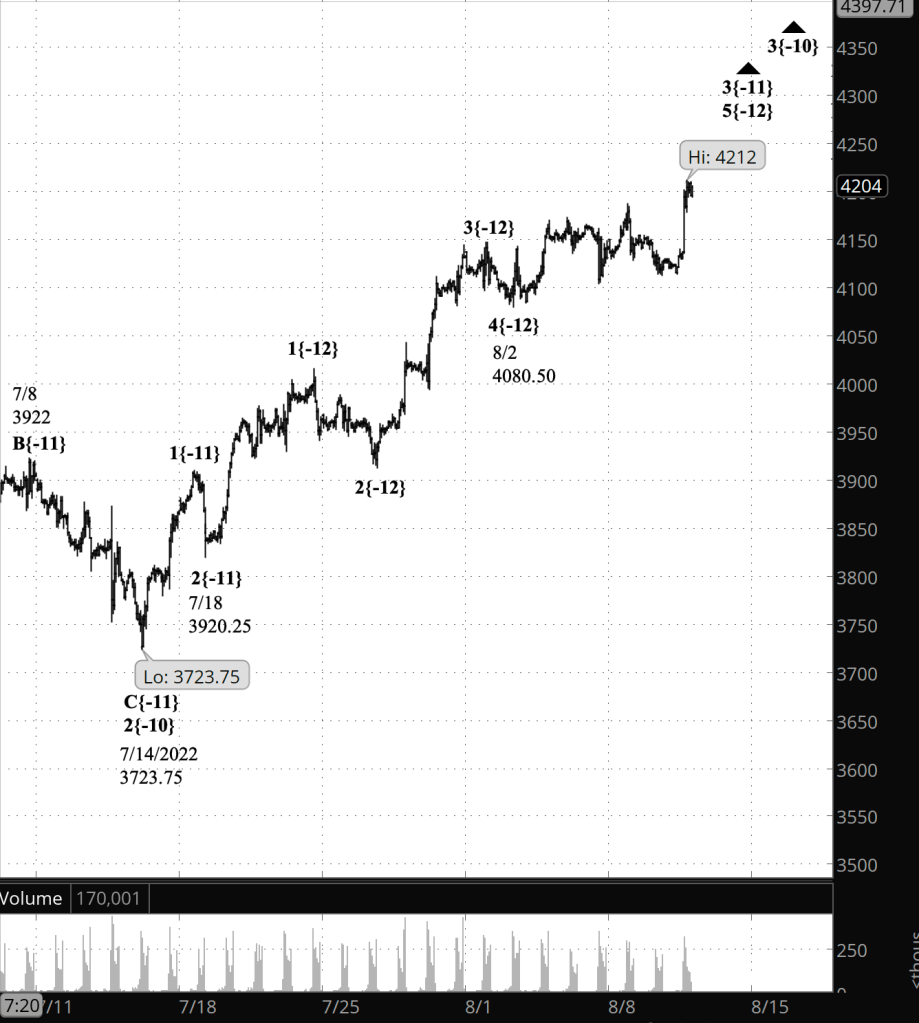
I’ve switched the principal and the alternative from yesterday. Under the new principal analysis, the decline from the August 16 peak, 4237.50, is a downward correction of the rise that began on July 18. The August 16 peak was the end of the final leg of that uptrend, which began on August 9. Under this scenario, the correction is larger and the uptrend will eventually resume, but not quickly.

What are the alternatives? The alternative — yesterday’s principal analysis — is to consider the August 16 peak to be a stopping point within the ongoing uptrend and the subsequent decline to be a correction within that uptrend. Under this scenario, the correction is smaller and the uptrend will quickly resume.

[S&P 500 E-mini futures at 3:30 p.m., 100-minute bars, with volume]

What does Elliott wave theory say? There is a powerful ambiguity to the downtrend, and it points to a major difficulty in applying Elliott wave theory to a current chart.

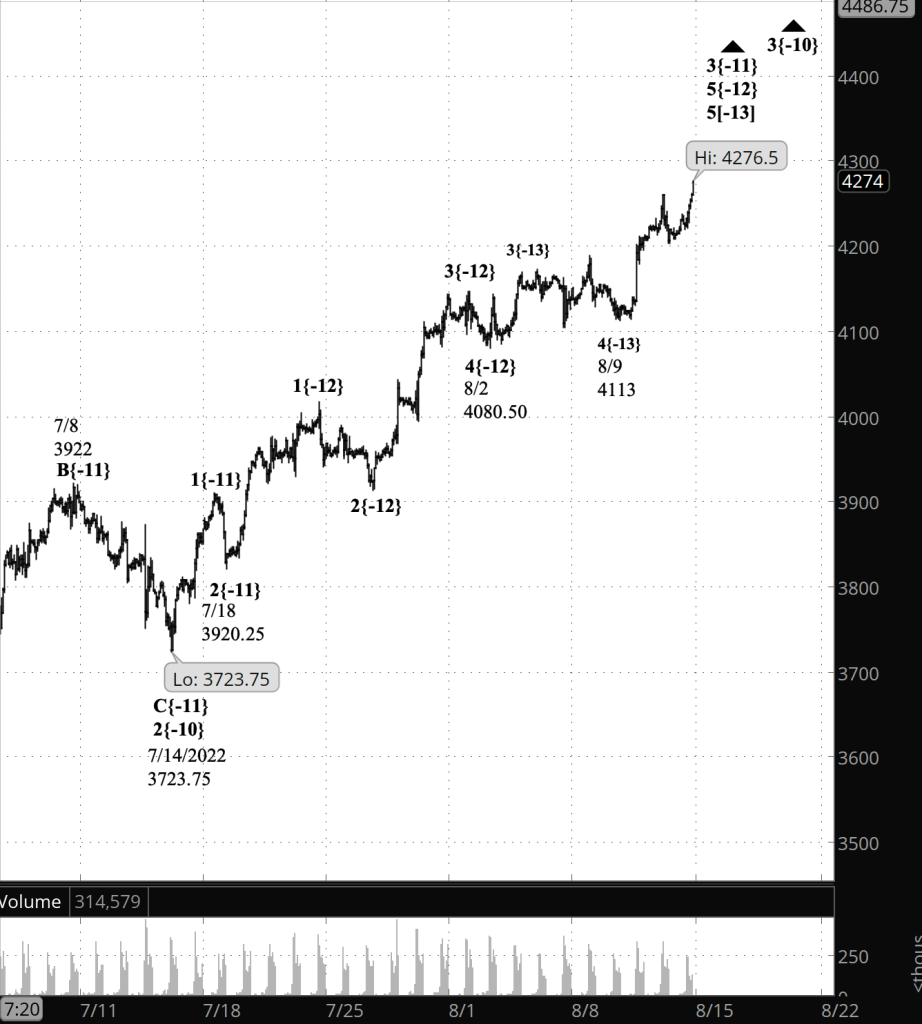
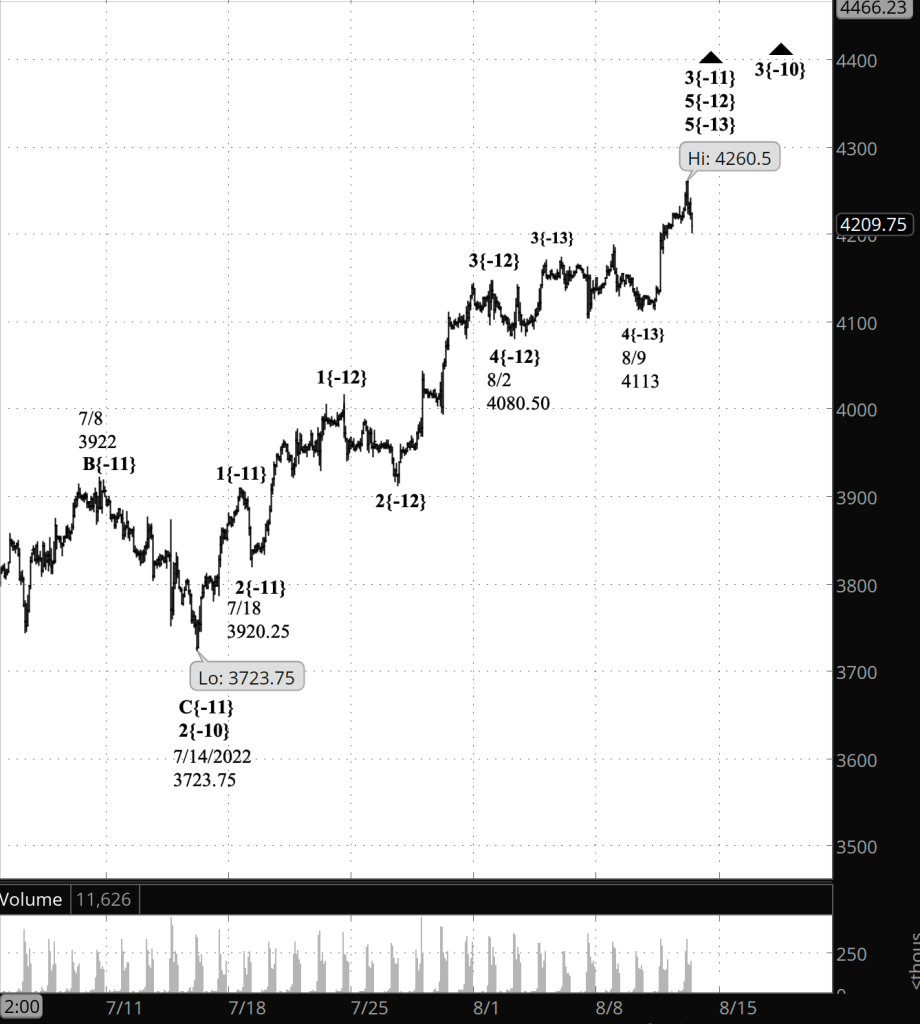
Under the principal interpretation, the uptrend that began August 9 is wave 5{-13} within wave 5{-12} within wave 3{-11}. Internally, wave 5{-13} is in its final wave, 5{-14}, which began on August 11 from 4202.75.

Under the alternative interpretation, wave 5{-13} ended at the August 9 peak, as did its larger encompassing waves, 5{-12} and 3{-11}.

This sets up different scenarios for the decline. Under the principal analysis, the decline is wave A{-13} within wave A{-12} within wave 4{-11}, a downward correction. Fourth waves usually take the form of a Flat — three waves, the first two with three internal waves and the third with five internal waves (3-3-5). Under the alternative analysis, the decline is wave 4{-15} (perhaps), a 4th wave correction within uptrending wave 5{-14} within wave 5{-13}.

The decline so far has shown five waves, but that only means that they are of a smaller degree within wave A{-12} — perhaps wave 1{-14} or 1{-15} within wave A{-13} within wave A{-12}. Or it could be that the correction is forming a Zigzag pattern, with internal waves 5-3-5. A Zigzag 4th wave is slightly less common than a Flat, but it happens often enough.

I chose to switch the analyses from yesterday because the final wave of the uptrend, 5{-14}, was becoming disproportionate to the preceding third wave. That is, it seemed longer than usual, although there is no rule forbidding an extended 5th wave.

Of course, a reversal and a rise above the August 16 peak, 4237.50, will mean that my new principal analysis doesn’t match the chart and the alternative analysis is the better choice.

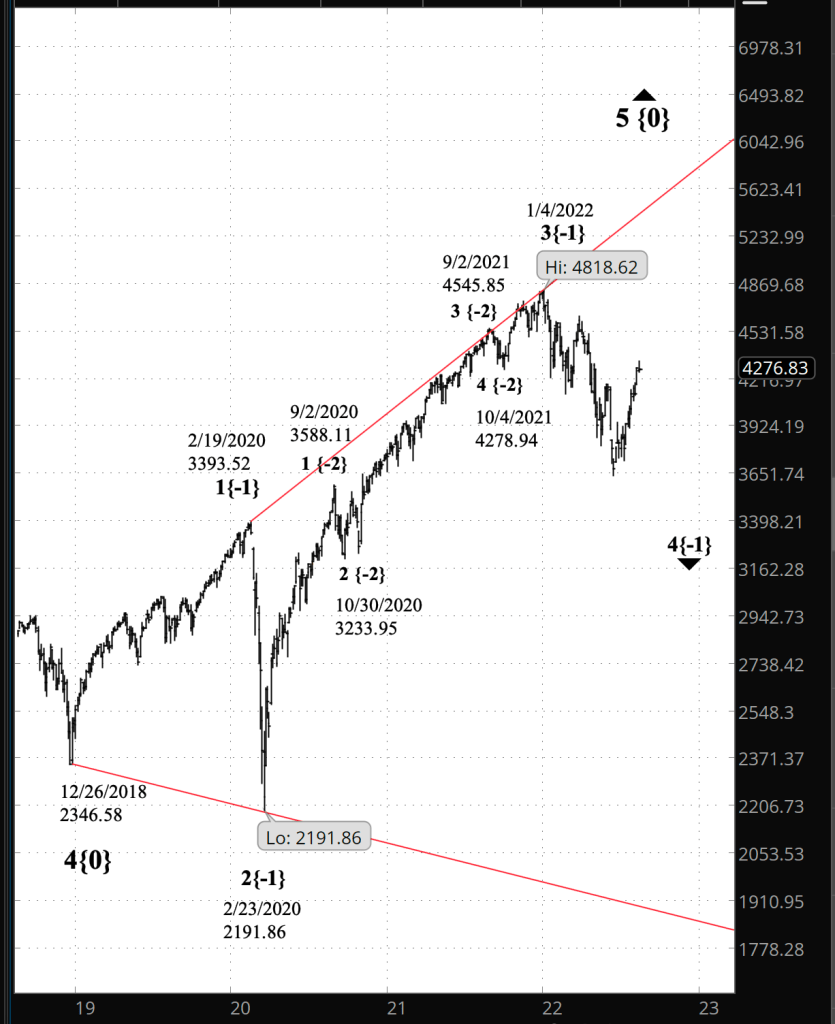
These ambiguities are happening within wave 3{-10}, an uptrend that began on July 14 from 3723.75. When wave 4{-11} is complete, it will be followed by an uptrend, wave 5{-11}, that will carry wave 3{-10} to completion and, most likely, to new heights.

Learning and other resources. Elliott wave analysis provides context, not prophecy. As the 20th century semanticist Alfred Korzybski put it in his book Science and Sanity (1933), “The map is not the territory … The only usefulness of a map depends on similarity of structure between the empirical world and the map.” And I would add, in the ever-changing markets, we can judge that similarity of structure only after the fact.

See the menu page Analytical Methods for a rundown on where to go for information on Elliott wave analysis.

By Tim Bovee, Portland, Oregon, August 19, 2022

Disclaimer

Tim Bovee, Private Trader tracks the analysis and trades of a private trader for his own accounts. Nothing in this blog constitutes a recommendation to buy or sell stocks, options or any other financial instrument. The only purpose of this blog is to provide education and entertainment.

No trader is ever 100 percent successful in his or her trades. Trading in the stock and option markets is risky and uncertain. Each trader must make trading decisions for his or her own account, and take responsibility for the consequences.

License
Creative Commons License

All content on Tim Bovee, Private Trader by Timothy K. Bovee is licensed under a Creative Commons Attribution-ShareAlike 4.0 International License.

Based on a work at www.timbovee.com.

Trader’s Notebook

3:30 p.m. New York time

Half an hour before the closing bell. The S&P 500 has traded narrowly day, ranging from the 4260s to the 4290s on the futures. No change in the analysis. The uptrend that began on August 9, wave 5{-13}, continues. I’ve updated the upper chart.

9:35 a.m. New York time

What’s happening now? The S&P 500 E-mini futures traded in a narrow range overnight, between the 4260s and the 4290s, remaining below the August 16 peak, 4327.50.

What does it mean? The shallowness of the pullback — the lack of energy to the downside — suggests to me that the uptrend that began on August 9 from 4113 is still underway and that the price will push beyond the most recent peak to a higher high. Under this principal analysis, the shallow decline has been a downward correction within that uptrend.

What is the alternative? As has been the case for several days, the alternative is that the August 16 peak was the end of the uptrend that began on August 9 and the subsequent shallow decline is the first, tentative step of a downtrend.

The charts. The upper chart is a close-up of the S&P 500 E-mini futures for July and August. The lower chart shows the entirety of the major bull market from December 2018 to the present.

[S&P 500 E-mini futures at 3:30 p.m., 100-minute bars, with volume]

What does Elliott wave theory say? The uptrend that began on August 9 is wave 5{-13}, the final wave of the trend within a larger uptrend, wave 5{-12}, which began on August 2 from 4080.50.

The fractal structure is in turn internal to wave 3{-11}, the middle wave of an uptrend that began on July 18 from 3920.25, which in turn is the middle subwave of a larger uptrend, wave 3{-10}, which began on July 14 from 3723.75.

When wave 5{-13} is complete — it ended on August 16 according to the alternative analysis and still has more upside to go according to the principal analysis — it will also be the end of its parent wave, 5{-12}, and also of wave 3{-11}, which is larger by one degree.

If we focus nine degrees larger, we find the market of July and August is a small portion of wave 4{-1}, a major downtrend that began on January 4 from 4818.62, which is in turn the penultimate subwave within wave 5{0}, an expanding Diagonal Triangle that is the final wave of an uptrend that began the day after Christmas, on December 26, 2018 from 2346.58 on the index, which reached a high, on August 16 at 4325.28.

What a nice Christmas present that rise of nearly 2,000 points has been for bullish traders. And when downtrending wave 4{-1} is complete, wave 5{-1} will resume that rise that began in 2018, carrying wave 5{0} to new heights.

[S&P 500 index at 9:33 a.m., 3-day bars]

Learning and other resources. Elliott wave analysis provides context, not prophecy. As the 20th century semanticist Alfred Korzybski put it in his book Science and Sanity (1933), “The map is not the territory … The only usefulness of a map depends on similarity of structure between the empirical world and the map.” And I would add, in the ever-changing markets, we can judge that similarity of structure only after the fact.

See the menu page Analytical Methods for a rundown on where to go for information on Elliott wave analysis.

By Tim Bovee, Portland, Oregon, August 18, 2022

Disclaimer

Tim Bovee, Private Trader tracks the analysis and trades of a private trader for his own accounts. Nothing in this blog constitutes a recommendation to buy or sell stocks, options or any other financial instrument. The only purpose of this blog is to provide education and entertainment.

No trader is ever 100 percent successful in his or her trades. Trading in the stock and option markets is risky and uncertain. Each trader must make trading decisions for his or her own account, and take responsibility for the consequences.

License
Creative Commons License

All content on Tim Bovee, Private Trader by Timothy K. Bovee is licensed under a Creative Commons Attribution-ShareAlike 4.0 International License.

Based on a work at www.timbovee.com.

Trader’s Notebook

3:30 p.m. New York time

Half an hour before the closing bell. The S&P 500 reached a low at mid-session, of 4255 on the futures, and then rose back to 4305.25, before once again taking a sharp decline, into the 4270s. The day’s decline had five wave internally, making it consistent with both a trending wave and the initial, A, wave within a Zigzag correction.

I’ve added a very short-term chart of the futures showing the decline from yesterday’s peak in detail, but without the degree subscripts. I’ve also updated the longer-term chart from this morning.

The decline could confirm the alternative analysis, that the 8/17 peak end the uptrend from August 9, as the alternative analysis has it, or it could be a correction within the uptrend, which is still underway, as the principal analysis has it. It’s ambiguous.

Meanwhile, for the moment, I’m sticking with my principal analysis.

[S&P 500 E-mini futures at 3:33 p.m., 5-minute bars]

9:35 a.m. New York time

What’s happening now? The S&P 500 E-mini futures fell sharply from yesterday’s high, 4327.50, reaching into the 4260s. The decline was sharp, beginning at 1:35 a.m. New York time before the London markets opened and continuing until they closed, at 7:30 a.m.

What does it mean? The principal analysis is the same as it was yesterday: The uptrend that began on August 9 continues and the decline is a downward correction within that uptrend. The sharpness of the decline increases the likelihood of the alternative analysis being correct.

What are the alternatives? The alternative is unchanged: Yesterday’s high could well have been the end of the uptrend and the beginning of a downward correction a couple of degrees larger. The greater the price decline, the more likely it is that 4327.50 was the end of the uptrend that began on August 9.

[S&P 500 E-mini futures at 3:30 p.m., 90-minute bars, with volume]

What does Elliott wave theory say? Elliott wave theory holds that the markets reflect the public mood and often lead events that alter that mood. The Federal Open Market Committee within the Federal Reserve releases minutes of its late July meeting at 2 p.m. today. That’s no surprise. It has been on the calendar for quite a long time. And personally, I doubt that there will be any surprises. Some market journalists have suggested that the market is worried because the minutes might reveal that FOMC discussed a Fed Funds rate increase higher than the 75 basis point hike they actually did.

It seems like an unlikely scenario to me. The FOMC’s next two-day meeting ends on September 21, and a lot can happen between now and then. It seems to me to be a poor theory of causality. Perhaps better to count the waves and see what they imply

Under my principal analysis, wave 5{-13} is continuing its rise. When it is complete, it will also mark the end of two larger waves, 5{-12} and 3{-11}. The next move will be a downtrend, wave 4{-11}, which will retrace a portion of wave 3{-11}, the uptrend that began on July 18 from 3920.25.

This is all happening within a series of larger waves, rising and falling, within a major downtrend that began on January 4 from from 4808.25, wave 4{-1}, which will likely carry the price below 3,000, perhaps significantly so.

That major decline will be followed by a rise to new highs, wave 5{-1}, which will complete wave 5{0}, an expanding Diagonal Triangle that began on December 26, 2018 from 2346.58 on the index.

Learning and other resources. Elliott wave analysis provides context, not prophecy. As the 20th century semanticist Alfred Korzybski put it in his book Science and Sanity (1933), “The map is not the territory … The only usefulness of a map depends on similarity of structure between the empirical world and the map.” And I would add, in the ever-changing markets, we can judge that similarity of structure only after the fact.

See the menu page Analytical Methods for a rundown on where to go for information on Elliott wave analysis.

By Tim Bovee, Portland, Oregon, August 17, 2022

Disclaimer

Tim Bovee, Private Trader tracks the analysis and trades of a private trader for his own accounts. Nothing in this blog constitutes a recommendation to buy or sell stocks, options or any other financial instrument. The only purpose of this blog is to provide education and entertainment.

No trader is ever 100 percent successful in his or her trades. Trading in the stock and option markets is risky and uncertain. Each trader must make trading decisions for his or her own account, and take responsibility for the consequences.

License
Creative Commons License

All content on Tim Bovee, Private Trader by Timothy K. Bovee is licensed under a Creative Commons Attribution-ShareAlike 4.0 International License.

Based on a work at www.timbovee.com.

Trader’s Notebook

3:30 p.m. New York time

Half an hour before the closing bell. The S&P 500 resumed its climb, reaching 4327.50 on the futures. The uptrend that began on August 9 continues, confirming this morning’s principal analysis. In Elliott wave analysis terminology, wave 5{-13} and its enclosing waves two degree up on the fractal structure, waves 5{-12} and 3{-11}, are still underway. I’ve updated the chart.

10:20 a.m. New York time

HD earnings play exit. I’ve exited my short bull put options spread on HD for 27.8% of maximum potential profit, above my 25% minimum goal, and have updated the trade analysis with full results.

9:35 a.m. New York time

What’s happening now? The S&P 500 E-mini futures declined slightly overnight, remaining in a narrow range below yesterday’s high, 4304.75.

What does it mean? The possibilities today are the same as they were yesterday. Under my principal analysis, the uptrend that began on August 9 is still underway, within a larger uptrend that began on July 14. The price will soon reverse and rise above yesterday’s high.

What is the alternative? It’s also possible that yesterday’s high ended the rise that began on August 9, and the subsequent shallow decline is the first, tentative step in what will become a larger decline.

[S&P 500 E-mini futures at 3:30 p.m., 80-minute bars, with volume]

What does Elliott wave theory say?

Under the principal analysis, wave 5{-13}, which began on August 9, is still underway. It is a subwave of wave 5{-12} within wave 3{-11} within wave 3{-10}, the last and largest parent wave having began on July 14 from 3723.75. The end of wave 5{-13} will also mark the end of wave 5{-11} and of 3{-10}. It will be followed by a downward correction, wave 4{-10}, which will take back a portion of the rise from July 14, When complete, wave 4{-10} will be followed by wave 5{-10}, which likely will carry the price above the wave 3{-10} peak.

This is all happening within uptrending wave 1{-9}, which began on June 17, within a much larger downward movement, wave 4{-1}, which began on January 4 from 4818.62.

Learning and other resources. Elliott wave analysis provides context, not prophecy. As the 20th century semanticist Alfred Korzybski put it in his book Science and Sanity (1933), “The map is not the territory … The only usefulness of a map depends on similarity of structure between the empirical world and the map.” And I would add, in the ever-changing markets, we can judge that similarity of structure only after the fact.

See the menu page Analytical Methods for a rundown on where to go for information on Elliott wave analysis.

By Tim Bovee, Portland, Oregon, August 16, 2022

Disclaimer

Tim Bovee, Private Trader tracks the analysis and trades of a private trader for his own accounts. Nothing in this blog constitutes a recommendation to buy or sell stocks, options or any other financial instrument. The only purpose of this blog is to provide education and entertainment.

No trader is ever 100 percent successful in his or her trades. Trading in the stock and option markets is risky and uncertain. Each trader must make trading decisions for his or her own account, and take responsibility for the consequences.

License
Creative Commons License

All content on Tim Bovee, Private Trader by Timothy K. Bovee is licensed under a Creative Commons Attribution-ShareAlike 4.0 International License.

Based on a work at www.timbovee.com.

HD Trade

The Home Depot Inc. (HD)

Lot 2022-2

Update 8/16/2022: I exited my short bull put vertical spread on HD, 31 days before expiration, for a $1.35 debit per contract/share, a profit before fees of $52 per contract. Shares were trading at $319.09, up $4.94 from the entry level.

The Implied Volatility Rank at exit was 43.1%, up 3.5 points from the entry level.

I exited on the day after entry because the position exceeded 25% of maximum potential profit, my normal exit point for earnings plays. The trade earned 27.8% of max.

Shares rose by 1.6% over one day for a +574% annual rate. The options position produced a 38.5% return for a +14,059% annual rate.


I have entered a short bull put vertical spread on HD, using options that trade for the last time 32 days hence, on September 16. The premium is a $1.87 credit per contract share and the stock at the time of entry was priced at $314.15.

The Implied Volatility Ratio stood at 39.6%.

Premium:$1.87Expire OTM
HD-bull put spreadStrikeOddsDelta
Puts
Long305.0060.0%36
Break-even311.8756.5%39
Short310.0053.0%42

The premium is 74.8% of the width of the position’s short/long spread. The profit zone covers a 0.7% move to the downside and an unlimited move to the upside.

The risk/reward ratio is 1.7:1, with maximum risk of $313 and maximum reward of $187 per contract.

How I chose the trade. The trade was placed to coincide with HD’s earnings announcement, before the openig bell on the day after entry. The short strike was set to coincide with the expected move of $10.87 either way, based on options pricing, which gives a price range of $303.28 to $325.02. The Zacks Investment Research earnings surprise predictor gave HD a score of 0.5%, with a rank of Hold (3). The analysts’ consensus is that HD will announce earnings of $4.95 per share.

By Tim Bovee, Portland, Oregon, August 15, 2022

Disclaimer

Tim Bovee, Private Trader tracks the analysis and trades of a private trader for his own accounts. Nothing in this blog constitutes a recommendation to buy or sell stocks, options or any other financial instrument. The only purpose of this blog is to provide education and entertainment.

No trader is ever 100 percent successful in his or her trades. Trading in the stock and option markets is risky and uncertain. Each trader must make trading decisions for his or her own account, and take responsibility for the consequences.

License
Creative Commons License

All content on Tim Bovee, Private Trader by Timothy K. Bovee is licensed under a Creative Commons Attribution-ShareAlike 4.0 International License.

Based on a work at www.timbovee.com.

Trader’s Notebook

3:30 p.m. New York time

Half an hour before the closing bell. The S&P 500 resumed its rise early in the session, moving to a new high, slightly above 4300. The reversal confirms the principal analysis. The rise from August 8 is not yet complete. I’ve updated the chart.

1:30 p.m. New York time

HD earnings play entry. I’ve entered a short bull put vertical spread on HD, using options that trade for the last time on September 16, and have posted an analysis of the trade.

9:35 a.m. New York time

What’s happening now? The S&P 500 E-mini futures fell after trading resumed overnight, reaching 4249, more than 30 points below Friday’s high, 4282.75.

What does it mean? The rise that began on August 8 from 4133 is nearing its end and indeed may have been completed by Friday’s high. Or not. The two possibilities are of nearly equal probability. My principal analysis, shown in the chart, is that the trend is still underway., based on my practice of assuming a trend is continuing until I have clear evidence to the contrary.

What is the alternative? The rise from August 8 ended on August 12 at 4282.75. The further the price falls, the more likely the alternative analysis becomes.

[S&P 500 E-mini futures at 3:30 p.m., 80-minute bars, with volume]

What does Elliott wave theory say? Under the principal analysis, the decline is a downward correction within wave 5{-13}, which began on August 9 from 4113. When the correction is complete, the uptrend will resume, moving beyond Friday’s high, 4282.75.

Under the alternative analysis, wave 5{-13} ended on Friday at 4282.75, a point that also marked the end of a series of parent wave: 5{-12} and 3{-11} within 3{-10}, which began on July 14 from 3723.75. Wave 4{-12}, a downward correction, is underway, having begun at Friday’s high.

This is all happening within uptrending wave 1{-9}, which began on June 17, within a much larger downward movement, wave 4{-1}, which began on January 4 from 4818.62.

Learning and other resources. Elliott wave analysis provides context, not prophecy. As the 20th century semanticist Alfred Korzybski put it in his book Science and Sanity (1933), “The map is not the territory … The only usefulness of a map depends on similarity of structure between the empirical world and the map.” And I would add, in the ever-changing markets, we can judge that similarity of structure only after the fact.

See the menu page Analytical Methods for a rundown on where to go for information on Elliott wave analysis.

By Tim Bovee, Portland, Oregon, August 15, 2022

Disclaimer

Tim Bovee, Private Trader tracks the analysis and trades of a private trader for his own accounts. Nothing in this blog constitutes a recommendation to buy or sell stocks, options or any other financial instrument. The only purpose of this blog is to provide education and entertainment.

No trader is ever 100 percent successful in his or her trades. Trading in the stock and option markets is risky and uncertain. Each trader must make trading decisions for his or her own account, and take responsibility for the consequences.

License
Creative Commons License

All content on Tim Bovee, Private Trader by Timothy K. Bovee is licensed under a Creative Commons Attribution-ShareAlike 4.0 International License.

Based on a work at www.timbovee.com.

Trader’s Notebook

3:30 p.m. New York time

Half an hour before the closing bell. The S&P 500 has continued to climb during the session, reaching above 4276 on the futures. The rise above the overnight high confirms this morning’s principal analysis; the overnight correction has indeed been followed by a resumption of the uptrend.

As has been the case recently, any fresh peak could be the end of the uptrend, which has met of the requirements of Elliott wave analysis. On the other hand, it might still push higher.

In Elliott wave terminology, the present wave set is wave 5{-14} within wave 5{-13} within wave 5{-12} within wave 3{-11} within wave 3{-10}, that last, largest wave of the set having begun on July 14.

I’ve updated the chart.

9:35 a.m. New York time

What’s happening now? The S&P 500 E-mini futures rose to a higher high in overnight trading, 4260.50, and then pulled back a bit.

What does it mean? I’ve analyzed the pullback as a downward correction within the ongoing rise that began on August 9, part of a larger uptrend that began on July 14. The correction likely will be followed by a push to a higher high.

What are the alternatives? The overnight high could have ended the August 9 rise. If so, then it also means the end of the larger rise from August 2, and the still larger uptrend from July 18. The further the price declines today and early next week, the more likely it is that this alternative matches the chart.

[S&P 500 E-mini futures at 3:30 p.m., 80-minute bars, with volume]

What does Elliott wave theory say? Under my principal analysis, the overnight high marks the end of the 3rd internal wave, 3{-14}, within wave 5{-13}. The pullback is wave 4{-14}, and it will be followed by uptrending wave 5{-15}, the final wave within wave 5{-13}. Wave 5{-15} is likely to push above the overnight high, although the 5th wave could be truncated, in which case it will end below that prior high.

Under the alternative analysis, the overnight peak is the end of wave 5{-14}, and also the end of parent waves 5{-13}, 5{-12} and 3{-11}. It will be followed by a decline that will correct a portion of the rise that began on July 18.

Learning and other resources. Elliott wave analysis provides context, not prophecy. As the 20th century semanticist Alfred Korzybski put it in his book Science and Sanity (1933), “The map is not the territory … The only usefulness of a map depends on similarity of structure between the empirical world and the map.” And I would add, in the ever-changing markets, we can judge that similarity of structure only after the fact.

See the menu page Analytical Methods for a rundown on where to go for information on Elliott wave analysis.

By Tim Bovee, Portland, Oregon, August 12, 2022

Disclaimer

Tim Bovee, Private Trader tracks the analysis and trades of a private trader for his own accounts. Nothing in this blog constitutes a recommendation to buy or sell stocks, options or any other financial instrument. The only purpose of this blog is to provide education and entertainment.

No trader is ever 100 percent successful in his or her trades. Trading in the stock and option markets is risky and uncertain. Each trader must make trading decisions for his or her own account, and take responsibility for the consequences.

License
Creative Commons License

All content on Tim Bovee, Private Trader by Timothy K. Bovee is licensed under a Creative Commons Attribution-ShareAlike 4.0 International License.

Based on a work at www.timbovee.com.

Trader’s Notebook

3:30 p.m. New York time

Half an hour before the closing bell. The S&P 500 climbed higher early in the session, peaking at 4260.50 on the futures. It then began to decline, reaching below 4210 as the closing bell approached. No change in the analysis. I’ve updated the chart.

9:35 a.m. New York time

What’s happening now? The S&P 500 E-mini futures continued to rise overnight, reaching a high of 4247 before the opening bell.

What does it mean? The rise from July 14, from 3723.75, is now in the middle wave of a five-wave uptrend. Internally, it is also in its middle wave, which has reached its end game, in its 5th and final subwave.

What are the alternatives? As has been the case the past few days, each peak could be the end of the uptrend, or not. We’ll know the uptrend is complete when it reverses into a significant decline.

[S&P 500 E-mini futures at 3:30 p.m., 80-minute bars, with volume]

What does Elliott wave theory say? The uptrend that began on July 14 is wave 3{-10}, the middle wave within wave 1{-9}, which began on June 17 from 4202.25. Working from larger to smaller degrees, here is an inventory of the present wave line-up: Wave 3{-11} began on July 18 from 3920.25; within it, wave 5{-12} began on August 2 from 4080.25; and, still smaller, wave 5{-13} began on August 9 from 4113.

The end of wave 5{-13} will also be the end of waves 5{-12} and 3{-11}. A downward correction, wave 4{-11} will follow, to be followed in turn by a push to higher highs with wave 5{-11}. The end of wave 5{-11} will also be the end of wave 3{-10}, which will begin a 4th wave downward correction.

It is important to remember that all these uptrends and corrections of small degree are happening within huge downtrend, wave 4{-1}, that began on January 4 from 4808.25. It has a long way to go before reaching its end, perhaps down into the 2000s or lower. It will be followed by an uptrend that likely will carry the price above the January 4 high, perhaps into the 4900s or higher.

A note on trades. The earnings season is winding down and so I’m finding fewer options trades that fit my strategy, which is based on earnings announcements. The next earnings season will begin in October, and in the meantime there will be an occasional opportunity worth exploring.

Learning and other resources. Elliott wave analysis provides context, not prophecy. As the 20th century semanticist Alfred Korzybski put it in his book Science and Sanity (1933), “The map is not the territory … The only usefulness of a map depends on similarity of structure between the empirical world and the map.” And I would add, in the ever-changing markets, we can judge that similarity of structure only after the fact.

See the menu page Analytical Methods for a rundown on where to go for information on Elliott wave analysis.

By Tim Bovee, Portland, Oregon, August 11, 2022

Disclaimer

Tim Bovee, Private Trader tracks the analysis and trades of a private trader for his own accounts. Nothing in this blog constitutes a recommendation to buy or sell stocks, options or any other financial instrument. The only purpose of this blog is to provide education and entertainment.

No trader is ever 100 percent successful in his or her trades. Trading in the stock and option markets is risky and uncertain. Each trader must make trading decisions for his or her own account, and take responsibility for the consequences.

License
Creative Commons License

All content on Tim Bovee, Private Trader by Timothy K. Bovee is licensed under a Creative Commons Attribution-ShareAlike 4.0 International License.

Based on a work at www.timbovee.com.

Trader’s Notebook

3:30 p.m. New York time

Half an hour before the closing bell. The S&P 500 rose higher during the session, to 4212 on the futures. No change in the analysis. Chart updated.

9:35 a.m. New York time

What’s happening now? The S&P 500 E-mini futures rose sharply as the opening bell approached, reaching 4201.50 before pulling back slightly.

What does it mean? The rise began when the consumer price index came in slightly lower than analysts had expected. The rise moved above the August 8 high, 4188, confirming that the uptrend that began on July 14 is still underway.

What are the alternatives? As always when the market is reaching for a peak, any new high can potentially be the end of the uptrend. Or not. The only way to know for sure is when the price reverses sharply enough to show that a significant decline has begun.

[S&P 500 E-mini futures at 3:30 p.m., 70-minute bars, with volume]

What does Elliott wave theory say? Uptrending wave 3{-10}, which began on July 14 from 3723.75, continues its rise, reaching a high before the opening bell that was 477.75 points above the wave’s starting point.

Internally, I count wave 3{-10} as being in the final wave, 5{-12}, within it’s middle wave, 3{-11}. There is sufficient ambiguity in the internal count to allow it be analyzed as being within wave 5{-11}, the final wave within wave 3{-10}. That alternative would be confirmed by a significant price reversal to the downside. The count I show on the chart would be confirmed by a decline from the peak in a three-wave correction, wave 4{-10}, and then a five-wave push up, wave 5{-10}.

Learning and other resources. Elliott wave analysis provides context, not prophecy. As the 20th century semanticist Alfred Korzybski put it in his book Science and Sanity (1933), “The map is not the territory … The only usefulness of a map depends on similarity of structure between the empirical world and the map.” And I would add, in the ever-changing markets, we can judge that similarity of structure only after the fact.

See the menu page Analytical Methods for a rundown on where to go for information on Elliott wave analysis.

By Tim Bovee, Portland, Oregon, August 10, 2022

Disclaimer

Tim Bovee, Private Trader tracks the analysis and trades of a private trader for his own accounts. Nothing in this blog constitutes a recommendation to buy or sell stocks, options or any other financial instrument. The only purpose of this blog is to provide education and entertainment.

No trader is ever 100 percent successful in his or her trades. Trading in the stock and option markets is risky and uncertain. Each trader must make trading decisions for his or her own account, and take responsibility for the consequences.

License
Creative Commons License

All content on Tim Bovee, Private Trader by Timothy K. Bovee is licensed under a Creative Commons Attribution-ShareAlike 4.0 International License.

Based on a work at www.timbovee.com.

Trader’s Notebook

3:30 p.m. New York time

Half an hour before the closing bell. The S&P 500 has fallen during the session, reaching into the 4110s on the futures. No change in the analysis. I’ve updated the chart.

9:35 a.m. New York time

What’s happening now? The S&P 500 E-mini futures traded in a narrow range overnight, declining slightly and remaining below Monday’s high, 4188.

What does it mean? The rise that began on July 14 from 3723.75 continues. Monday’s high may have marked the end of the middle leg of that rise. If so, after a downward correction, the rise will resume. The further the price declines, the more likely it is that the downward correction is underway.

What is the alternative? Monday’s high may have been a stopping point as the middle leg of the rise from July 14 continues. If so, then the overnight decline is a smaller correction and the rise will resume, perhaps today.

[S&P 500 E-mini futures at 3:30 p.m., 70-minute bars, with volume]

What does Elliott wave theory say? The rise from July 14 is wave 3{-10}. Internally, it is in wave 3{-11}, which began on July 18 from 3920.25, which in turn is in wave 5{-12}, which began on August 2 from 4080.50.

Learning and other resources. Elliott wave analysis provides context, not prophecy. As the 20th century semanticist Alfred Korzybski put it in his book Science and Sanity (1933), “The map is not the territory … The only usefulness of a map depends on similarity of structure between the empirical world and the map.” And I would add, in the ever-changing markets, we can judge that similarity of structure only after the fact.

See the menu page Analytical Methods for a rundown on where to go for information on Elliott wave analysis.

By Tim Bovee, Portland, Oregon, August 9, 2022

Disclaimer

Tim Bovee, Private Trader tracks the analysis and trades of a private trader for his own accounts. Nothing in this blog constitutes a recommendation to buy or sell stocks, options or any other financial instrument. The only purpose of this blog is to provide education and entertainment.

No trader is ever 100 percent successful in his or her trades. Trading in the stock and option markets is risky and uncertain. Each trader must make trading decisions for his or her own account, and take responsibility for the consequences.

License
Creative Commons License

All content on Tim Bovee, Private Trader by Timothy K. Bovee is licensed under a Creative Commons Attribution-ShareAlike 4.0 International License.

Based on a work at www.timbovee.com.