Update 2/24/2022: I exited my short bull put vertical options spread on DIS, 22 days before expiration, for a $1.14 debit per contract/share, a profit before fees of $46.00 per contract. Shares were trading at $142.42, down $2.32 from the entry level.
The Implied Volatility Rank at exit was 57.6%, down 17.6 points from the entry level.
I exited at 29.4% of maximum potential profit, 4.4 points above 25% of the maximum, my normal exit point for earnings plays.
Shares declined by 1.6% over 15 days for a -39% annual rate. The options position produced a 40.4% return for a +982% annual rate.
I have entered a short bear call options spread on DIS, using options that trade for the last time 37 days hence, on March 18. The premium is a $1.60 credit per contract share and the stock at the time of entry was priced at $144.74.
The Implied Volatility Ratio stood at 75.2%.
Premium:
$1.60
Expire OTM
DIS-bear call spread
Strike
Odds
Delta
Calls
Long
155.00
75.0%
30
Break-even
151.60
70.0%
35
Short
150.00
65.0%
40
The premium is 64% of the width of the position’s short/long spread. The profit zone covers a 4.7% move to the upside and an unlimited move to the downside.
The risk/reward ratio is 2.1:1, with maximum risk of $340 and maximum reward of $160 per contract.
How I chose the trade. The trade was placed to coincide with DIS’s earnings announcement, after the closing bell on the day of entry. The short strikes were set to coincide with the expected move of $8.88 either way, based on options pricing, which gives a price range of $133.14 to $150.90.
By Tim Bovee, Portland, Oregon, February 9, 2022
Disclaimer
Tim Bovee, Private Trader tracks the analysis and trades of a private trader for his own accounts. Nothing in this blog constitutes a recommendation to buy or sell stocks, options or any other financial instrument. The only purpose of this blog is to provide education and entertainment.
No trader is ever 100 percent successful in his or her trades. Trading in the stock and option markets is risky and uncertain. Each trader must make trading decisions for his or her own account, and take responsibility for the consequences.
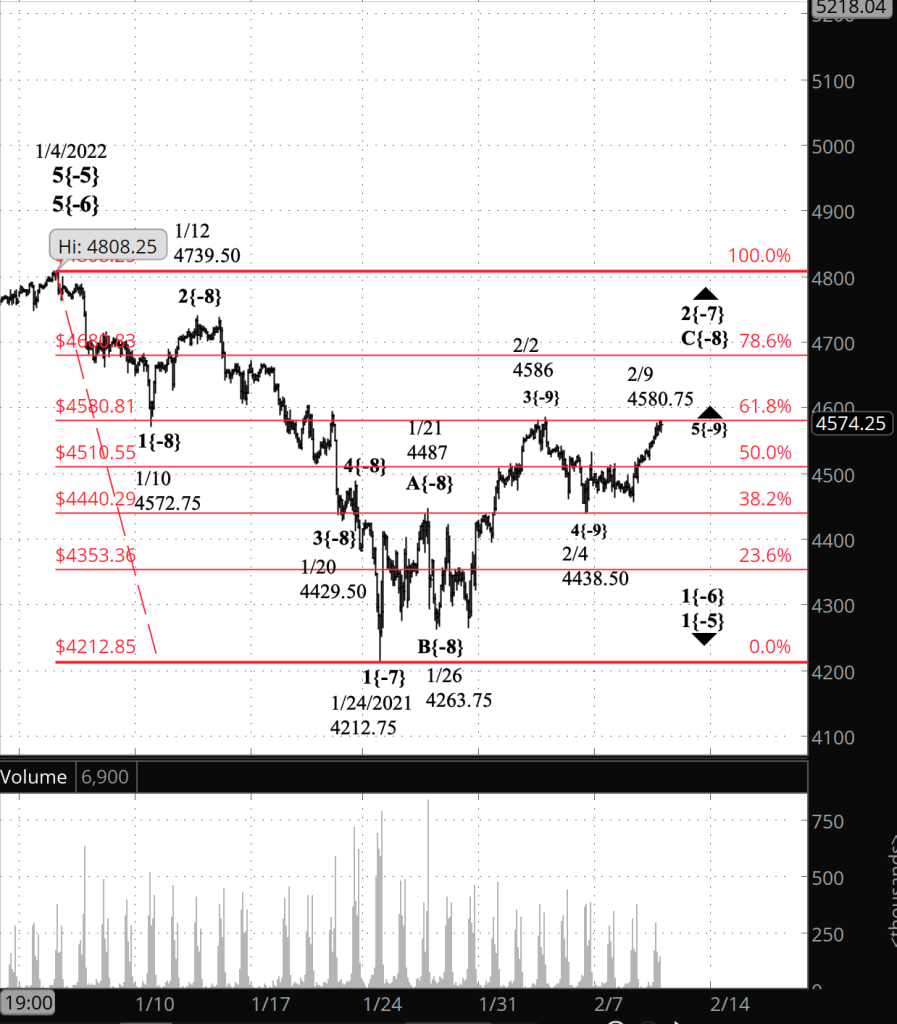
Half an hour before the closing bell. The S&P 500 futures came within 6 cents of the 61.8% retracement point and then pulled back slightly. If today’s high so far, 4580.75, is the peak of wave 5{-9} within C{-8}, then that’s in line with the rules of Elliott wave analysis, which allow the 5th wave to fall short of the end of the preceding 3rd wave, a condition known as truncation. On the other hand, falling short in this way could well mean that a compound correction is underway, a pattern described in the discussion of Alternative #1. I’m leaving my principal analysis unchanged at this point: Upward wave 5{-9} within wave C{-8} within wave 2{-7} is still underway. I’ve updated the chart.
10:15 a.m. New York time
DIS earnings play entry. I’ve entered a short bear call options spread on DIS and have posted an analysis of the trade.
I also analyzed KO as a potential earnings play, but the market was offering too small a premium by my standards. I prefer that the premium cover 33% of the width between the short and long legs of a vertical spread. KO came it at 30%.
9:35 a.m. New York time
What’s happening now? The S&P 500 E-mini futures rose in overnight trading, approaching the 61.8% retracement level and ending three days of sideways trading.
What does it mean? The correction from January 24 is in its third leg, and that leg is in its final upward push. In turn, that upward push began its third phase overnight, typically the most powerful of the three movements in the direction of the trend. The rise will remain below 4808.25 — the January 4 high — and when complete will mark the end of the correction and the resumption of the downtrend.
What are the alternatives? There are two:
Alternative #1: When the present rise is complete, the price might decline in a wave that links to a second corrective pattern, known as a compound correction, rather than resuming the downtrend. This alternative will be disproven if the price moves below the January 24 low, 4212.75.
Alternative #2: It’s still possible that the high of February 2 — 4586 — marked the end of the correction, the the subsequent decline was the first part of the resumed downtrend. This alternative will be disproven if the price moves above 4586. The closer the price moves toward that level, the less likely this alternative becomes.
[S&P 500 E-mini futures at 3:30 p.m., 90-minute bars, with volume]
What does Elliott wave theory say? Within wave 2{-7} — the upward correction that began on January 24 — upward wave C{-8} is in its final portion, wave 5{-10}, out of five waves total. And wave 5{-10} in turn is in its middle leg, wave 3{-11}.
Wave 5{-10} will complete wave C{-9}, but under Alternative #1, it may not be the completion of the parent, wave 2{-7}. A decline will follow C{-9}, but its meaning will be ambiguous. Either the decline will be the first wave within wave 3{-7} — the next leg of the downtrend — or it will be wave X{-9}, setting up a second corrective pattern. within an ongoing wave 2{-7}.
Under Alternative #2, the high of February 2 marked the end of wave 5{-9}, the February 4 low was the end of the first wave within wave 3{-7}, the the subsequent rise was a 2nd wave correction within wave 3{-7}.
We Are Here.
These are the waves currently in progress under my principal analysis. Each line on the list shows the wave number, with the subscript in curly brackets, the traditional degree name, the starting date, the starting price of the S&P 500 E-mini futures, and the direction of the wave.
5{0} Intermediate, 12/21/2018, 2316.75 (up)
3{1} Minor, 3/23/2018 2174 (up)
5{-2} Minute, 10/4/2020, 4267.50 (up)
4{-3} Minuette, 1/4/2022, 4808.25 (down)
A{-4} Subminuette, 1/4/2022, 4808.25 (down)
1{-5} Micro, 1/4/2022, 4808.25 (down)
1{-6} Submicro, 1/4/2022, 4808.25 (down)
2{-7} Minuscule, 1/24/2022, 4212.75 (up)
C{-8} Subminuscule, 1/26/2022, 4263.75 (up)
Learning and other resources. Elliott wave analysis provides context, not prophecy. As the 20th century semanticist Alfred Korzybski put it this way in his book Science and Sanity (1933), “The map is not the territory … The only usefulness of a map depends on similarity of structure between the empirical world and the map.” And I would add, in the ever-changing markets, we can judge that similarity of structure only after the fact.
See the menu page Analytical Methods for a rundown on where to go for information on Elliott wave analysis.
By Tim Bovee, Portland, Oregon, February 9, 2022
Disclaimer
Tim Bovee, Private Trader tracks the analysis and trades of a private trader for his own accounts. Nothing in this blog constitutes a recommendation to buy or sell stocks, options or any other financial instrument. The only purpose of this blog is to provide education and entertainment.
No trader is ever 100 percent successful in his or her trades. Trading in the stock and option markets is risky and uncertain. Each trader must make trading decisions for his or her own account, and take responsibility for the consequences.
Update 2/24/2022: I exited my bear call vertical options spread on LYFT, 22 days before expiration, for a $0.32 debit per contract/share, a profit before fees of $76 per contract. Shares were trading at $38.14, down $1.63 from the entry level.
The Implied Volatility Rank at exit was 49.8, down 51.3 points from the entry level.
The price dropped after earnings were published, and after analyzing the chart, I decided to hold longer in the expectation of further decline. I exited at 70% of maximum potential profit, well above my usual earnings-play target of 25% of max.
Shares declined by 4.1% over 16 days for a -94% annual rate. The options position produced a 237.5% return for a +5,418% annual rate.
I have entered a short bear call options spread on LYFT, using options that trade for the last time 38 days hence, on March 18. The premium is a $1.08 credit per contract share and the stock at the time of entry was priced at $39.77.
The Implied Volatility Ratio stood at 101.1%.
Premium:
$1.08
Expire OTM
LYFT-bear call spread
Strike
Odds
Delta
Calls
Long
50.00
88.0%
16
Break-even
46.08
81.5%
24
Short
45.00
75.0%
32
The premium is 43.2% of the width of the position’s short/long spread. The profit zone covers a 15.9% move to the upside and an unlimited move to the downside.
The risk/reward ratio is 3.6:1, with maximum risk of $392 and maximum reward of $108 per contract.
How I chose the trade. The trade was placed to coincide with LYFT’s earnings announcement, after the closing bell on the day of entry. The short strikes were set to coincide with the expected move of $5.41 either way, based on options pricing, which gives a price range of $44.56 to $33.74.
By Tim Bovee, Portland, Oregon, February 8, 2022
Disclaimer
Tim Bovee, Private Trader tracks the analysis and trades of a private trader for his own accounts. Nothing in this blog constitutes a recommendation to buy or sell stocks, options or any other financial instrument. The only purpose of this blog is to provide education and entertainment.
No trader is ever 100 percent successful in his or her trades. Trading in the stock and option markets is risky and uncertain. Each trader must make trading decisions for his or her own account, and take responsibility for the consequences.
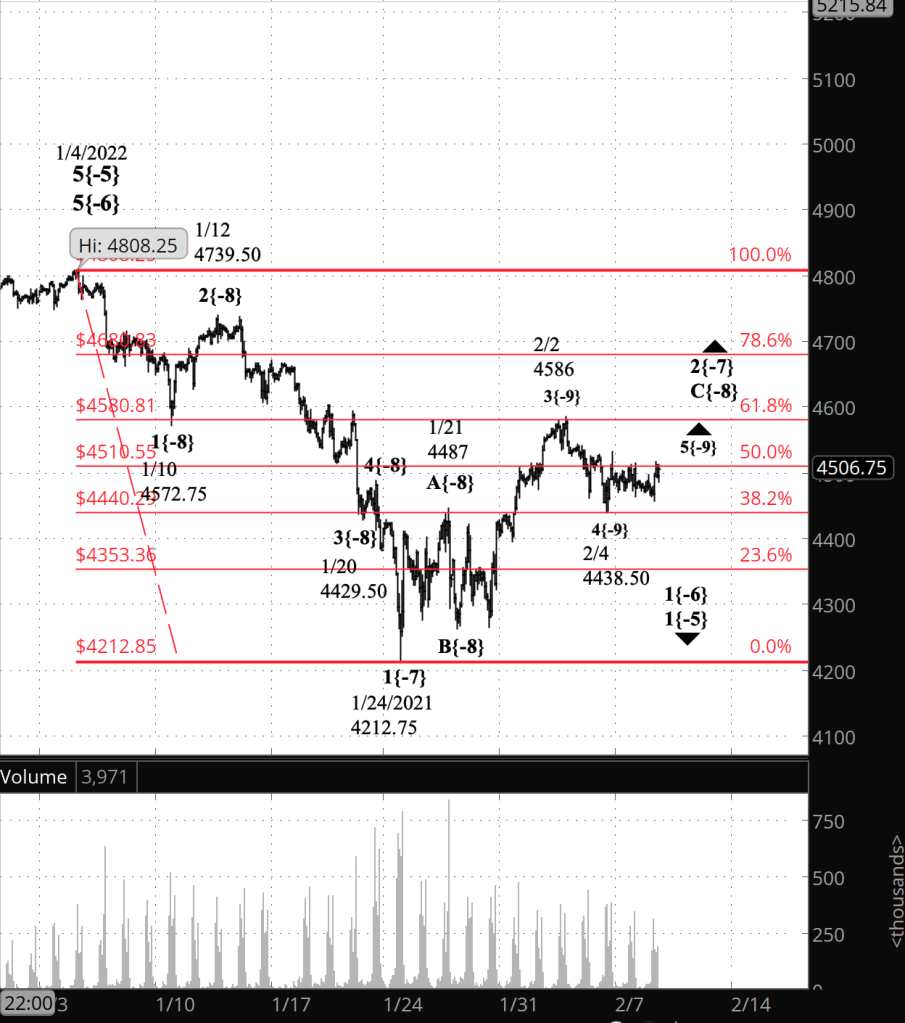
Half an hour before the closing bell. The S&P 500 futures spent the day, as it spent the night, in the space between the 50% and 38.2% retracement lines. The longer it puts off the rise expected under the principal analysis, discussed this morning, the more likely the first alternative seems to be. Under that scenario, the wave 4{-7} correction will take a compound form, consisting of several corrective patterns. Nonetheless, so far I’m keeping the principal analysis in place: Wave 5{-9} within uptrending wave C{-8} is still underway. I’ve updated the chart.
10 a.m. New York time
LYFT earnings play entry. I’ve entered a short bear call options spread on LYFT timed to coincide with the company’s earnings announcement after the closing bell today. I’ve posted an analysis of the trade.
9:35 a.m. New York time
What’s happening now? The S&P 500 E-mini futures traded narrowly overnight between the 38.2% and 50% retracement levels.
What does it mean? The upward correction that began on January 24 is playing its end game. A final push to the upside will conclude the correction. The price will remain below the January 4 peak, 4808.25. After the correction ends, the downtrend will resume and the price fall below the January 24 low, 4212.75, perhaps significantly lower.
What are the alternatives? There a two.
Alternative #1: The correction won’t end with the last leg of the present corrective pattern but instead will trace an intervening decline and then form a compound correction, adding on a second corrective pattern. The price will remain above 4212.75.
Alternative #2: The correction ended on February 2 at 4586, the downtrend and resumed and is in its early stages. The price will fall below 4212.75.
[S&P 500 E-mini futures at 3:30 p.m., 90-minute bars, with volume]
What does Elliott wave theory say? Principal analysis: The upward correction is wave 2{-7} and within it, wave C{-8} — the final wave of the corrective pattern, is nearing an end. It’s final internal component, wave 5{-9}, began on February 4. Wave 2{-7} will be followed by a resumption of the downtrend, wave 3{-7}, which will fall below 4212.75, which is the January 24 end point of wave 1{-7}.
Alternative #1: The present wave C{-8} won’t be the end of its parent, wave 2{-7}, but will instead be followed by wave X{-8} and then another three-wave corrective pattern. Such compound correction can contain up to three corrective components.
Alternative #2: The February 2 high marked the end of wave 5{-9} with wave C{-8}, rather than ending wave 3{-9}, as the principal analysis has it. Wave 5{-9} marks the end of wave C{-8} and also of the parent, wave 2{-7}.
We Are Here.
These are the waves currently in progress under my principal analysis. Each line on the list shows the wave number, with the subscript in curly brackets, the traditional degree name, the starting date, the starting price of the S&P 500 E-mini futures, and the direction of the wave.
5{0} Intermediate, 12/21/2018, 2316.75 (up)
3{1} Minor, 3/23/2018 2174 (up)
5{-2} Minute, 10/4/2020, 4267.50 (up)
4{-3} Minuette, 1/4/2022, 4808.25 (down)
A{-4} Subminuette, 1/4/2022, 4808.25 (down)
1{-5} Micro, 1/4/2022, 4808.25 (down)
1{-6} Submicro, 1/4/2022, 4808.25 (down)
2{-7} Minuscule, 1/24/2022, 4212.75 (up)
C{-8} Subminuscule, 1/26/2022, 4263.75 (up)
Learning and other resources. Elliott wave analysis provides context, not prophecy. As the 20th century semanticist Alfred Korzybski put it this way in his book Science and Sanity (1933), “The map is not the territory … The only usefulness of a map depends on similarity of structure between the empirical world and the map.” And I would add, in the ever-changing markets, we can judge that similarity of structure only after the fact.
See the menu page Analytical Methods for a rundown on where to go for information on Elliott wave analysis.
By Tim Bovee, Portland, Oregon, February 8, 2022
Disclaimer
Tim Bovee, Private Trader tracks the analysis and trades of a private trader for his own accounts. Nothing in this blog constitutes a recommendation to buy or sell stocks, options or any other financial instrument. The only purpose of this blog is to provide education and entertainment.
No trader is ever 100 percent successful in his or her trades. Trading in the stock and option markets is risky and uncertain. Each trader must make trading decisions for his or her own account, and take responsibility for the consequences.
Update 3/11/2021: I exited my bull put vertical options spread on PFE, seven days before expiration, for a $0.80 debit per contract/share, a profit before fees of $27 per contract. Shares were trading at $50.14, down $2.22 from the entry level.
The Implied Volatility Rank at exit was 61.9%, down 20.3 points from the entry level.
I exited because the position reached 25% of maximum potential profit, my normal exit point for earnings plays.
Shares declined by 4.2% over 32 days for a -48% annual rate. The options position produced a 33.8% return for a +385% annual rate.
I have entered a short bull put options spread on PFE, using options that trade for the last time 39 days hence, on March 18. The premium is a $1.07 credit per contract share and the stock at the time of entry was priced at $52.36.
The Implied Volatility Ratio stood at 82.2%.
Premium:
$1.07
Expire OTM
PFE-bull put spread
Strike
Odds
Delta
Puts
Long
45.00
85.0%
13
Break-even
51.07
73.0%
23.5
Short
50.00
61.0%
34
The premium is 42.8% of the width of the position’s short/long spread. The profit zone covers a 2.5% move to the downside and an unlimited move to the upside.
The risk/reward ratio is 3.7:1, with maximum risk of $393 and maximum reward of $107 per contract.
How I chose the trade. The trade was placed to coincide with PFE’s earnings announcement, before the opening bell on the day after entry. The short strikes were set to coincide with the expected move of $3.21 either way, based on options pricing, which gives a price range of $49.63 to $59.01.
By Tim Bovee, Portland, Oregon, February 7, 2022
Disclaimer
Tim Bovee, Private Trader tracks the analysis and trades of a private trader for his own accounts. Nothing in this blog constitutes a recommendation to buy or sell stocks, options or any other financial instrument. The only purpose of this blog is to provide education and entertainment.
No trader is ever 100 percent successful in his or her trades. Trading in the stock and option markets is risky and uncertain. Each trader must make trading decisions for his or her own account, and take responsibility for the consequences.
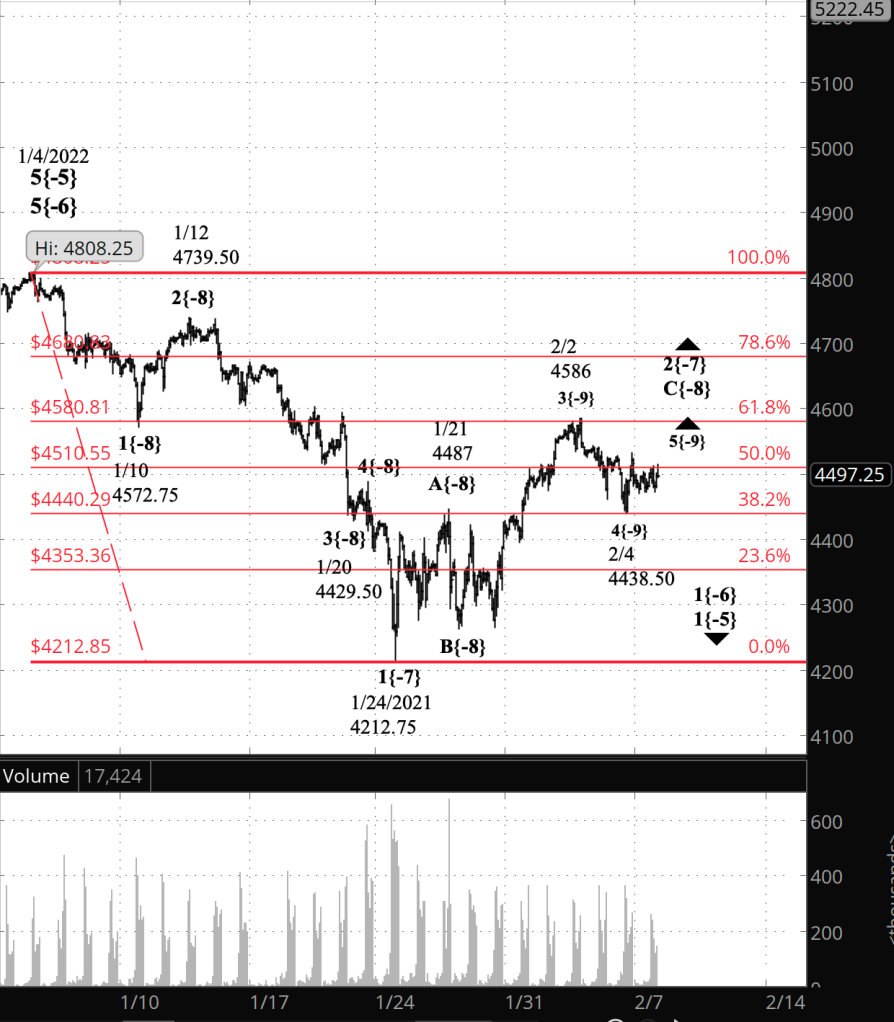
Half an hour before the closing bell. The S&P 500 futures traded within a narrow range during the session, so far less than 45 points wide. No change in the analysis. I’ve updated the chart.
10:10 a.m. New York time
PFE earnings play entry. I’ve entered short bull put options spread on PFE timed to coincide with the company’s earnings announcement Tuesday before the opening bell. I’ve posted an analysis of the trade.
9:35 a.m. New York time
What’s happening now? The S&P 500 E-mini futures have hovered just below the 50% retracement level since trading resumed Sunday afternoon.
What does it mean? By my principal analysis, the third and likely final leg of the upward correction that began on January 24 has internally entered its final rise, which will likely carry the price above the February 2 high, 4586, and higher. The price will remain below the January 4 starting point of the downtrend, 4808.25. The correction will be followed by a resumption of the downtrend that will carry the price below the January 24 start of the correction, 4212.75, and perhaps significantly below that level.
What’s the alternative? There are two alternatives.
Alternative #1: It remains possible that the February 2 high marked the end of the correction and that the downtrend has resumed. A move below 4212.75 would verify this analysis.
Alternative #2: The end of the final leg of the correction will be followed by a declining wave and then a second corrective pattern, in a compound pattern. Compound corrections can string together as many as three corrective patterns.
[S&P 500 E-mini futures at 9:35 a.m., 80-minute bars, with volume]
What does Elliott wave theory say? The correction, wave 2{-7}, is internally in its third and final wave, C{-8}. The C wave has five waves within it, and by my principal analysis began wave 5{-9} from the February 4 low. The resumption of the downtrend following wave 2{-7} will be wave 3{-8}, an energetic decline that will carry the price below 4212.75 and perhaps shockingly lower.
Alternative #1: Wave 2{-7} ended with the February 2 high and wave 3{-7} is taking its first tentative steps.
Alternative #2: Wave C{-8} will be followed by wave X{-8} to the downside and then by wave A{-8} of a second, three-wave corrective pattern. The X{-8} wave will remain above 4212.75, the January 24 low.
We Are Here.
These are the waves currently in progress under my principal analysis. Each line on the list shows the wave number, with the subscript in curly brackets, the traditional degree name, the starting date, the starting price of the S&P 500 E-mini futures, and the direction of the wave.
5{0} Intermediate, 12/21/2018, 2316.75 (up)
3{1} Minor, 3/23/2018 2174 (up)
5{-2} Minute, 10/4/2020, 4267.50 (up)
4{-3} Minuette, 1/4/2022, 4808.25 (down)
A{-4} Subminuette, 1/4/2022, 4808.25 (down)
1{-5} Micro, 1/4/2022, 4808.25 (down)
1{-6} Submicro, 1/4/2022, 4808.25 (down)
2{-7} Minuscule, 1/24/2022, 4212.75 (up)
C{-8} Subminuscule, 1/26/2022, 4263.75 (up)
5{-9} Bitsy, 2/4/2022, 4438.50 (up)
Learning and other resources. Elliott wave analysis provides context, not prophecy. As the 20th century semanticist Alfred Korzybski put it this way in his book Science and Sanity (1933), “The map is not the territory … The only usefulness of a map depends on similarity of structure between the empirical world and the map.” And I would add, in the ever-changing markets, we can judge that similarity of structure only after the fact.
See the menu page Analytical Methods for a rundown on where to go for information on Elliott wave analysis.
By Tim Bovee, Portland, Oregon, February 7, 2022
Disclaimer
Tim Bovee, Private Trader tracks the analysis and trades of a private trader for his own accounts. Nothing in this blog constitutes a recommendation to buy or sell stocks, options or any other financial instrument. The only purpose of this blog is to provide education and entertainment.
No trader is ever 100 percent successful in his or her trades. Trading in the stock and option markets is risky and uncertain. Each trader must make trading decisions for his or her own account, and take responsibility for the consequences.
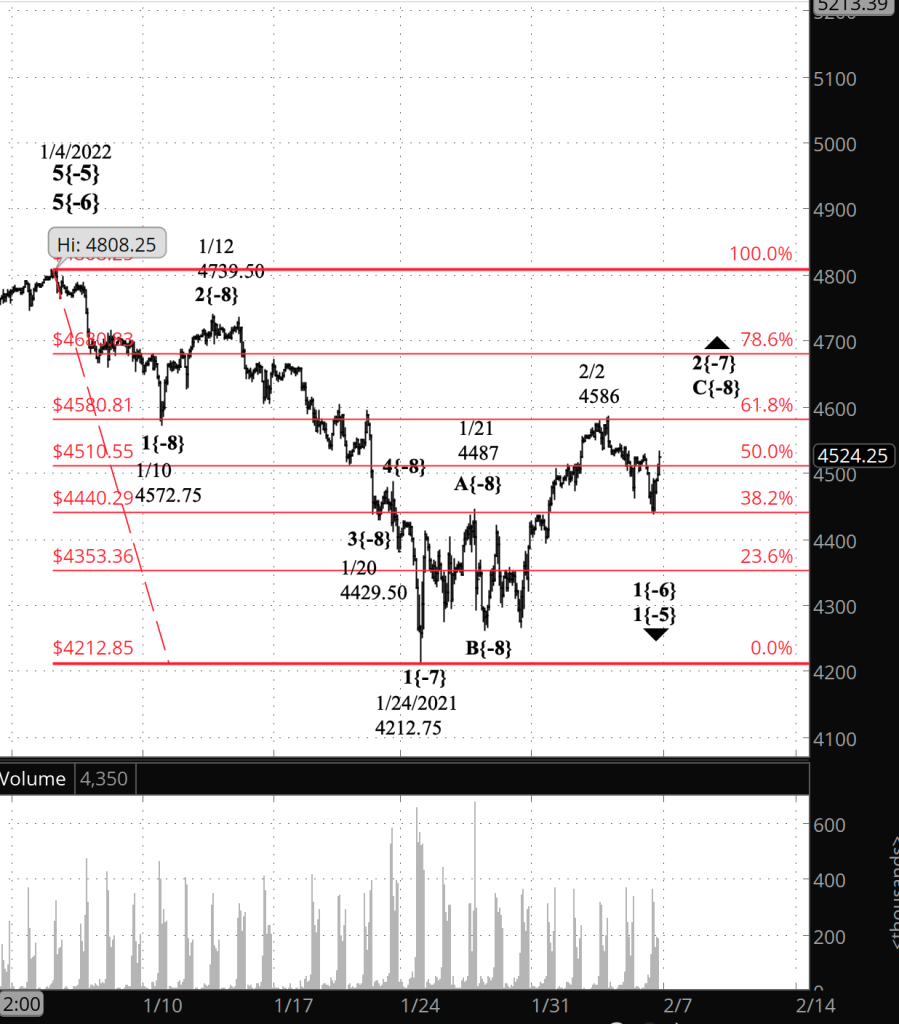
Half an hour before the closing bell. The S&P 500 declined during the session to the 38.25 retracement level and then reversed, again reaching above the 50% retracement as the session approached its end. No change to this morning’s somewhat tentative analysis. I’ve updated the upper chart.
2 p.m. New York time
PRU earnings play exit. I’ve exited my bull put spread on PRU for a 32.5% profit one day after entry and have updated the trade analysis with full results.
9:35 a.m. New York time
What’s happening now? The S&P 500 E-mini futures continued to decline in overnight trading, reaching the 38.2% Fibonacci retracement level.
What does it mean? I’m sticking with yesterday’s principal analysis, but with declining confidence: The upward correction that began on January 24 from 4212.75 continues. It is in its last leg, and when it is complete, the downtrend that began on January 4 from 4808.25 will resume.
What’s the alternative? The greater the decline from the February 2 high, 4586, the greater the likelihood that upward correction is over, having ended at that peak. Under this scenario, the downtrend resumed two days ago and will quickly pick up momentum as it declines below 4212.75.
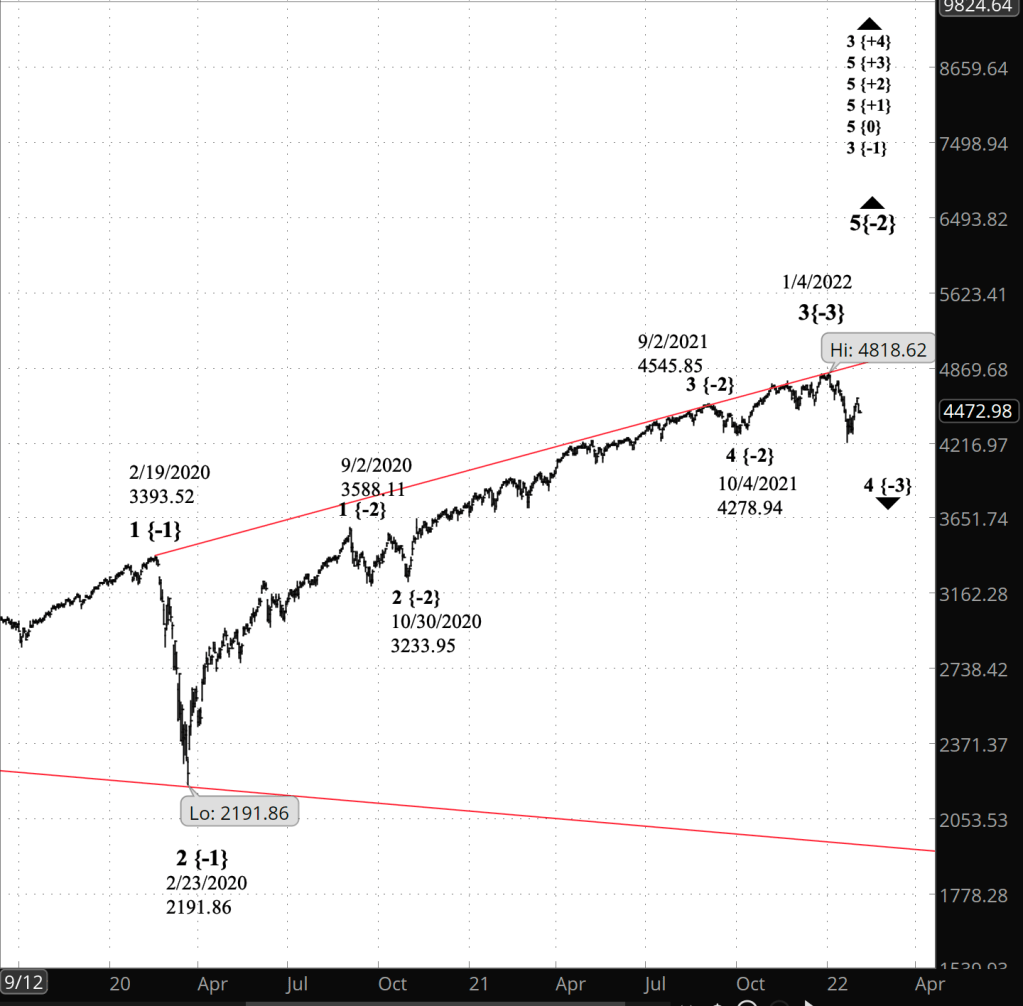
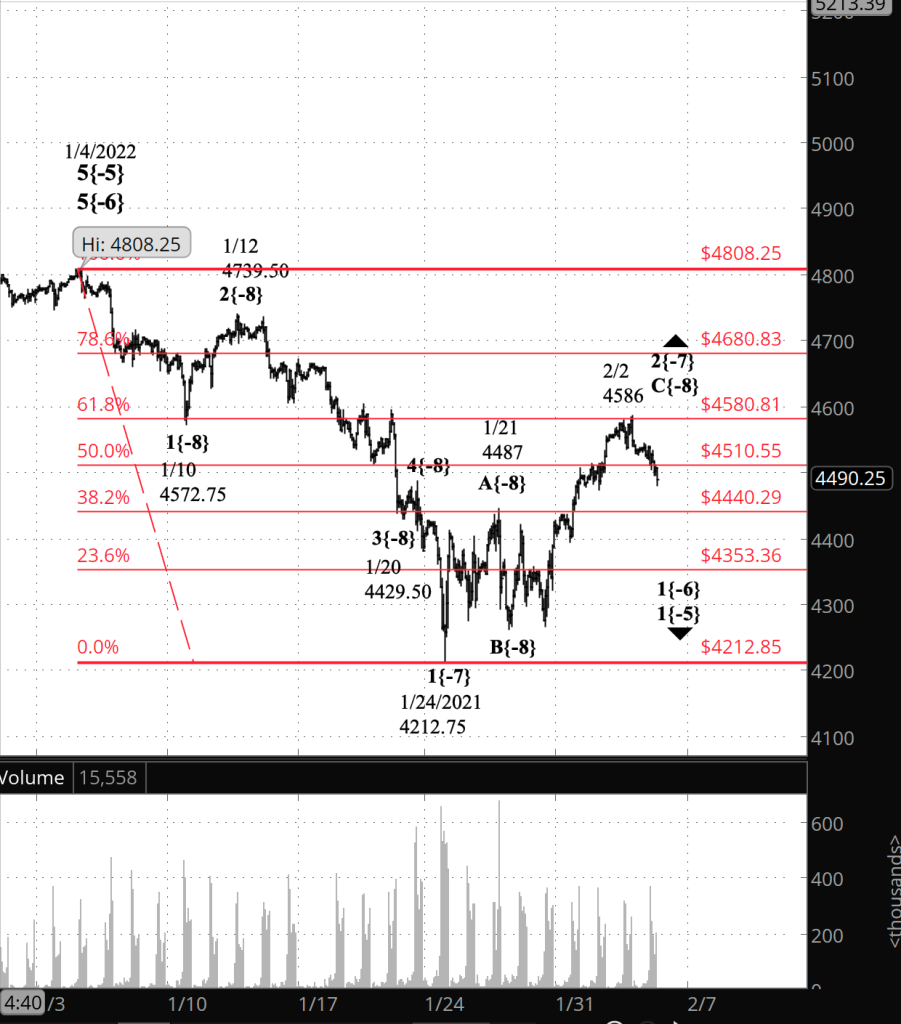
Charts. The upper chart offers a close-up view of the S&P 500 futures, tracking the decline that began January 4. The lower chart offers a longer-term view of the S&P 500 index, tracking the early pandemic crash and the subsequent rise. The red lines on the lower chart are the boundaries of an expanding Diagonal Triangle that began in December 2018.
[S&P 500 E-mini futures at 3:30 p.m., 80-minute bars, with volume]
[S&P 500 index at 9:33 a.m., daily bars]
What does Elliott wave theory say? Under my increasingly less probable principal analysis, wave 2{-7} continues its rise. Internally, I find that the best count is that wave 3{-9} within wave C{-8} ended on February 2 at 4586, and declining wave 4{-9} within C{-8} is underway.
Under my increasingly more probable alternative analysis, wave 2{-7} ended on February 2 and wave 3{-7} has begun its downward journey. Third waves are powerful, generally the longest of the three waves in the direction of a trend, and wave 3{-7} is likely to carry the price below the ending price — 4212.75 — of the preceding wave 1{-7}.
So what will it take to resolve the difficult choice between the two scenarios? The principal analysis will be proven if the price reverses and moves above 4586, the end of wave 3{-9}. The alternative analysis will be proven if the price moves below 4212.75, the endpoint of wave 1{-7}.
We Are Here.
These are the waves currently in progress under the principal analysis. Each line on the list shows the wave number, with the subscript in curly brackets, the traditional degree name, the starting date, the starting price of the S&P 500 E-mini futures, and the direction of the wave.
5{0} Intermediate, 12/21/2018, 2316.75 (up)
3{-1} Minor, 3/23/2018 2174 (up)
5{-2} Minute, 10/4/2020, 4267.50 (up)
4{-3} Minuette, 1/4/2022, 4808.25 (down)
A{-4} Subminuette, 1/4/2022, 4808.25 (down)
1{-5} Micro, 1/4/2022, 4808.25 (down)
1{-6} Submicro, 1/4/2022, 4808.25 (down)
2{-7} Minuscule, 1/24/2022, 4212.75 (up)
C{-8} Subminuscule, 1/26/2022, 4263.75 (up)
Under the alternative analysis, the last two lines would be changed to:
Learning and other resources. Elliott wave analysis provides context, not prophecy. As the 20th century semanticist Alfred Korzybski put it this way in his book Science and Sanity (1933), “The map is not the territory … The only usefulness of a map depends on similarity of structure between the empirical world and the map.” And I would add, in the ever-changing markets, we can judge that similarity of structure only after the fact.
See the menu page Analytical Methods for a rundown on where to go for information on Elliott wave analysis.
By Tim Bovee, Portland, Oregon, February 4, 2022
Disclaimer
Tim Bovee, Private Trader tracks the analysis and trades of a private trader for his own accounts. Nothing in this blog constitutes a recommendation to buy or sell stocks, options or any other financial instrument. The only purpose of this blog is to provide education and entertainment.
No trader is ever 100 percent successful in his or her trades. Trading in the stock and option markets is risky and uncertain. Each trader must make trading decisions for his or her own account, and take responsibility for the consequences.
Update 2/4/2022: I exited my short bull put spread position on PRU, 42 days before expiration, for an $0.83 debit per contract/share, a profit before fees of $27 per contract. Shares were trading at $117.97, up $2.44 from the entry level.
The Implied Volatility Rank at exit was 58.8%, down 21.7 points from the entry level.
I exited because the position reached 25% of maximum potential profit, my normal exit point for earnings plays.
Shares rose by 2.1% over one day for a +771% annual rate. The options position produced a 32.5% return for a +11,874% annual rate.
I have entered a short bull put options spread on PRU, using options that trade for the last time 43 days hence, on March 18. The premium is a $1.10 credit per contract share and the stock at the time of entry was priced at $115.53.
The Implied Volatility Ratio stood at 80.5%.
Premium:
$1.10
Expire OTM
PRU-bull put spread
Strike
Odds
Delta
Puts
Long
105.00
72.0%
24
Break-even
111.10
66.5%
29
Short
110.00
61.0%
34
The premium is 44% of the width of the position’s short/long spread. The profit zone covers a 3.8% move to the downside and an unlimited move to the upside.
The risk/reward ratio is 3.5:1, with maximum risk of $390 and maximum reward of $110 per contract.
How I chose the trade. The trade was placed to coincide with PRU’s earnings announcement, after the closing bell on the day of entry. The short strikes were set to coincide with the expected move of $1.47 either way, based on options pricing, which gives a price range of $114.06 to $117.00.
By Tim Bovee, Portland, Oregon, February 3, 2022
Disclaimer
Tim Bovee, Private Trader tracks the analysis and trades of a private trader for his own accounts. Nothing in this blog constitutes a recommendation to buy or sell stocks, options or any other financial instrument. The only purpose of this blog is to provide education and entertainment.
No trader is ever 100 percent successful in his or her trades. Trading in the stock and option markets is risky and uncertain. Each trader must make trading decisions for his or her own account, and take responsibility for the consequences.
Half an hour before the closing bell. The S&P 500 fell below the 50% retracement level and remained there for much of the trading session. I’m adding another alternative analysis to the mix: That wave C{-8} ended on February 2 at 4586 on the futures chart and that downtrending wave 5{-7} has begun. Otherwise, no change in my analysis. I’ve updated the chart.
10:55 a.m. New York time
PRU earnings play entry. I’ve entered a short bull put options spread on PRU, coinciding with the company’s earnings announcement after the closing bell. I’ve posted an analysis of the trade.
9:35 a.m. New York time
What’s happening now? The S&P 500 E-mini futures fell in overnight trading from Wednesday’s peak, 4586, which is close to the 61.8% Fibonacci retracement level. The decline has reached the 50% retracement level.
What does it mean? The upward correction that began on January 24 is underway. It is in its third and possibly final leg. Internally, that third leg is near completion, with one more upward movement remaining, which will carry the price above 4586. Once the correction is complete, the downtrend that began January 4 will resume, carrying the price below the correction’s starting point, 4212.75.
What’s the alternative? Although a corrective pattern has three waves, it is possible that the correction will extend in a compound structure that links two corrective patterns together, delaying resumption of the downtrend.
[S&P 500 E-mini futures at 3:30 p.m., 80-minute bars, with volume]
What does Elliott wave theory say? Under my principal analysis, the upward correction, wave 2{-7} is underway and is most likely in its final wave, C{-8}. Internally, the drop off from yesterday’s high is wave 4{-9]. and it will be followed by wave 5{-9} to the upside, which will complete the corrective pattern that began on January 24. Wave 4{-9} will be followed by wave 5{-9}, which will carry the price below 4212.75. Third waves tend to have a lot energy and so I would expect this 3rd wave to move significantly below that level.
Under the alternative analysis, wave 2{-7} will extend in a compound correction. Upward wave C{-8} will be followed by upward wave X{-8}, which will connect the first corrective pattern with a second corrective pattern. I’ve seen such compound corrections most often withinin 4th waves, but they do sometimes occur in 2nd waves.
We Are Here.
These are the wave currently in progress. Each line on the list shows the wave number, with the subscript in curly brackets, the traditional degree name, the starting date, the starting price of the S&P 500 E-mini futures, and the direction of the wave.
5{0} Intermediate, 12/21/2018, 2316.75 (up)
3{1} Minor, 3/23/2018 2174 (up)
5{-2} Minute, 10/4/2020, 4267.50 (up)
4{-3} Minuette, 1/4/2022, 4808.25 (down)
A{-4} Subminuette, 1/4/2022, 4808.25 (down)
1{-5} Micro, 1/4/2022, 4808.25 (down)
1{-6} Submicro, 1/4/2022, 4808.25 (down)
4{-7} Minuscule, 1/24/2022, 4212.75 (up)
C{-8} Subminuscule, 1/26/2022, 4263.75 (up)
Learning and other resources. Elliott wave analysis provides context, not prophecy. As the 20th century semanticist Alfred Korzybski put it this way in his book Science and Sanity (1933), “The map is not the territory … The only usefulness of a map depends on similarity of structure between the empirical world and the map.” And I would add, in the ever-changing markets, we can judge that similarity of structure only after the fact.
See the menu page Analytical Methods for a rundown on where to go for information on Elliott wave analysis.
By Tim Bovee, Portland, Oregon, February 3, 2022
Disclaimer
Tim Bovee, Private Trader tracks the analysis and trades of a private trader for his own accounts. Nothing in this blog constitutes a recommendation to buy or sell stocks, options or any other financial instrument. The only purpose of this blog is to provide education and entertainment.
No trader is ever 100 percent successful in his or her trades. Trading in the stock and option markets is risky and uncertain. Each trader must make trading decisions for his or her own account, and take responsibility for the consequences.
Update 3/15/2022: The short puts in my bull put vertical options spread on FB were assigned, three days before expiration. There was no debit on the options. I retained the $8.20 per contract share entry credit and received 100 long shares of FB stock per options contract at the $300 per share strike price, which I sold for $188.43 per share.
That left my long puts in place. I exited them the same day as the assignment, for a $101.97 credit per contract/share, a profit before fees of $10,107 per contract. Shares were trading at $188.03, down $135.08 from the entry level.
Altogther, the result — options and shares combined — was a $1.12 loss before fees per contract share.
The Implied Volatility Rank at exit was 71.7, up 15.1 points from the entry level.
The results that follow are for the options combined with the shares that resulted from the assignment.
The share price declined by 41.8% over 41 days for a +372% annual rate. The options position and the shares resulting from assignment combined produced a 37.2% loss for a -331% annual rate.
I have entered a short bull put options spread on FB, using options that trade for the last time 44 days hence, on March 18. The premium is a $2.40 credit per contract share and the stock at the time of entry was priced at $323.51.
The Implied Volatility Ratio stood at 56.6%.
Premium:
$2.40
Expire OTM
FB-bull put spread
Strike
Odds
Delta
Puts
Long
290.00
76.0%
21
Break-even
302.40
72.0%
24
Short
300.00
68.0%
27
The premium is 48% of the width of the position’s short/long spread. The profit zone covers a 6.5% move to the downside and an unlimited move to the upside.
The risk/reward ratio is 3.2:1, with maximum risk of $760 and maximum reward of $240 per contract.
How I chose the trade. The trade was placed to coincide with FB’s earnings announcement, after the closing bell on the day of entry. The short strikes were set to coincide with the expected move of $19.29 either way, based on options pricing, which gives a price range of $304.23 to $342.8-.
By Tim Bovee, Portland, Oregon, February 2, 2022
Disclaimer
Tim Bovee, Private Trader tracks the analysis and trades of a private trader for his own accounts. Nothing in this blog constitutes a recommendation to buy or sell stocks, options or any other financial instrument. The only purpose of this blog is to provide education and entertainment.
No trader is ever 100 percent successful in his or her trades. Trading in the stock and option markets is risky and uncertain. Each trader must make trading decisions for his or her own account, and take responsibility for the consequences.



You must be logged in to post a comment.