Trader’s Notebook

3:30 p.m. New York time

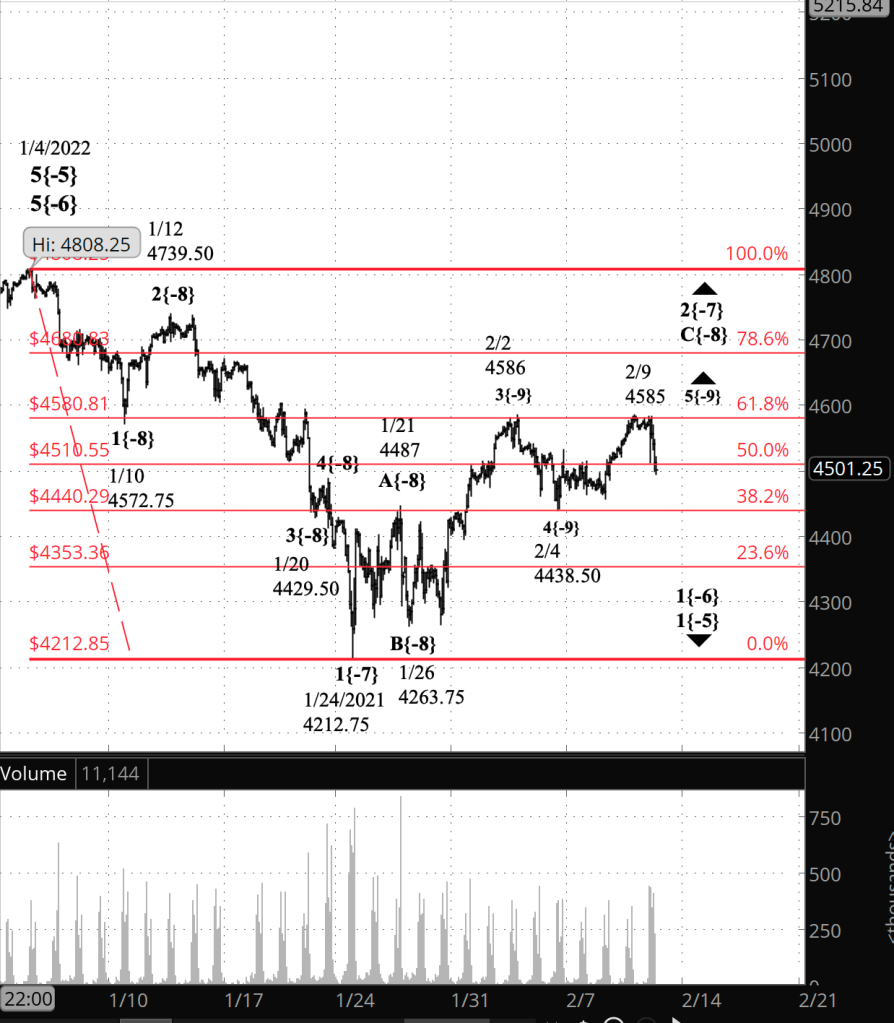
Half an hour before the closing bell. The S&P 500 futures rose by nearly 109 points during the session and then declined, coming to within a point and a half of the overnight low.

The downtrend continues, presently as wave 5{-9} within wave 3{-8}. The end of wave 5{-9} will also be the end of 3{-8}, which will be followed by a, most likely, sideways correction, wave 4{-8}, and then by a final push to the downside, wave 5{-8}.

Looking to the future, that final push at its completion will mark the end of its parent wave, 1{-7}, which began at the January 4 peak. The ensuing upward correction, wave 2{-7}, will most likely retrace much of the decline since early January. The only limit on its upward movement is the start of the preceding wave 1{-7}, at 4808.25. There’s no guarantee, of course, that the price will approach that neighborhood.

I’ve updated the chart.

1:30 p.m. New York time

SPY bear play. I’ve entered a short bear call vertical spread on SPY, based on my analysis of the S&P 500 E-mini futures showing that the downtrend that began January 4 has resumed after an upward correction. I’ve posted an analysis of the trade.

9:35 a.m. New York time

The holiday Trader’s Notebook. The stock markets may take holidays but the futures rarely do. The S&P 500 E-mini futures traded on Monday — a market holiday in the U.S. — and I posted an analysis. It proved to be an eventful day when trading resumed in the evening after a morning session and a break. Monday’s Trader’s Notebook can be found here. It contains charts of both the old analysis and the new one, for comparison. Another item in the Monday post points to the exit analysis of my options position in ACI, which can be read here.

What’s happening now? The S&P 500 E-mini futures fell below a key price level, 4266.25, early in overnight trading and around 3 a.m., the time that the London stock exchange opened, reversed, rising by more than 95 points.

What does it mean? The piercing of the 4266.25 level confirms a resumption of the downtrend that began on January 4 from 4808.25. The correction from January 24 ended and the middle leg of the downtrend began on February 2, from 4586. Internally, the first segment of that middle leg is nearing its end and will be followed by an upward correction of fairly small size. The overnight bounce may have been the beginning of the correction, although it could be smaller reversal within that first segment.

What’s the alternative? The ambiguities resolve around the size — the degree — of the decline so far, which in turn is important in understanding how great a decline is possible at this point. More on the subject in the Elliott wave theory section.
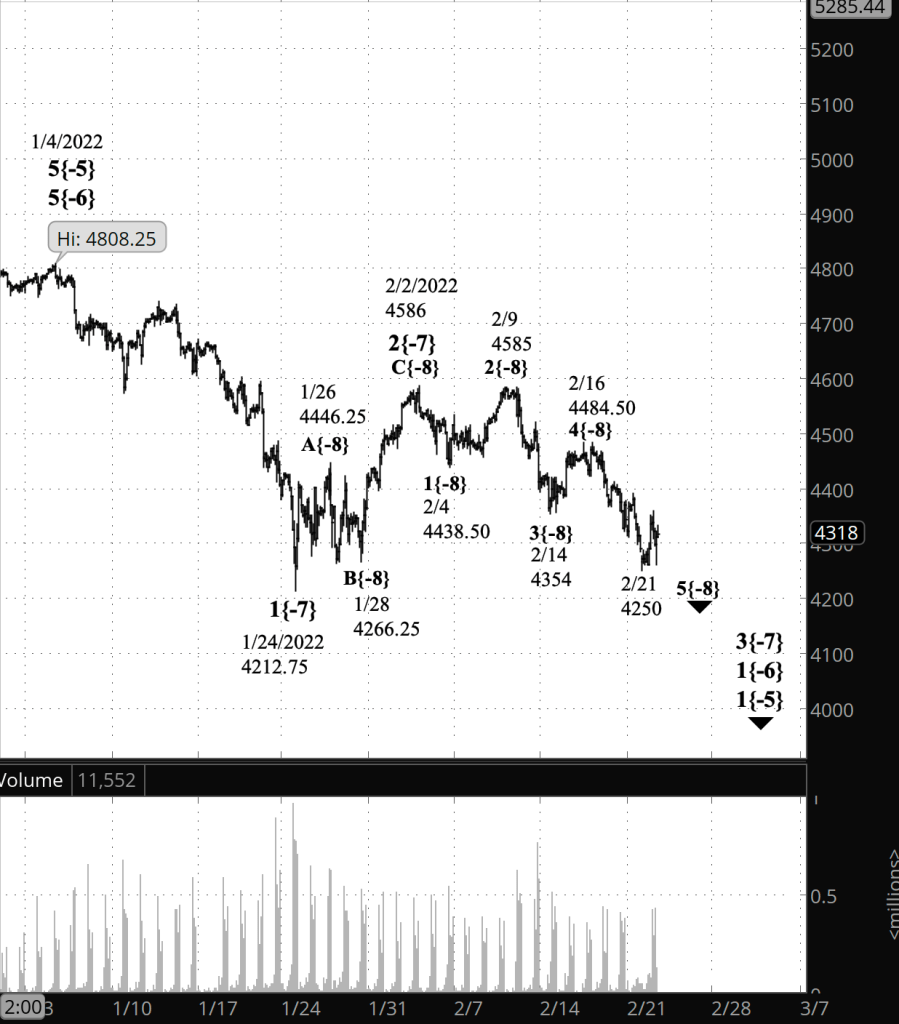
[S&P 500 E-mini futures at 3:30 p.m., 2-hour bars, with volume]

What does Elliott wave theory say? By my principal analysis, the futures are presently in wave 5{-8}, which began on February 16, within wave 3{-7}, beginning February 2, within wave 1{-6}, which began with the January 4 peak. Within wave 5{-8}, it would appear that it is in its final wave, 5{-9}, although it’s not an entirely clear count. The morning bounce could be a correction within wave 5{-9}, or it could be the beginning of a wave 4{-7} correction to the upside.

Prior to Monday evening, my principal analysis had wave 4{-9} underway, a downward compound correction that began on February 2. Under the Elliott rules, 4th waves can’t move beyond the end of the preceding 1st wave, which was at 4266.25. When the price moved below that level Monday evening, I re-analyzed the chart to bring it back into conformance withe the rules of Elliott wave analysis. The only way to do that was to count the correction — wave 2{-7} — as having ended on February 2, and the downtrend to have resumed, as wave 3{-7}, on that date.

In the revised analysis, I’ve counted the waves after February 2 as being of the {-8} degree. There’s no reason why they couldn’t be of the {-9} degree, or even the {-10} degree. Selecting a degree in a new movement is at best a guess. I chose {-8} because the durations seemed to fit in with previous {-8} movements. But an alternative labeling at the {-9} degree or lower is entirely possible.

We Are Here.

These are the waves currently in progress under my principal analysis. Each line on the list shows the wave number, with the subscript in curly brackets, the traditional degree name, the starting date, the starting price of the S&P 500 E-mini futures, and the direction of the wave.

  • 5{0} Intermediate, 12/21/2018, 2316.75 (up)
  • 3{1} Minor, 3/23/2018 2174 (up)
  • 5{-2} Minute, 10/4/2020, 4267.50 (up)
  • 4{-3} Minuette, 1/4/2022, 4808.25 (down)
  • A{-4} Subminuette, 1/4/2022, 4808.25 (down)
  • 1{-5} Micro, 1/4/2022, 4808.25 (down)
  • 1{-6} Submicro, 1/4/2022, 4808.25 (down)
  • 3{-7} Minuscule, 2/2/2022, 4586 (down)
  • 5{-8} Subminuscule, 2/16/2022, 4484.50 (down)

Learning and other resources. Elliott wave analysis provides context, not prophecy. As the 20th century semanticist Alfred Korzybski put it this way in his book Science and Sanity (1933), “The map is not the territory … The only usefulness of a map depends on similarity of structure between the empirical world and the map.” And I would add, in the ever-changing markets, we can judge that similarity of structure only after the fact.

See the menu page Analytical Methods for a rundown on where to go for information on Elliott wave analysis.

By Tim Bovee, Portland, Oregon, February 22, 2022

Disclaimer

Tim Bovee, Private Trader tracks the analysis and trades of a private trader for his own accounts. Nothing in this blog constitutes a recommendation to buy or sell stocks, options or any other financial instrument. The only purpose of this blog is to provide education and entertainment.

No trader is ever 100 percent successful in his or her trades. Trading in the stock and option markets is risky and uncertain. Each trader must make trading decisions for his or her own account, and take responsibility for the consequences.

License
Creative Commons License

All content on Tim Bovee, Private Trader by Timothy K. Bovee is licensed under a Creative Commons Attribution-ShareAlike 4.0 International License.

Based on a work at www.timbovee.com.
Trader’s Notebook

7:15 p.m. New York time

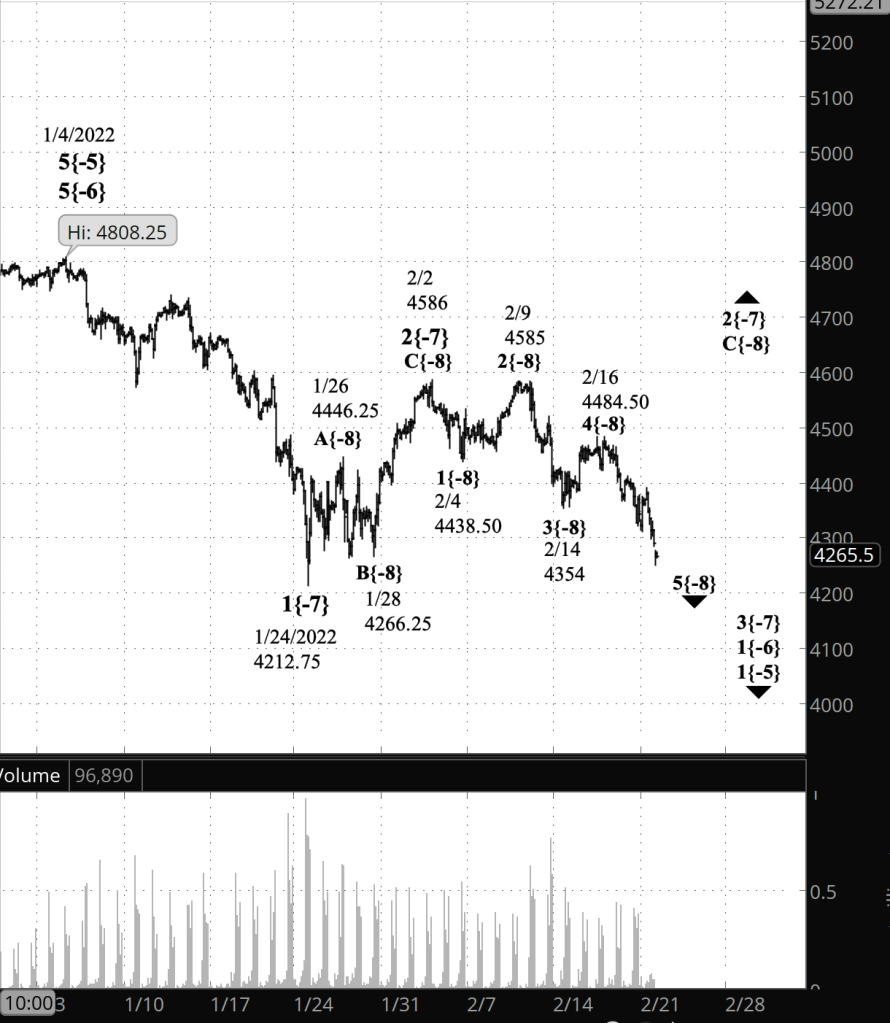
Next-day open. As the S&P 500 futures re-opened, at 5 p.m., for the overnight session leading to Tuesday’s market open, the price declined below the 4266.25 level — the end point 1{-7} — triggering a reanalysis of the chart, which I have completed with a glass of fine wine in hand while watching “The Guilded Age” (Season 1 Episode 2) on HBO Now. The price has so far dropped to 4250. The decline that began on January 4 has resumed. In Elliott wave terms, wave 2{-7} to the upside ended on February 7, wave 3{-7} to the downside is still underway, all within wave 1{-6} to the downside.

I’ve retained the old analysis in the chart from this morning, and here is the new chart.

[S&P 500 E-mini futures at 7:15 p.m., 2-hour bars, with volume]

3 p.m. New York time

At the close. The S&P 500 futures moved slightly lower during the shortened trading session but remained above the price level, 4266.25, that would trigger a re-analysis of the chart. No change in the present prime analysis. I’ve updated the chart.

9:45 a.m. New York time

ACI earnings play expires. The call options in my earnings play on ACI expired on Saturday. In January I exited the put options which were in the money, in order to avoid exercise. The remaining call options remained out of the money and expired without value, providing maximum profit. I’ve updated the ACI analysis with results from the calls exit and with an analysis of the original iron condor position, puts and calls.

9:35 a.m. New York time

Holiday. Most U.S. markets will be closed today in observance of the President’s Day holiday. Futures traded overnight and will continue trading until 1 p.m. New York time.

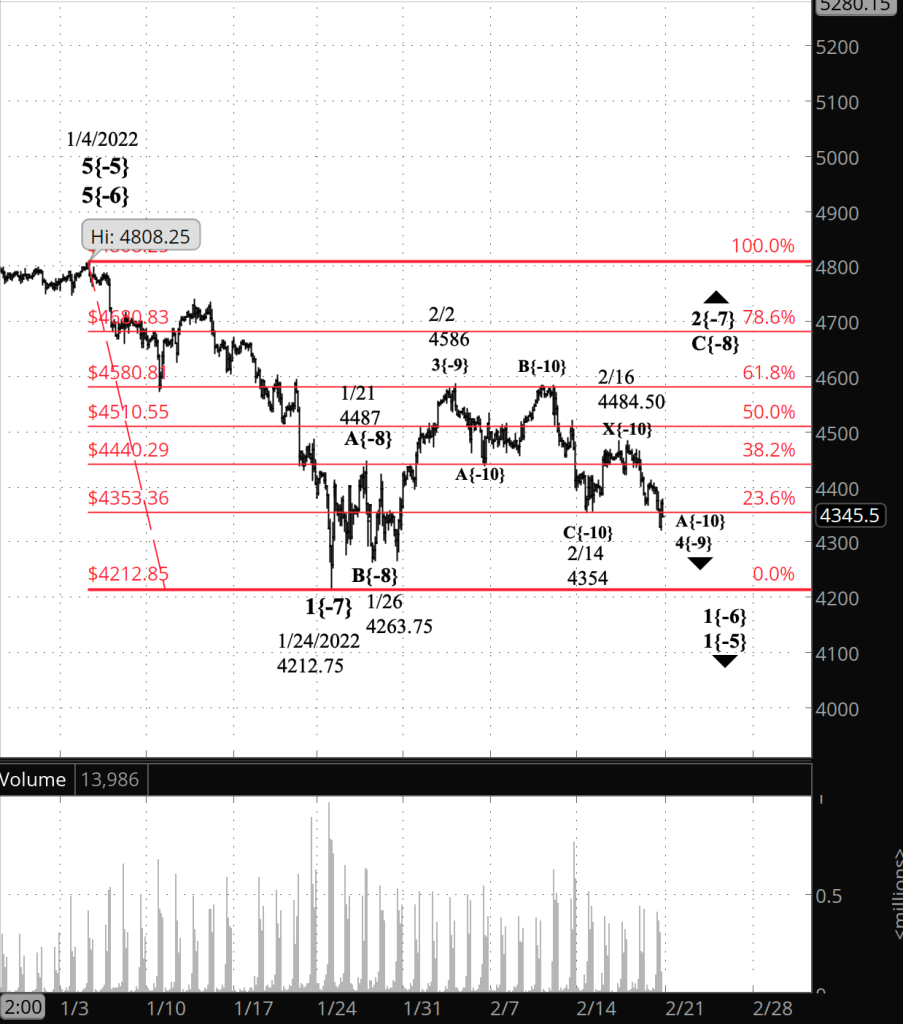
What’s happening now? The S&P 500 E-mini futures initially rose by 50 points in overnight trading but then declined back into the 4310s.

What does it mean? The downward correction that began on February 2 continues. Having completed one one corrective pattern, it has entered the first leg of a second pattern within a compound correction.

What’s the alternative? It’s possible that the February 2 high marked the end of an upward correction, and that the decline since then has been a resumption of the downtrend that began at the January 4 peak. A decline below 4266.25– the January 28 low — would confirm the alternative count.

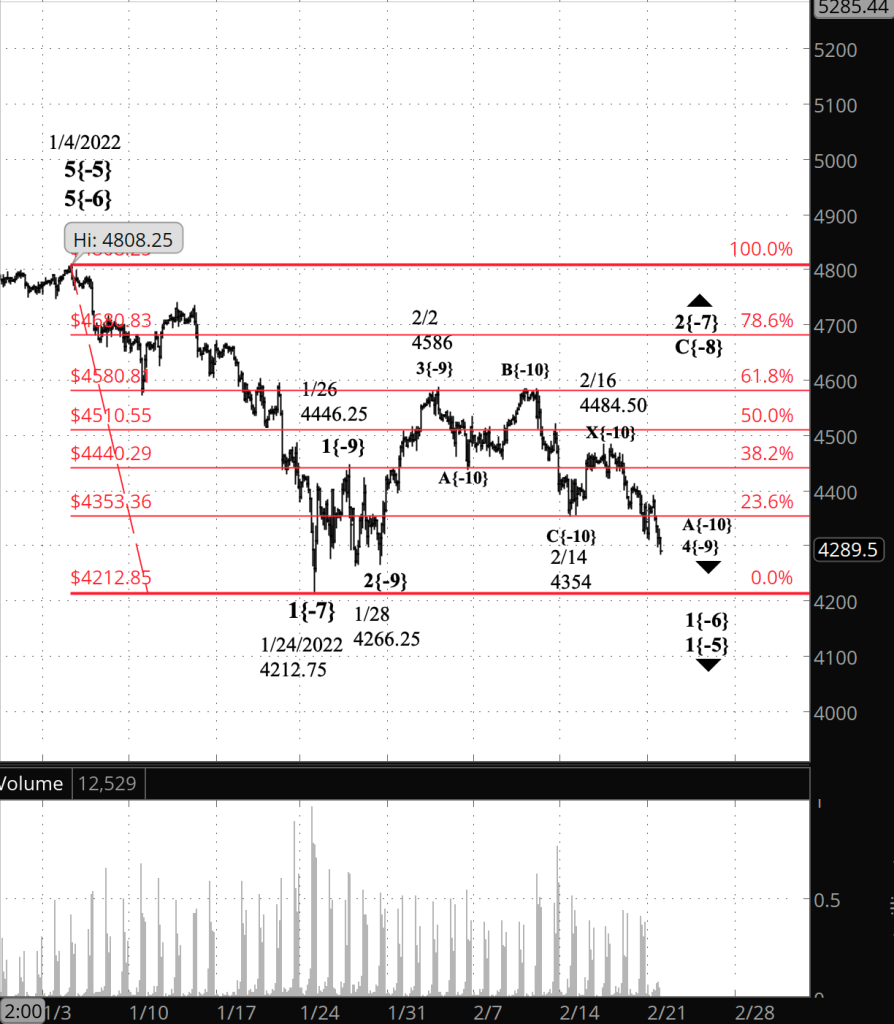
[S&P 500 E-mini futures at 3 p.m., 2-hour bars, with volume]

What does Elliott wave theory say? Under the principal analysis, the first corrective pattern with wave 4{-9} — a downward correction — ended on February 14, the connecting wave X{-10} ended on February 16, and the ensuing decline is wave A{-10}, the first wave of a second corrective pattern within a compound correction. A of Elliott wave analysis forbids a count that shows a 4th wave moving beyond the end of the preceding wave 1 of the same degree. A move below 4266.25 would violate that rule and force a re-analysis of the chart.

The most likely alternative, if the present principal analysis is invalidated, would be an analysis that labels the February 2 high as the end of wave 2{-7}, an upward correction, and the subsequent decline as wave 3{-7}, a resumption of the downtrend that began on January 4.

We Are Here.

These are the waves currently in progress under my principal analysis. Each line on the list shows the wave number, with the subscript in curly brackets, the traditional degree name, the starting date, the starting price of the S&P 500 E-mini futures, and the direction of the wave.

  • 5{0} Intermediate, 12/21/2018, 2316.75 (up)
  • 3{1} Minor, 3/23/2018 2174 (up)
  • 5{-2} Minute, 10/4/2020, 4267.50 (up)
  • 4{-3} Minuette, 1/4/2022, 4808.25 (down)
  • A{-4} Subminuette, 1/4/2022, 4808.25 (down)
  • 1{-5} Micro, 1/4/2022, 4808.25 (down)
  • 1{-6} Submicro, 1/4/2022, 4808.25 (down)
  • 3{-7} Minuscule, 2/2/2022, 4586 (down)
  • 5{-8} Subminuscule, 2/16/2022, 4484.50 (down)

Learning and other resources. Elliott wave analysis provides context, not prophecy. As the 20th century semanticist Alfred Korzybski put it this way in his book Science and Sanity (1933), “The map is not the territory … The only usefulness of a map depends on similarity of structure between the empirical world and the map.” And I would add, in the ever-changing markets, we can judge that similarity of structure only after the fact.

See the menu page Analytical Methods for a rundown on where to go for information on Elliott wave analysis.

By Tim Bovee, Portland, Oregon, February 21, 2022

Disclaimer

Tim Bovee, Private Trader tracks the analysis and trades of a private trader for his own accounts. Nothing in this blog constitutes a recommendation to buy or sell stocks, options or any other financial instrument. The only purpose of this blog is to provide education and entertainment.

No trader is ever 100 percent successful in his or her trades. Trading in the stock and option markets is risky and uncertain. Each trader must make trading decisions for his or her own account, and take responsibility for the consequences.

License
Creative Commons License

All content on Tim Bovee, Private Trader by Timothy K. Bovee is licensed under a Creative Commons Attribution-ShareAlike 4.0 International License.

Based on a work at www.timbovee.com.
Trader’s Notebook

3:30 p.m. New York time

Half an hour before the closing bell. The S&P 500 futures continued to fall, slightly, during the trading session, reaching 30 points plus change below the 4354 level that triggered a reworking of the analysis, which remains as it was with this morning’s revision: The downward correction that began on February 2 continues. In Elliott wave terminology, the correction is wave 4{-9}. I’ve updated the chart.

11:02 a.m. New York time

S&P 500 futures fall below 4354. In my discussion this morning, below, I made the case for 4354 being an important price level in interpreting the chart. I said that a fall below that level would change the principal analysis.

At the time of this posting the price fell below 4354, down to 4340.50 so far.

Here’s the new principal analysis:

The downward correction that began February 2 from 4586 continues and is taking the form of a compound correction. The first corrective pattern ended on February 14 at 4354, and after a rise that connects the first pattern with what follows, a second corrective pattern has begun.

In Elliott wave analysis terminology: Wave 4{-9}, which began on February 2, is underway. Wave C{-10} within that 4th wave was completed on February 14. It was followed by wave X{-10} to the upside, which connects the first corrective pattern with a second pattern, which begins with wave A{-10} to the downside.

10:25 a.m.. New York time

MS earnings play exit. I’ve completed the second leg of my exit from an iron condor position on MS — I exited the puts on February 11, and today, the last trading day before expiration, I exited the calls. Overall, the iron condor produced a 53.2% loss. I’ve updated the trade analysis with the iron condor results, and it also has results for each leg of the exit.

9:35 a.m. New York time

What’s happening now? The S&P 500 E-mini futures rose to 4511.50 in overnight trading and then quickly retreated to 4359.50, just five points above the low of February 14.

What does it mean? The February 14 low, 4354, is important in analyzing the pattern on the chart, allowing us to distinguish between two possible interpretations. More on both in the Elliott wave theory section, but in plain terms, without the analytical jargon —

If the price remains above 4354, as it has so far, then it’s likely that the final leg of the downward correction that began on February 2 ended on February 14, and an uptrend has begun that will carry the price potentially into the 4700s and above.

What’s the alternative? If the price moves below 4354 — the low of February 14 — then under the rules of Elliott wave analysis the downward correction that began on February 2 is still underway.

[S&P 500 E-mini futures at 3:30 p.m., 2-hour bars, with volume]

What does Elliott wave theory say? The February 14 low is the beginning of wave 1{-10} within wave 5{-9}, an uptrend that has the potential of carrying the price significantly higher, although it must remain below the peak of 4808.25 set on January 4. That limit on upward movement is imposed at a higher degree: Wave 2{-7} to the upside is underway, 4808.25 marks the starting point of wave 1{-7} to the downside, and under the the Elliott rules no 2nd wave can move beyond the start of the preceding 1st wave of the same degree.

The limit on the downward movement is imposed the same restriction at a lower degree: Wave 2{-10} to the downside is underway, 4354 marks the starting point of wave 1{-10} to the upside, no 2nd wave can move beyond the starting point of the preceding 1st wave of the same degree.

If the price does move below 4354, then the parent wave 4{-9}, a downward correction that began on February 2, is still underway. Internally, wave 4{-9} has completed one three-wave corrective pattern at the {-10} degree, and the rise that began from February 14 to February 16 is wave X{-10}, a wave that connects the first corrective pattern with a second one that began on February 16 from 4484.50.

What the situation lacks in certainty it makes up for with clarity, a situation that warms the heart of any Elliott wave analyst.

We Are Here.

These are the waves currently in progress under my principal analysis. Each line on the list shows the wave number, with the subscript in curly brackets, the traditional degree name, the starting date, the starting price of the S&P 500 E-mini futures, and the direction of the wave.

  • 5{0} Intermediate, 12/21/2018, 2316.75 (up)
  • 3{1} Minor, 3/23/2018 2174 (up)
  • 5{-2} Minute, 10/4/2020, 4267.50 (up)
  • 4{-3} Minuette, 1/4/2022, 4808.25 (down)
  • A{-4} Subminuette, 1/4/2022, 4808.25 (down)
  • 1{-5} Micro, 1/4/2022, 4808.25 (down)
  • 1{-6} Submicro, 1/4/2022, 4808.25 (down)
  • 2{-7} Minuscule, 1/24/2022, 4212.75 (up)
  • C{-8} Subminuscule, 1/26/2022, 4263.75 (up)
  • 5{-9} Bitsy, 2/14/2022, 4354 (up)

Learning and other resources. Elliott wave analysis provides context, not prophecy. As the 20th century semanticist Alfred Korzybski put it this way in his book Science and Sanity (1933), “The map is not the territory … The only usefulness of a map depends on similarity of structure between the empirical world and the map.” And I would add, in the ever-changing markets, we can judge that similarity of structure only after the fact.

See the menu page Analytical Methods for a rundown on where to go for information on Elliott wave analysis.

By Tim Bovee, Portland, Oregon, February 18, 2022

Disclaimer

Tim Bovee, Private Trader tracks the analysis and trades of a private trader for his own accounts. Nothing in this blog constitutes a recommendation to buy or sell stocks, options or any other financial instrument. The only purpose of this blog is to provide education and entertainment.

No trader is ever 100 percent successful in his or her trades. Trading in the stock and option markets is risky and uncertain. Each trader must make trading decisions for his or her own account, and take responsibility for the consequences.

License
Creative Commons License

All content on Tim Bovee, Private Trader by Timothy K. Bovee is licensed under a Creative Commons Attribution-ShareAlike 4.0 International License.

Based on a work at www.timbovee.com.
Trader’s Notebook

3:30 p.m. New York time

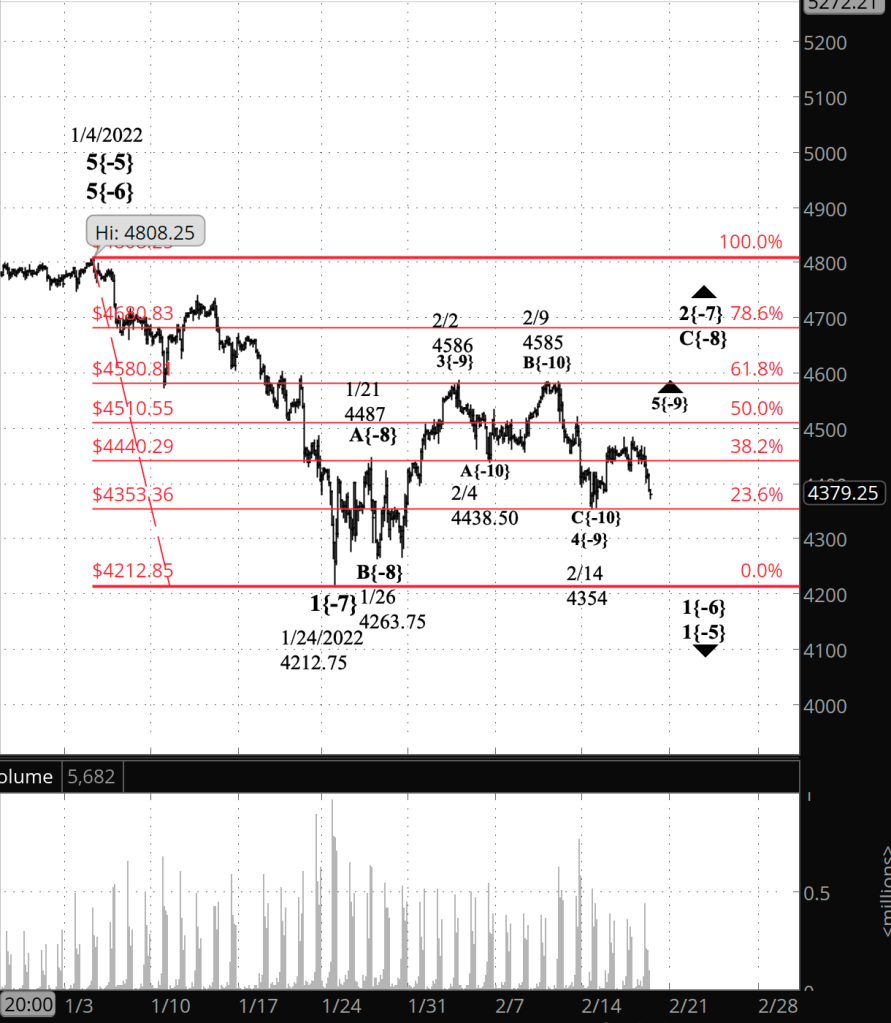
Half an hour before the closing bell. The S&P 500 dropped during the session, approaching the 23.6% Fibonacci retracement level. I consider this to be a small-scale correction within uptrending wave 5{-9}, but will change my mind if it moves below 4354, the February 14 starting point of wave 5{-9}. A drop below that level could mean that a compound correction is underway, the alternative analysis from this morning. No change (yet) in my analysis. I’ve updated the chart.

10 a.m. New York time

WMT earnings play exit. I’ve exited my short bull put vertical spread on WMT for a 48.7% profit and have updated the entry analysis with full results.

9:35 a.m. New York time

What’s happening now? The S&P 500 E-mini futures continued to trade in a narrow range overnight, remaining close to the 38.2% Fibonacci retracement level.

What does it mean? By my principal analysis, the price is in the early stages of a rise that will complete the upward correction that began on January 24, from 4212.75. Upon completion of the correction, the price will resume the downtrend that began on January 4 from 4808.25.

What’s the alternative? The correction is taking a compound form, in which two or three corrective patterns are strung together. In this case, the price is tracing a rise that will connect the corrective pattern that ended on February 14 with a second pattern.

[S&P 500 E-mini futures at 3:30 p.m., 2-hour bars, with volume]

What does Elliott wave theory say? Principal analysis: Wave 5{-9} within wave C{-8} — both of them upward movements — is now underway. The completion of wave 5{-9} will also mark the end of C{-8} and its parent, wave 2{-7}. The subsequent resumption of the downtrend, wave 3{-7} within wave 1{-6}, will carry the price below the the 4212.75 level, perhaps significantly so.

I find the chart to be a bit confusing because of the A-B-C corrections at different levels. For guidance:

  • The low of February 14 ended the C wave of {-10} degree, part of a correction at the {-9} degree.
  • The subsequent wave, 5{-9}, is part of the C wave of the {-8} degree, part of a correction at the {-7} degree.
  • Wave 2{-7} — the larger correction — will end when wave 5{-9} completes wave C{-8}, which in turn completes wave C{-8}, and that event will mark the resumption of the downtrend that began January 4.

Alternative analysis: The wave that connects three-wave corrective patterns within a compound correction are called X waves. If wave 4{-9} is taking the form of a compound correction, then that wave is still underway — wave 5{-9} has not yet begun — and the rise from February 14 is wave X{-10} within wave 4{-9}. It will be followed by another three-wave corrective pattern.

We Are Here.

These are the waves currently in progress under my principal analysis. Each line on the list shows the wave number, with the subscript in curly brackets, the traditional degree name, the starting date, the starting price of the S&P 500 E-mini futures, and the direction of the wave.

  • 5{0} Intermediate, 12/21/2018, 2316.75 (up)
  • 3{1} Minor, 3/23/2018 2174 (up)
  • 5{-2} Minute, 10/4/2020, 4267.50 (up)
  • 4{-3} Minuette, 1/4/2022, 4808.25 (down)
  • A{-4} Subminuette, 1/4/2022, 4808.25 (down)
  • 1{-5} Micro, 1/4/2022, 4808.25 (down)
  • 1{-6} Submicro, 1/4/2022, 4808.25 (down)
  • 2{-7} Minuscule, 1/24/2022, 4212.75 (up)
  • C{-8} Subminuscule, 1/26/2022, 4263.75 (up)
  • 5{-9} Bitsy, 2/14/2022, 4354 (up)

Learning and other resources. Elliott wave analysis provides context, not prophecy. As the 20th century semanticist Alfred Korzybski put it this way in his book Science and Sanity (1933), “The map is not the territory … The only usefulness of a map depends on similarity of structure between the empirical world and the map.” And I would add, in the ever-changing markets, we can judge that similarity of structure only after the fact.

See the menu page Analytical Methods for a rundown on where to go for information on Elliott wave analysis.

By Tim Bovee, Portland, Oregon, February 17, 2022

Disclaimer

Tim Bovee, Private Trader tracks the analysis and trades of a private trader for his own accounts. Nothing in this blog constitutes a recommendation to buy or sell stocks, options or any other financial instrument. The only purpose of this blog is to provide education and entertainment.

No trader is ever 100 percent successful in his or her trades. Trading in the stock and option markets is risky and uncertain. Each trader must make trading decisions for his or her own account, and take responsibility for the consequences.

License
Creative Commons License

All content on Tim Bovee, Private Trader by Timothy K. Bovee is licensed under a Creative Commons Attribution-ShareAlike 4.0 International License.

Based on a work at www.timbovee.com.
WMT Trade

Walmart Inc. (WMT)

Update 2/17/2022: I exited my short bull put vertical spread on WMT, 29 days before expiration, for a $0.78 debit per contract/share, a profit before fees of $38 per contract. Shares were trading at $136.38, up $1.86 from the entry level.

The Implied Volatility Rank at exit was 51.4%, down 27.4 points from the entry level.

I exited because the position exceeded 25% of maximum potential profit, my normal exit point for earnings plays.

Shares rose by 1.4% over one day for a +505% annual rate. The options position produced a 48.7% return for a +17,782% annual rate.


I have entered a short bull put vertical spread on WMT, using options that trade for the last time 30 days hence, on March 18. The premium is a $1.16 credit per contract share and the stock at the time of entry was priced at $134.52.

The Implied Volatility Ratio stood at 78.8%.

Premium:$1.16Expire OTM
WMT-bull put spreadStrikeOddsDelta
Puts
Long125.0079.0%19
Break-even131.1672.0%25.5
Short130.0065.0%32

The premium is 46.4% of the width of the position’s short/long spread. The profit zone covers a 2.5% move to the downside and an unlimited move to the upside.

The risk/reward ratio is 3.3:1, with maximum risk of $384 and maximum reward of $116 per contract.

How I chose the trade. The trade was placed to coincide with WMT’s earnings announcement, before the opening bell on the day after entry. The short strikes were set to coincide with the expected move of $4.71 either way, based on options pricing, which gives a price range of $129.92 to $139.34.

By Tim Bovee, Portland, Oregon, February 16, 2022

Disclaimer

Tim Bovee, Private Trader tracks the analysis and trades of a private trader for his own accounts. Nothing in this blog constitutes a recommendation to buy or sell stocks, options or any other financial instrument. The only purpose of this blog is to provide education and entertainment.

No trader is ever 100 percent successful in his or her trades. Trading in the stock and option markets is risky and uncertain. Each trader must make trading decisions for his or her own account, and take responsibility for the consequences.

License
Creative Commons License

All content on Tim Bovee, Private Trader by Timothy K. Bovee is licensed under a Creative Commons Attribution-ShareAlike 4.0 International License.

Based on a work at www.timbovee.com.
Trader’s Notebook

3:30 p.m. New York time

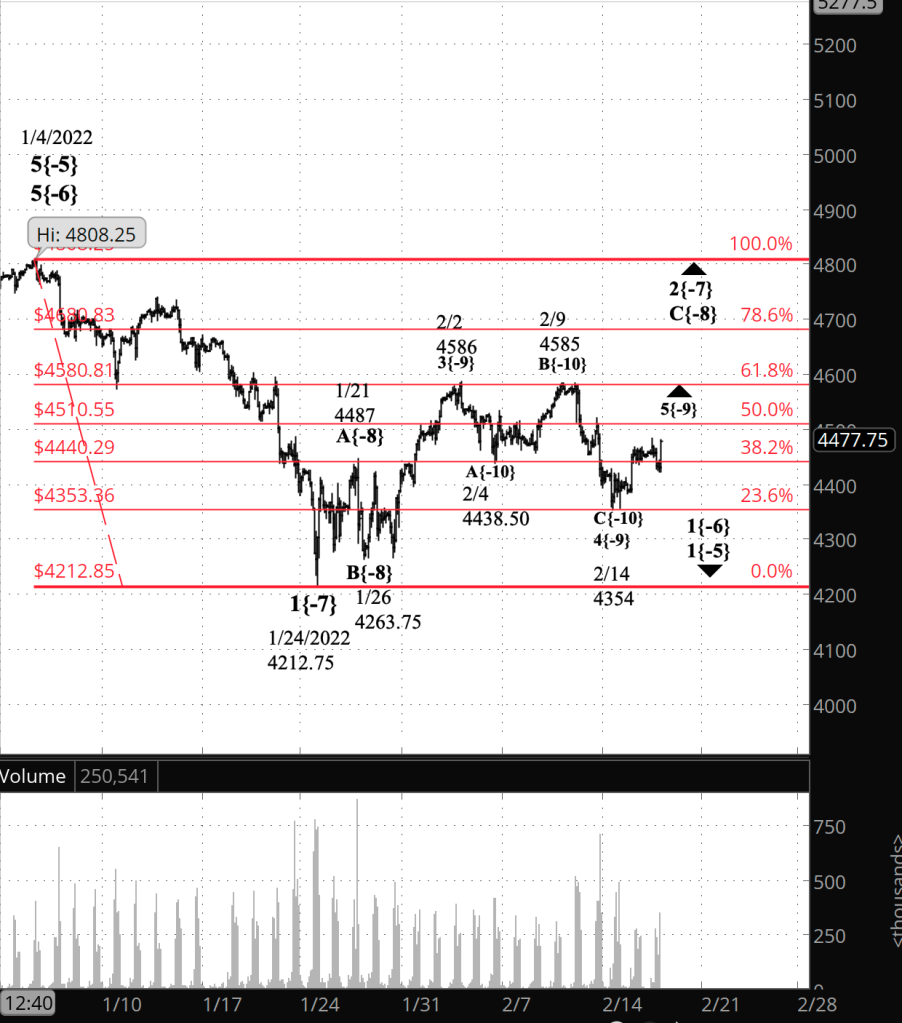
Half an hour before the closing bell. The S&P 500 futures have traded within a 40-point range during the session, continuing a sideways movement. No change in the analysis; wave 5{-9} is in the early stages of its rise. I’ve updated the chart.

10 a.m. New York time

WMT earnings play entry. I’ve entered a short bull put options spread on WMT, timed to coincide with the company’s earnings announcement before the opening bell tomorrow, and have posted an analysis of the trade.

9:35 a.m. New York time

What’s happening now? In overnight trading, the S&P 500 E-mini futures remained close to a 38.2% retracement of the decline from January 4 to January 24.

What does it mean? Under my principal analysis, the sideways movement is a correction within the early portion of a rise that began on February 14 and that will carry the price noticeably higher, perhaps to the 61.8% retracement level. The end of the rise will also mark the end of the upward correction that began on January 24 and will be followed by a decline that will carry the price to 4212 and below, as the downtrend that began on January 4 resumes.

What’s the alternative? The rise from February 14 could be connecting the corrective pattern just ended with a second corrective pattern in a compound correction. Under this scenario, I still anticipate the rise followed by a significant decline, described above in the principal analysis. But they’ll be delayed until the compound correction is complete. Compound corrections can connect up to three corrective patterns.

[S&P 500 E-mini futures at 3:30 p.m., 110-minute bars, with volume]

What does Elliott wave theory say? Under my principal analysis, the rise from February 14 is the early stage of wave 5{-9}, the final wave within wave C{-8}, the final wave in wave 2{-7}, an upward correction that began on January 24.

Wave 5{-9}’s endpoint will mark the end of both waves C{-8} and 2{-7}. Wave 3{-7} will follow, resuming the downtrend with the energy associated with 3rd waves. Wave 3{-7} will remove much of the ambiguity from the market, defining with great clarity that the dominant mood of traders is bearish.

Under the alternative analysis, wave 4{-9} is still underway, and the rise from February 14 is wave X{-10}, connecting two corrective patterns. The end of wave 4{-9}, after a compound correction of two or three corrective patterns, will be followed by uptrending wave 5{-9}, ending wave C{-8} and 2{-8}, and then by downtrending wave 3{-7}.

We Are Here.

These are the waves currently in progress under my principal analysis. Each line on the list shows the wave number, with the subscript in curly brackets, the traditional degree name, the starting date, the starting price of the S&P 500 E-mini futures, and the direction of the wave.

  • 5{0} Intermediate, 12/21/2018, 2316.75 (up)
  • 3{1} Minor, 3/23/2018 2174 (up)
  • 5{-2} Minute, 10/4/2020, 4267.50 (up)
  • 4{-3} Minuette, 1/4/2022, 4808.25 (down)
  • A{-4} Subminuette, 1/4/2022, 4808.25 (down)
  • 1{-5} Micro, 1/4/2022, 4808.25 (down)
  • 1{-6} Submicro, 1/4/2022, 4808.25 (down)
  • 2{-7} Minuscule, 1/24/2022, 4212.75 (up)
  • C{-8} Subminuscule, 1/26/2022, 4263.75 (up)

Learning and other resources. Elliott wave analysis provides context, not prophecy. As the 20th century semanticist Alfred Korzybski put it this way in his book Science and Sanity (1933), “The map is not the territory … The only usefulness of a map depends on similarity of structure between the empirical world and the map.” And I would add, in the ever-changing markets, we can judge that similarity of structure only after the fact.

See the menu page Analytical Methods for a rundown on where to go for information on Elliott wave analysis.

By Tim Bovee, Portland, Oregon, February 16, 2022

Disclaimer

Tim Bovee, Private Trader tracks the analysis and trades of a private trader for his own accounts. Nothing in this blog constitutes a recommendation to buy or sell stocks, options or any other financial instrument. The only purpose of this blog is to provide education and entertainment.

No trader is ever 100 percent successful in his or her trades. Trading in the stock and option markets is risky and uncertain. Each trader must make trading decisions for his or her own account, and take responsibility for the consequences.

License
Creative Commons License

All content on Tim Bovee, Private Trader by Timothy K. Bovee is licensed under a Creative Commons Attribution-ShareAlike 4.0 International License.

Based on a work at www.timbovee.com.
Trader’s Notebook

3:30 p.m. New York time

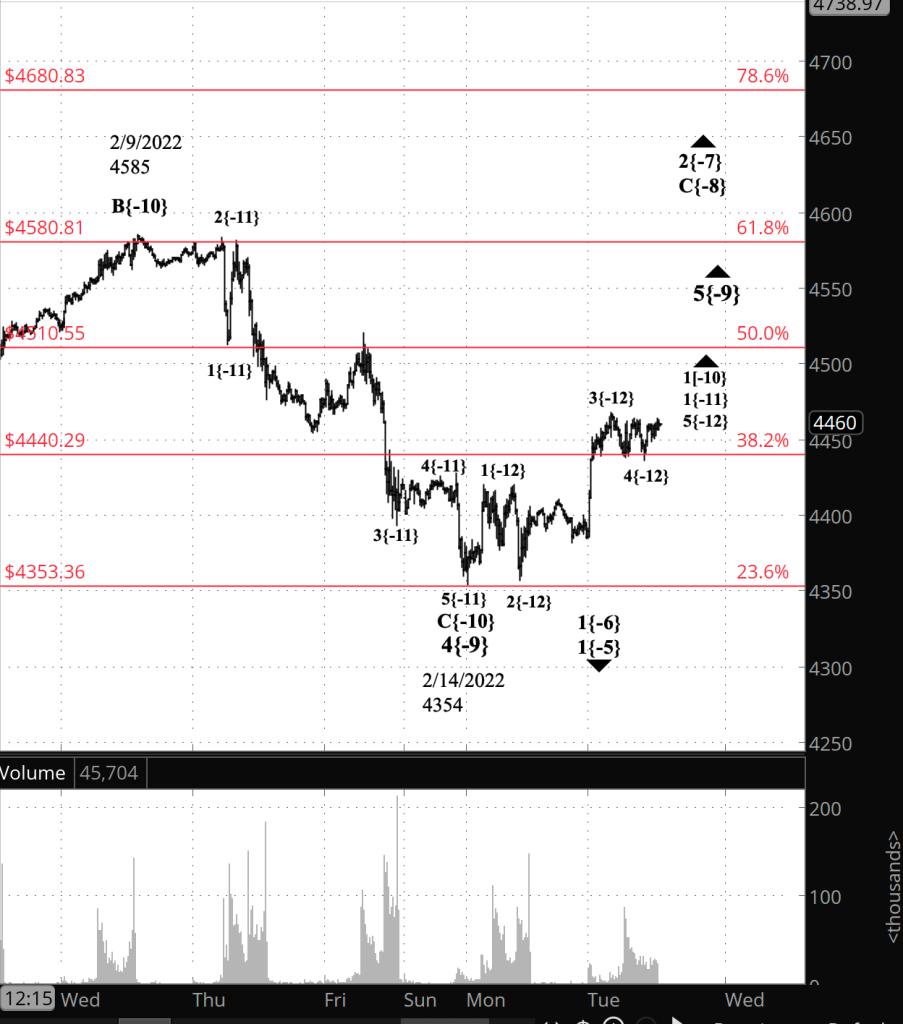
Half an hour before the closing bell. The S&P 500 futures spent the day trading just above the 38.2% retracement level. The very low level downward correction, wave 4{-12} has completed three waves and so has met the basic requirement for completion, and I’ve so marked it on the chart. Under this scenario, wave 5{-12} has begun its rise. It is situated within wave 1{-11} within wave 1{-10} within wave 5{-9} within wave C{-8} within wave 2{-7}. They are subwaves of wave C{-8}, which began on January 24.

9:35 a.m. New York time

What’s happening now? The S&P 500 E-mini futures rose in overnight trading, returning to the 38.2% retracement of the decline that began on January 4. [Corrected to 38.2% rather than 50%.]

What does it mean? The final leg of the final leg of the upward correction that began on January 26 is underway.

What’s the alternative? It’s possible that the rise that began overnight will connect two corrective patterns — the one just finished and one to come — in a compound structure. Such compound corrections can link up to three corrective structures.

[S&P 500 E-mini futures at 3:30 p.m., 15-minute bars, with volume]

What does Elliott wave theory say? The overnight rise marked the beginning of wave 5{-9}, the final wave within wave C{-8}, an upward correction that began on January 26 from 4263.75. The end of wave 5{-9} will also be the end of its parent wave C{-9} and of the correction’s parent, wave 2{-7}, which began on January 24 from 4212.75.

The structure within wave 5{-9} is consistent with an uptrend. From the smaller wave degree to the larger, the current fractal positioning is wave 4{-12} to the downside within a series of rising waves, beginning with wave 1{-11} within wave 1{-10} within wave wave 5{-9}, all of which began February 14 from 4354.

For a broader view, see the chart in yesterday’s Trader’s Diary.

We Are Here.

These are the waves currently in progress under my principal analysis. Each line on the list shows the wave number, with the subscript in curly brackets, the traditional degree name, the starting date, the starting price of the S&P 500 E-mini futures, and the direction of the wave.

  • 5{0} Intermediate, 12/21/2018, 2316.75 (up)
  • 3{1} Minor, 3/23/2018 2174 (up)
  • 5{-2} Minute, 10/4/2020, 4267.50 (up)
  • 4{-3} Minuette, 1/4/2022, 4808.25 (down)
  • A{-4} Subminuette, 1/4/2022, 4808.25 (down)
  • 1{-5} Micro, 1/4/2022, 4808.25 (down)
  • 1{-6} Submicro, 1/4/2022, 4808.25 (down)
  • 2{-7} Minuscule, 1/24/2022, 4212.75 (up)
  • C{-8} Subminuscule, 1/26/2022, 4263.75 (up)
  • 5{-9} Bitsy, 2/14/2022, 4354 (up)
  • 1{-10} Subbitsy, 2/14/2022, 4354 (up)
  • 1{-11} Deci, 2/14/2022, 4354 (up)
  • 5{-12} Centi, 2/15/2022, 4468 (up)

Learning and other resources. Elliott wave analysis provides context, not prophecy. As the 20th century semanticist Alfred Korzybski put it this way in his book Science and Sanity (1933), “The map is not the territory … The only usefulness of a map depends on similarity of structure between the empirical world and the map.” And I would add, in the ever-changing markets, we can judge that similarity of structure only after the fact.

See the menu page Analytical Methods for a rundown on where to go for information on Elliott wave analysis.

By Tim Bovee, Portland, Oregon, February 15, 2022

Disclaimer

Tim Bovee, Private Trader tracks the analysis and trades of a private trader for his own accounts. Nothing in this blog constitutes a recommendation to buy or sell stocks, options or any other financial instrument. The only purpose of this blog is to provide education and entertainment.

No trader is ever 100 percent successful in his or her trades. Trading in the stock and option markets is risky and uncertain. Each trader must make trading decisions for his or her own account, and take responsibility for the consequences.

License
Creative Commons License

All content on Tim Bovee, Private Trader by Timothy K. Bovee is licensed under a Creative Commons Attribution-ShareAlike 4.0 International License.

Based on a work at www.timbovee.com.
Trader’s Notebook

3:30 p.m. New York time

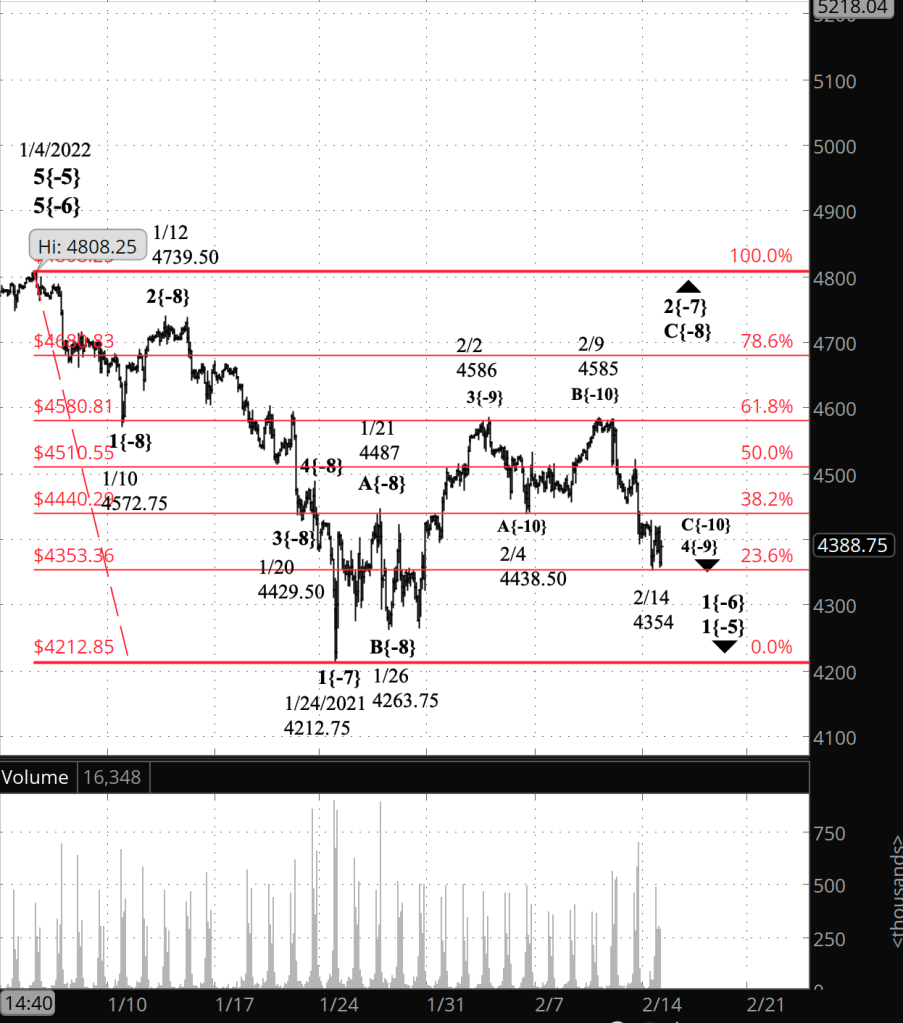
Half an hour before the closing bell. The S&P 500 futures rose toward the 38.2% retracement level and then fell back to the 23.6% level, remaining slightly above the overnight low, 4354. My analysis from the morning is unchanged, and the same goes for the caveat in the alternative analysis. Bottom line: Wave C{-10} within wave 4{-9} — a downward move within an upward correction — is underway, and may have ended at 4354, although that’s not a certainty. When it ends, then wave 5{-9} will begin. The price will rise but will remain below 4808.25, the high of January 4. I’ve updated the chart.

2:30 p.m. New York time

SPY short bear call spread exit. I’ve exited my short bear call options spread spread for an 85% profit and have updated the entry analysis with full details of the exit.

9:35 a.m. New York time

What’s happening now? The S&P 500 E-mini futures fell to 4354 after trading resumed overnight and then reversed, rising slightly. The reversal came at the 23.6% Fibonacci retracement level.

What does it mean? The downward correction continues. It began on February 2 from 4586. The downward correction is a component within an upward correction that began January 24 from 4212.75. Each correction is in its final leg final, and the end of the smaller correction will trigger a final rise that will bring the larger correction to an end.

There is much more to unravel in this complex moment for the markets. See the Elliott wave theory section below for discussion.

What’s the alternative? The primary question is when will the smaller correction end. It may have ended overnight at the 4354 level. But that’s not a certainty.

[S&P 500 E-mini futures at 3:30 p.m., 100-minute bars, with volume]

What does Elliott wave theory say? The smaller, downward correction is wave 4{-9} and internally, it is internally in wave C{-10}. The end of the wave C{-10} will also mark the end of wave 4{-9}, triggering an upward movement, wave 5{-9}, which will remain below the January 4 peak, 2808.25.

The larger correction is wave 2{-7}, which began January 24 from 4212.75, and internally, it is within its final leg, wave C{-8}, whose end will mark a resumption of the downtrend that began on January 4, wave 3{-7}, a powerful wave that almost certainly will carry the price below 4212.75, the end of the preceding 1st wave.

Wave 3{-7} is the middle leg of a 1st wave at the {-6} degree, which in turn is the 1st wave within its parent degree, {-5}, which in turn is part of a downward correction, wave A{-4} within wave 4{-3}, all of which began on January 4.

And so, on to the alternative. Everything hinges on whether wave C{-10} is over or not. It’s a downward movement and will have five subwaves. As I count it, it is now in its 5th wave, which is the shortest of the three downward waves. If the price reverses and that 5th wave continues downward, then it comes down to its length relative to that the preceding 3rd wave. The 3rd wave can’t be the shortest wave in the direction of the trend, and if the 5th wave turns out to be longer than the 3rd, then count will need to be redone

We Are Here.

These are the waves currently in progress under my principal analysis. Each line on the list shows the wave number, with the subscript in curly brackets, the traditional degree name, the starting date, the starting price of the S&P 500 E-mini futures, and the direction of the wave.

  • 5{0} Intermediate, 12/21/2018, 2316.75 (up)
  • 3{1} Minor, 3/23/2018 2174 (up)
  • 5{-2} Minute, 10/4/2020, 4267.50 (up)
  • 4{-3} Minuette, 1/4/2022, 4808.25 (down)
  • A{-4} Subminuette, 1/4/2022, 4808.25 (down)
  • 1{-5} Micro, 1/4/2022, 4808.25 (down)
  • 1{-6} Submicro, 1/4/2022, 4808.25 (down)
  • 2{-7} Minuscule, 1/24/2022, 4212.75 (up)
  • C{-8} Subminuscule, 1/26/2022, 4263.75 (up)
  • 4{-9} Bitsy, 2/2/2022, 4586 (down)
  • C{-10}Subbitsy, 2/9/2022, 4585 (down)

Learning and other resources. Elliott wave analysis provides context, not prophecy. As the 20th century semanticist Alfred Korzybski put it this way in his book Science and Sanity (1933), “The map is not the territory … The only usefulness of a map depends on similarity of structure between the empirical world and the map.” And I would add, in the ever-changing markets, we can judge that similarity of structure only after the fact.

See the menu page Analytical Methods for a rundown on where to go for information on Elliott wave analysis.

By Tim Bovee, Portland, Oregon, February 14, 2022

Disclaimer

Tim Bovee, Private Trader tracks the analysis and trades of a private trader for his own accounts. Nothing in this blog constitutes a recommendation to buy or sell stocks, options or any other financial instrument. The only purpose of this blog is to provide education and entertainment.

No trader is ever 100 percent successful in his or her trades. Trading in the stock and option markets is risky and uncertain. Each trader must make trading decisions for his or her own account, and take responsibility for the consequences.

License
Creative Commons License

All content on Tim Bovee, Private Trader by Timothy K. Bovee is licensed under a Creative Commons Attribution-ShareAlike 4.0 International License.

Based on a work at www.timbovee.com.
Trader’s Notebook

3:30 p.m. New York time

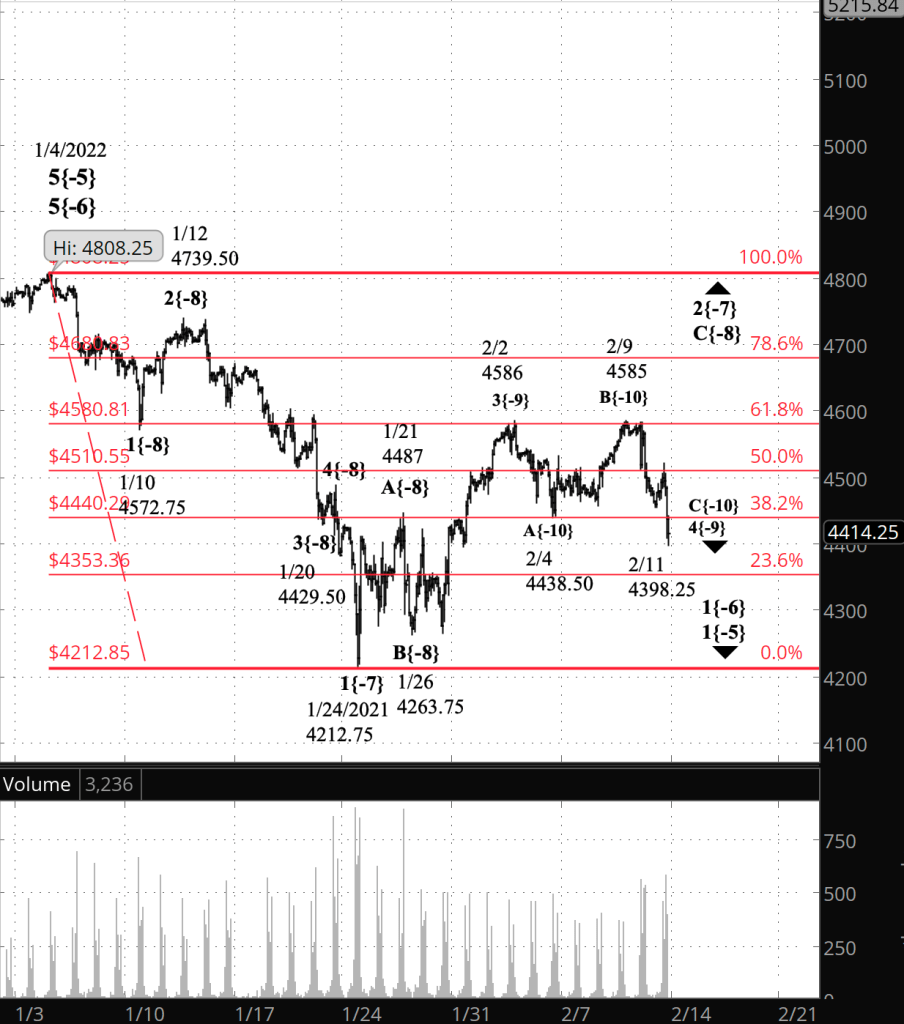
Half an hour before the closing bell. The S&P 500 declined during the session, reaching a low of 4398.25 so far on the futures. The decline put the price below the 38.2% retracement level. There’s nothing in today’s patterns that requires a change in this morning’s analysis, and so it stands. I’ve updated the chart.

2:10 p.m. New York time

MS earnings play, partial exit. MS soared beyond the boundaries of my iron condor after earnings were published, and with seven days left before expiration, I’ve exited the in-the-money calls for a loss to avoid the possibility of assignment. I’ve updated the entry analysis with details of the exit.

9:35 a.m. New York time

What’s happening now? The S&P 500 E-mini futures approached the 38.2% Fibonacci retracement level in overnight trading and then rose to the 50% retracement.

What does it mean? I’ve revised my labeling in light of yesterday’s market movements. The downward correction that began on February 2 is still underway and is in its third and most likely final phase. When the correction is complete, then the price will resume its rise, part of a larger upward correction that began on January 24. The large decline on February 10 was the middle leg of the final phase of the correction. I expect a rise and then a final decline to wrap up the correction.

What are the alternatives? There are two alternatives

Alternative #1: The correction could extend into a compound structure, stringing together two or three corrective patterns.

Alternative #2: The middle leg of the final phase could be the final leg of the final phase. If that’s the case, then the rise overnight is the beginning of the last leg of the larger correction that began on January 24.

[S&P 500 E-mini futures at 3:30 p.m., 100-minute bars, with volume]

What does Elliott wave theory say? My prior analysis had labeled the February 4 low as the end of wave 4{-9}. The magnitude of the movements on February 10 makes a new labeling more in line with the requirement in Elliott that waves have the “right look”. I interpret that to mean that there can’t be a wild divergence in size among waves of the same degree. Yesterday’s outsized movements placed my former labeling beyond “right look”.

So the new labels have the February 4 low as the end of of wave A{-10} within 4{-9}, the February 9 high as the end of wave B{-10}. And then it gets tricky. The low of February 10 would on the chart be a “right look” end point for wave C{-10}. However, the wave 4{-9} correction is taking the form of a Zigzag (with a 5-3-5 internal wave structure). I count only three waves so far within wave C{-10}. So a rise and then a decline will me need to complete C{-10}.

Under my principal analysis, the end of wave C{-10} will also mark the end of its parent wave 4{-9}. However, my Alternative #1 recognizes that it’s possible that the wave 4{-9} correction will take a compound form, with the present first corrective pattern being followed by wave X{-10} to the upside, which will be followed by a second corrective pattern. Compound corrections can contain up to three corrective patterns.

In either case, the correction will be followed by wave 5{-10}, a rise that most likely will move above the February 2 high, 4586, which ended the preceding wave 3{-9}. Fifth waves are sometimes truncated, so there’s no guarantee that wave 5{-9} will reach above that level.

Alternative #2 considers the low of February 10 to be the end of wave 4{-9}, and the subsequent upward movement to be the first tentative step in uptrending wave 5{-9}. In a Flat or Zigzag pattern, wave C{-10} must have five waves internally. I count only three so far, and so I consider this alternative to be less likely. However, there is ambiguity in all waves, and so it could be that wave 5{-9} is now underway.

We Are Here.

These are the waves currently in progress under my principal analysis. Each line on the list shows the wave number, with the subscript in curly brackets, the traditional degree name, the starting date, the starting price of the S&P 500 E-mini futures, and the direction of the wave.

  • 5{0} Intermediate, 12/21/2018, 2316.75 (up)
  • 3{1} Minor, 3/23/2018 2174 (up)
  • 5{-2} Minute, 10/4/2020, 4267.50 (up)
  • 4{-3} Minuette, 1/4/2022, 4808.25 (down)
  • A{-4} Subminuette, 1/4/2022, 4808.25 (down)
  • 1{-5} Micro, 1/4/2022, 4808.25 (down)
  • 1{-6} Submicro, 1/4/2022, 4808.25 (down)
  • 2{-7} Minuscule, 1/24/2022, 4212.75 (up)
  • C{-8} Subminuscule, 1/26/2022, 4263.75 (up)

Learning and other resources. Elliott wave analysis provides context, not prophecy. As the 20th century semanticist Alfred Korzybski put it this way in his book Science and Sanity (1933), “The map is not the territory … The only usefulness of a map depends on similarity of structure between the empirical world and the map.” And I would add, in the ever-changing markets, we can judge that similarity of structure only after the fact.

See the menu page Analytical Methods for a rundown on where to go for information on Elliott wave analysis.

By Tim Bovee, Portland, Oregon, February 11, 2022

Disclaimer

Tim Bovee, Private Trader tracks the analysis and trades of a private trader for his own accounts. Nothing in this blog constitutes a recommendation to buy or sell stocks, options or any other financial instrument. The only purpose of this blog is to provide education and entertainment.

No trader is ever 100 percent successful in his or her trades. Trading in the stock and option markets is risky and uncertain. Each trader must make trading decisions for his or her own account, and take responsibility for the consequences.

License
Creative Commons License

All content on Tim Bovee, Private Trader by Timothy K. Bovee is licensed under a Creative Commons Attribution-ShareAlike 4.0 International License.

Based on a work at www.timbovee.com.
Trader’s Notebook

3:45 p.m. New York time

And there’s more. The S&P 500 futures prices continued to decline, meaning that wave C{-11} within wave 4{-10} still has some downside to go before wave 5{-10} begins. The low as of this update is 4485.50.

3:30 p.m. New York time

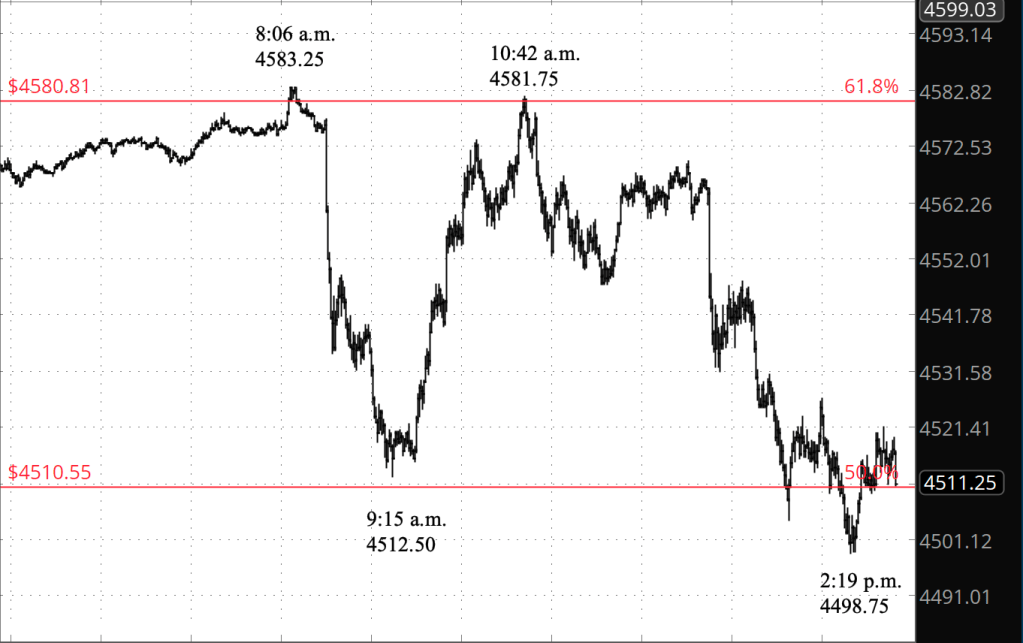
Half an hour before the closing bell. The S&P 500 traced a roller coaster ride today, dropping in less than an hour from the overnight peak of 4583.25 to 4512.50, and then reversing back up to 4581.75 in the first hour of trading session. During the session it worked its way still lower, to 4498.75, before reversing and rising again. As the closing bell approaches, the price is sticking close to the 50% retracement level after a journey that began from slightly above the 61.8% retracement level.

[S&P 500 E-mini futures at 2:50 p.m., 1-minute bars]

What to make of all of that? First, the February 9 high, 4585, was challenged but not surpassed, therefore this morning’s principal analysis stands: Wave 5{-9} within wave C{-8} within wave 2{-7} remains underway. Today’s drama was within wave 5{-9}.

I count it this way: The decline and rise is wave 4{-10}, a downward correction within uptrending wave 5{-9}. The first decline in overnight trading was wave A{-11} within wave 4{-10}, the subsequent rise is wave B{-11}, and the decline that followed is wave C{-11}, ending wave 4{-10}, unless the correction develops into a compound structure. In that latter case, there will be a rising X-wave and then a second corrective pattern.

So in the chart above, clearly, we’re seeing an A wave with three internal waves, a B wave with three waves within it, and a C wave with five waves internally. The 3-3-5 pattern means it’s a Flat, one of the standard corrective patterns identified by Elliott wave theory.

The rise this afternoon is the beginning of wave 5{-10} within wave 5{-9}. I expect it to rise above the February 9 high, 4585, which is the end of wave 3{-10}. If the price does rise above that level, then the wave 5{-10} analysis is proven. If the price stays below that level, then the compound correction analysis is more likely.

I’ve updated the chart below.

9:35 a.m. New York time

What’s happening now? The S&P 500 E-mini futures traded around the 61.8% retracement level overnight until an hour before the opening bell, when it dropped rapidly to the 50% retracement level. The drop covered 65 points in 44 minutes.

What does it mean? The timing of the sudden decline coincided with the release of inflation numbers in the United States. (The inflation report can be read here.)

By my principal analysis, yesterday’s high marked the end, at 4585, of the middle leg of a five-leg rise that began on February 4. The decline this morning is part of the ensuing correction, and the price will soon rise above yesterday’s high in the final leg of the rise from February 4. That final leg will complete the larger upward correction that began on January 24 from 4212.75 and will be followed by a decline below that level, perhaps significantly so.

What’s the alternative? Since the price yesterday remained below the February 2 high, 4586, the downward correction from February 2 within the upward correction that began January 24 can be seen as still underway rather than having ended on February 4. There are other alternatives looking further out (see yesterday’s Trader’s Notebook), but for now, this is the one that counts.

[S&P 500 E-mini futures at 3:30 p.m., 90-minute bars, with volume]

What does Elliott wave theory say? Under my principal analysis, this morning’s decline is wave 4{-10} within uptrending wave 5{-9} within uptrending wave C{-8} within the upward correction 4{-8},. which began on January 24.

Under my alternative analysis, this morning’s decline is the beginning of wave C{-10} within downward correction wave 4{-9} within uptrending wave C{-8} within the upward correction 4{-8},. which began on January 24.

We Are Here.

These are the waves currently in progress under my principal analysis. Each line on the list shows the wave number, with the subscript in curly brackets, the traditional degree name, the starting date, the starting price of the S&P 500 E-mini futures, and the direction of the wave.

  • 5{0} Intermediate, 12/21/2018, 2316.75 (up)
  • 3{1} Minor, 3/23/2018 2174 (up)
  • 5{-2} Minute, 10/4/2020, 4267.50 (up)
  • 4{-3} Minuette, 1/4/2022, 4808.25 (down)
  • A{-4} Subminuette, 1/4/2022, 4808.25 (down)
  • 1{-5} Micro, 1/4/2022, 4808.25 (down)
  • 1{-6} Submicro, 1/4/2022, 4808.25 (down)
  • 2{-7} Minuscule, 1/24/2022, 4212.75 (up)
  • C{-8} Subminuscule, 1/26/2022, 4263.75 (up)

Learning and other resources. Elliott wave analysis provides context, not prophecy. As the 20th century semanticist Alfred Korzybski put it this way in his book Science and Sanity (1933), “The map is not the territory … The only usefulness of a map depends on similarity of structure between the empirical world and the map.” And I would add, in the ever-changing markets, we can judge that similarity of structure only after the fact.

See the menu page Analytical Methods for a rundown on where to go for information on Elliott wave analysis.

By Tim Bovee, Portland, Oregon, February 10, 2022

Disclaimer

Tim Bovee, Private Trader tracks the analysis and trades of a private trader for his own accounts. Nothing in this blog constitutes a recommendation to buy or sell stocks, options or any other financial instrument. The only purpose of this blog is to provide education and entertainment.

No trader is ever 100 percent successful in his or her trades. Trading in the stock and option markets is risky and uncertain. Each trader must make trading decisions for his or her own account, and take responsibility for the consequences.

License
Creative Commons License

All content on Tim Bovee, Private Trader by Timothy K. Bovee is licensed under a Creative Commons Attribution-ShareAlike 4.0 International License.

Based on a work at www.timbovee.com.