Trader’s Notebook

3:30 p.m. New York time

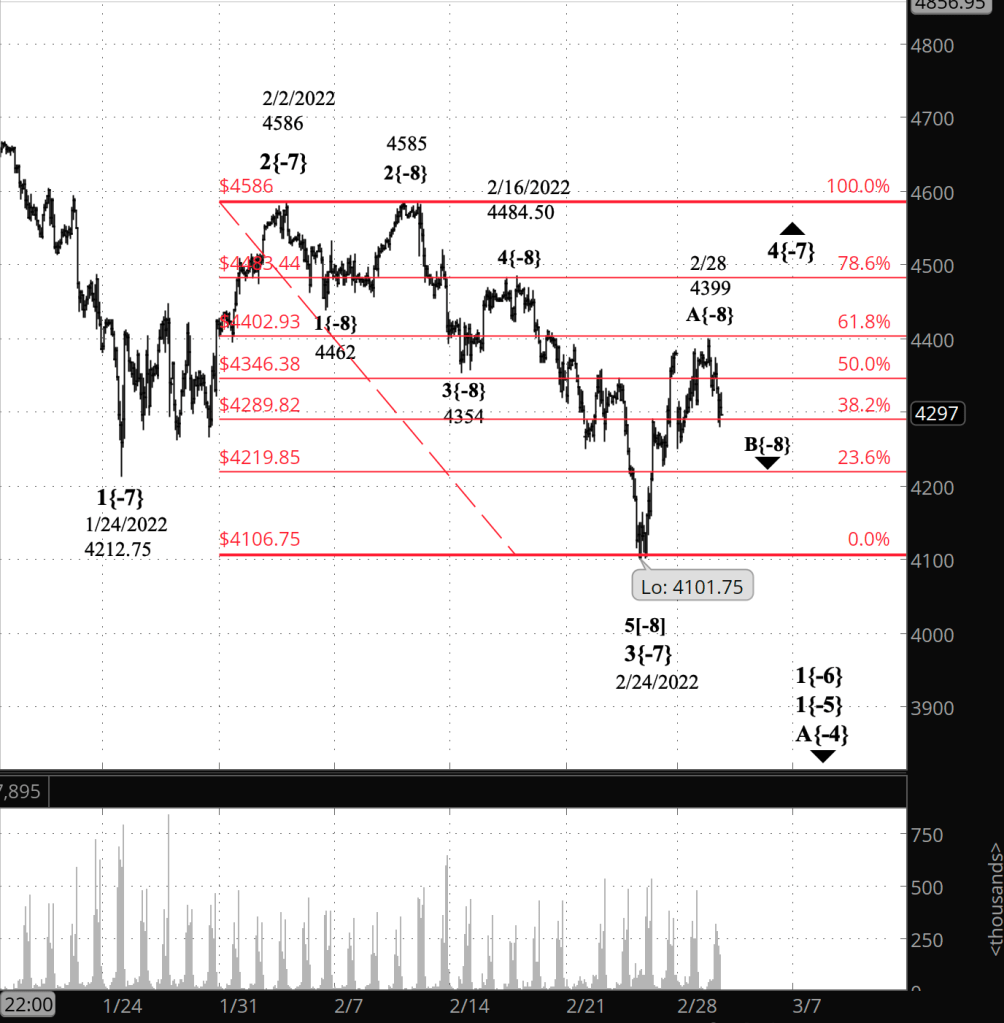
Half an hour before the closing bell. The S&P 500 futures continued their decline during the day, reaching below the 38.2% retracement level. That’s a deep enough decline for me to switch the chart to showing the February 28 peak as the end of wave A{-8}, the first wave within the upward correction that began on February 24, wave 4{-7}. The downtrend that followed that peak is wave B{-8}, and it will be followed by wave C{-8} to the upside, which most likely will complete the wave 4{-7} correction. It’s possible that the correction will take a compound form, which links two or three corrective patterns together, and that would stretch the correction out for a longer time. After the correction is over, the downtrend will resume as wave 5{-7} to the downside, which will move below the February 24 low of 4101.75.

10:30 a.m. New York time

KR earnings play exit. I’ve exited my short bull put vertical spread on KR, an earnings play, for 25% of maximum potential profit and have updated the trade analysis with full results.

9:35 a.m. New York time

What’s happening now? The S&P 500 E-mini futures reached a high of 4399 in overnight trading, just below the 61.8% Fibonacci retracement level, and then retreated slightly.

What does it mean? Under my principal analysis, the first wave of the upward correction that began February 24 is still underway. The analysis will be proven if the price rises above 4399 and then, when the first wave is complete, declines in a second wave with three waves internally.

What’s the alternative? The high of February 28 marks the end of the entire correction and subsequent decline is a resumption of the downtrend that began on January 4. If the price declines in five waves, it adds credence to this scenario, and the lower the price goes, the more likely it becomes. A decline below the February 24 low, 4101.75, would be an unquestionable confirmation.
[S&P 500 E-mini futures at 3:30 p.m., 90-minute bars, with volume]

What does Elliott wave theory say? Under the principal analysis wave A{-8} within wave 4{-7} is still underway, although it may have ended at 4399, the overnight high. Under the alternative analysis, the overnight high marked the end of wave C{-8} within wave 4{-7}, and the downtrend has resumed with wave 5{-7}, which will carry the price below 4101.75, the endpoint of wave 3{-7}. and perhaps significantly below that level.

We Are Here.

These are the waves currently in progress under my principal analysis. Each line on the list shows the wave number, with the subscript in curly brackets, the traditional degree name, the starting date, the starting price of the S&P 500 E-mini futures, and the direction of the wave.

  • 5{0} Intermediate, 12/21/2018, 2316.75 (up)
  • 3{1} Minor, 3/23/2018 2174 (up)
  • 5{-2} Minute, 10/4/2020, 4267.50 (up)
  • 4{-3} Minuette, 1/4/2022, 4808.25 (down)
  • A{-4} Subminuette, 1/4/2022, 4808.25 (down)
  • 1{-5} Micro, 1/4/2022, 4808.25 (down)
  • 1{-6} Submicro, 1/4/2022, 4808.25 (down)
  • 4{-7} Minuscule, 2/24/2022, 4101.75 (up)
  • A{-8} Subminuscule, 2/24/2022, 4101.75 (up)

Learning and other resources. Elliott wave analysis provides context, not prophecy. As the 20th century semanticist Alfred Korzybski put it this way in his book Science and Sanity (1933), “The map is not the territory … The only usefulness of a map depends on similarity of structure between the empirical world and the map.” And I would add, in the ever-changing markets, we can judge that similarity of structure only after the fact.

See the menu page Analytical Methods for a rundown on where to go for information on Elliott wave analysis.

By Tim Bovee, Portland, Oregon, March 1, 2022

Disclaimer

Tim Bovee, Private Trader tracks the analysis and trades of a private trader for his own accounts. Nothing in this blog constitutes a recommendation to buy or sell stocks, options or any other financial instrument. The only purpose of this blog is to provide education and entertainment.

No trader is ever 100 percent successful in his or her trades. Trading in the stock and option markets is risky and uncertain. Each trader must make trading decisions for his or her own account, and take responsibility for the consequences.

License
Creative Commons License

All content on Tim Bovee, Private Trader by Timothy K. Bovee is licensed under a Creative Commons Attribution-ShareAlike 4.0 International License.

Based on a work at www.timbovee.com.
OKE Trade

ONEOK Inc. (OKE)

Update 3/2/2022: I exited my short bull put vertical options spread on OKE, 43 days before expiration, for a $0.94 debit per contract/share, a profit before fees of $31 per contract. Shares were trading at $66.34, up $1.99 from the entry level.

The Implied Volatility Rank at exit was 27.0, down half a point from the entry level.

I exited because the position reached 25% of maximum potential profit, my normal exit point for earnings plays.

Shares rose by 3.1% over two days for a +564% annual rate. The options position produced a 33.0% return for a +6,019% annual rate.


I have entered a short bull put options spread on OKE, using options that trade for the last time 45 days hence, on April 14. The premium is a $1.25 credit per contract share and the stock at the time of entry was priced at $65.46.

The Implied Volatility Ratio stood at 27.5%.

Premium:$1.25Expire OTM
OKE-bull put spreadStrikeOddsDelta
Puts
Long57.5078.0%17
Break-even63.7567.5%27
Short62.5057.0%37

The premium is 50% of the width of the position’s short/long spread. The profit zone covers a 0.9% move to the downside and an unlimited move to the upside.

The risk/reward ratio is 3:1, with maximum risk of $375 and maximum reward of $125 per contract.

How I chose the trade. The trade was placed to coincide with OKE’s earnings announcement, after the closing bell on the day of entry. The short strikes were set to coincide with the expected move of $0.47 either way, based on options pricing, which gives a price range of $64.20 to $65.14.

By Tim Bovee, Portland, Oregon, February 28, 2022

Disclaimer

Tim Bovee, Private Trader tracks the analysis and trades of a private trader for his own accounts. Nothing in this blog constitutes a recommendation to buy or sell stocks, options or any other financial instrument. The only purpose of this blog is to provide education and entertainment.

No trader is ever 100 percent successful in his or her trades. Trading in the stock and option markets is risky and uncertain. Each trader must make trading decisions for his or her own account, and take responsibility for the consequences.

License
Creative Commons License

All content on Tim Bovee, Private Trader by Timothy K. Bovee is licensed under a Creative Commons Attribution-ShareAlike 4.0 International License.

Based on a work at www.timbovee.com.
KR Trade

The Kroger Co. (KR)

Update 3/1/2022: I exited my bull put vertical options spread on KR, 44 days before expiration, for a $0.66 debit per contract/share, a profit before fees of $22 per contract. Shares were trading at $48.45, up $1.83 from the entry level.

The Implied Volatility Rank at exit was 98.6%, down 3.4 points from the entry level.

I exited because the position reached 25% of maximum potential profit, my normal exit point for earnings plays.

Shares rose by 3.9% over one day for a +1,433% annual rate. The options position produced a 33.3% return for a +12,167% annual rate.


I have entered a short bull put options spread on KR, using options that trade for the last time 45 days hence, on April 14. The premium is a $0.88 credit per contract share and the stock at the time of entry was priced at $46,62.

The Implied Volatility Ratio stood at 102%.

Premium:$0.88Expire OTM
KR-bull put spreadStrikeOddsDelta
Puts
Long40.0085.0%11
Break-even44.8873.5%21.5
Short44.0062.0%32

The premium is 44% of the width of the position’s short/long spread. The profit zone covers a 3.7% move to the downside and an unlimited move to the upside.

The risk/reward ratio is 3.5:1, with maximum risk of $312 and maximum reward of $88 per contract.

How I chose the trade. The trade was placed to coincide with KR’s earnings announcement, before the opening bell on the day after entry. The short strike was set to coincide with the expected move of $2.97 either way, based on options pricing, which gives a price range of $43.64 to $49.58.

By Tim Bovee, Portland, Oregon, February 28, 2022

Disclaimer

Tim Bovee, Private Trader tracks the analysis and trades of a private trader for his own accounts. Nothing in this blog constitutes a recommendation to buy or sell stocks, options or any other financial instrument. The only purpose of this blog is to provide education and entertainment.

No trader is ever 100 percent successful in his or her trades. Trading in the stock and option markets is risky and uncertain. Each trader must make trading decisions for his or her own account, and take responsibility for the consequences.

License
Creative Commons License

All content on Tim Bovee, Private Trader by Timothy K. Bovee is licensed under a Creative Commons Attribution-ShareAlike 4.0 International License.

Based on a work at www.timbovee.com.
Trader’s Notebook

3:30 p.m. New York time

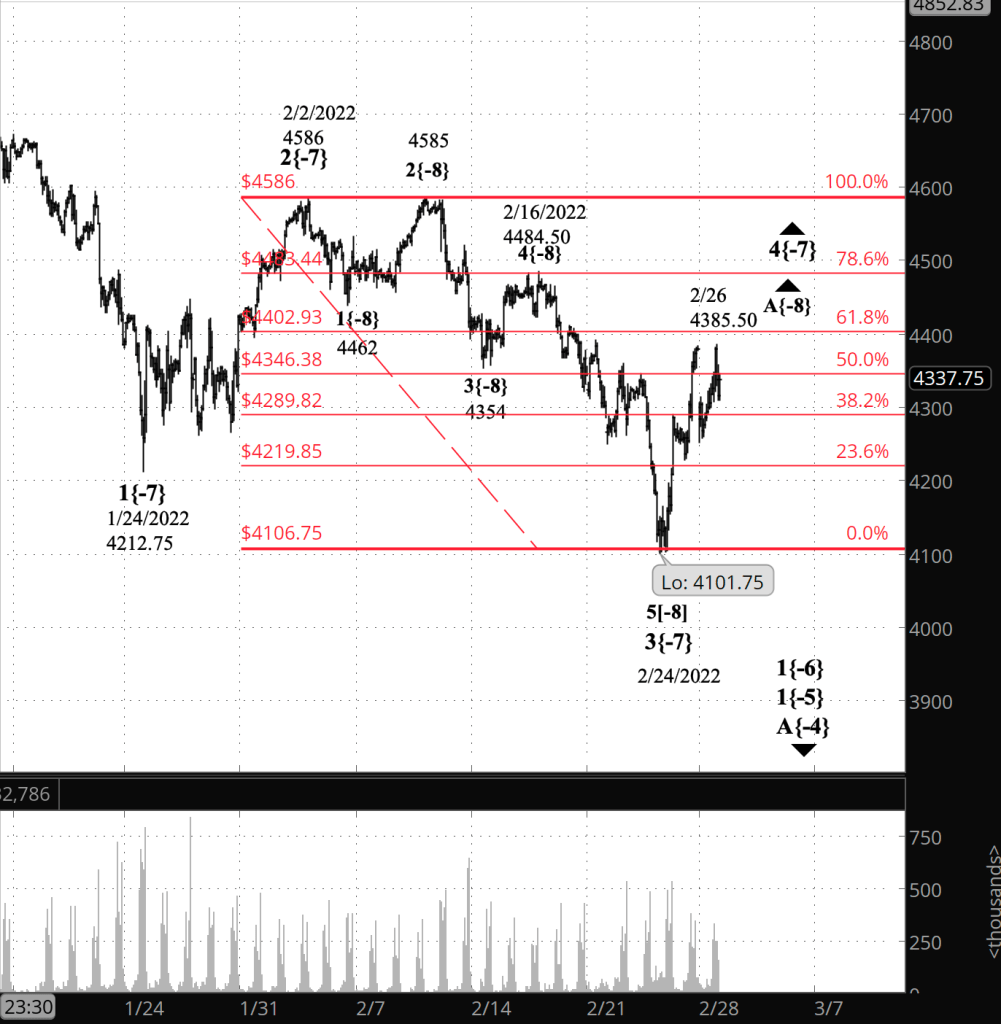
Half an hour before the closing bell. The S&P 500 futures moved 1.25 points, so far, above January 25’s high, to 4385.50, as noted in the 1:05 p.m. entry, requiring a change in the principal analysis At this point I’m sticking with the new principal analysis: The upward correction that began on February 24 is still underway and is in its first leg. Elliott terminology: Wave A{-8} within wave 4{-7} is still underway. Of this morning’s alternatives (see the What Does It Mean and What Are the Alternatives sections, below): Alternative #1 is the new principal analysis. The old principal analysis is now the new Alternative #1. And since the price has declined from today’s high, Alternative #2 is still in play.

2:25 p.m. New York time

OKE earnings play entry. I have entered a short bull put options spread on OKE and have posted an analysis of the trade.

2:10 p.m. New York time

KR earnings play entry. I’ve entered a short bull put options spread on KR and have posted an analysis of the trade.

1:05 p.m. New York time

Rise to a new high for the day. The futures price reversed and rose above the January 25 high, 4384.25, to 4385.50, so far. This knocks out my principal analysis and replaces it with Alternative #1: The first leg of the upward correction continues. In Elliott terms, wave A{-8} within wave 4{-7} is still underway. I’ve updated the chart below, moving a bit closer in for clarity.

9:35 a.m. New York time

What’s happening now? The S&P 500 E-mini futures gapped downward when trading resumed Sunday evening at 4299.50, opening 81 points below Friday’s close.

What does it mean? The first leg of the low-level upward correction that began on February 24 ended the next day just below the 61.8% Fibonacci retracement level, and the second leg, to the downside, has begun. The price will remain above the January 24 low, 4212.75.

What are the alternatives? There are two:

Alternative #1: The decline from the February 25 high could be a subwave of a continuing 1st leg of the correction.

Alternative #2: The correction could have ended at the February 25 high and the downtrend has resumed today.

[S&P 500 E-mini futures at 3:30 p.m., 90-minute bars, with volume]

What does Elliott wave theory say? Under my principal analysis, wave A{-8} within wave 4{-7}, both to the upside, peaked on Friday, and wave B{-8} to the downside has begun. Under the rules of Elliott wave analysis, a 4th wave cannot move beyond the end of the preceding wave 1. Wave 1{-7} ended at 4212.75 on January 24, and wave B{-8} will remain above that level.

Alternative #1 sees the downward gap as a subwave correction within wave A{-8}, which is still climbing. This scenario will be confirmed if the price moves above the February 25 high, 4384.25.

Alternative #2 sees wave 4{-7} as having ended at the February 25 high, the endpoint of the child wave C{-8}. The decline that began from that high is an early movement within wave 5{-7} to the downside. There are two ways to in which this scenario can be confirmed: Wave B{-8} will have three subwaves, and a wave 1{-7} will have five subwaves. Also, if the price moves below the start of wave 1{-7}, at 4212.75, then Alternative #2 is confirmed.

We Are Here.

These are the waves currently in progress under my principal analysis. Each line on the list shows the wave number, with the subscript in curly brackets, the traditional degree name, the starting date, the starting price of the S&P 500 E-mini futures, and the direction of the wave.

  • 5{0} Intermediate, 12/21/2018, 2316.75 (up)
  • 3{1} Minor, 3/23/2018 2174 (up)
  • 5{-2} Minute, 10/4/2020, 4267.50 (up)
  • 4{-3} Minuette, 1/4/2022, 4808.25 (down)
  • A{-4} Subminuette, 1/4/2022, 4808.25 (down)
  • 1{-5} Micro, 1/4/2022, 4808.25 (down)
  • 1{-6} Submicro, 1/4/2022, 4808.25 (down)
  • 4{-7} Minuscule, 2/24/2022, 4101.75 (up)
  • {B-8} Subminuscule, 2/25/2022, 4384.50 (down)

Learning and other resources. Elliott wave analysis provides context, not prophecy. As the 20th century semanticist Alfred Korzybski put it this way in his book Science and Sanity (1933), “The map is not the territory … The only usefulness of a map depends on similarity of structure between the empirical world and the map.” And I would add, in the ever-changing markets, we can judge that similarity of structure only after the fact.

See the menu page Analytical Methods for a rundown on where to go for information on Elliott wave analysis.

By Tim Bovee, Portland, Oregon, February 28, 2022

Disclaimer

Tim Bovee, Private Trader tracks the analysis and trades of a private trader for his own accounts. Nothing in this blog constitutes a recommendation to buy or sell stocks, options or any other financial instrument. The only purpose of this blog is to provide education and entertainment.

No trader is ever 100 percent successful in his or her trades. Trading in the stock and option markets is risky and uncertain. Each trader must make trading decisions for his or her own account, and take responsibility for the consequences.

License
Creative Commons License

All content on Tim Bovee, Private Trader by Timothy K. Bovee is licensed under a Creative Commons Attribution-ShareAlike 4.0 International License.

Based on a work at www.timbovee.com.
Trader’s Notebook

3:30 p.m. New york time

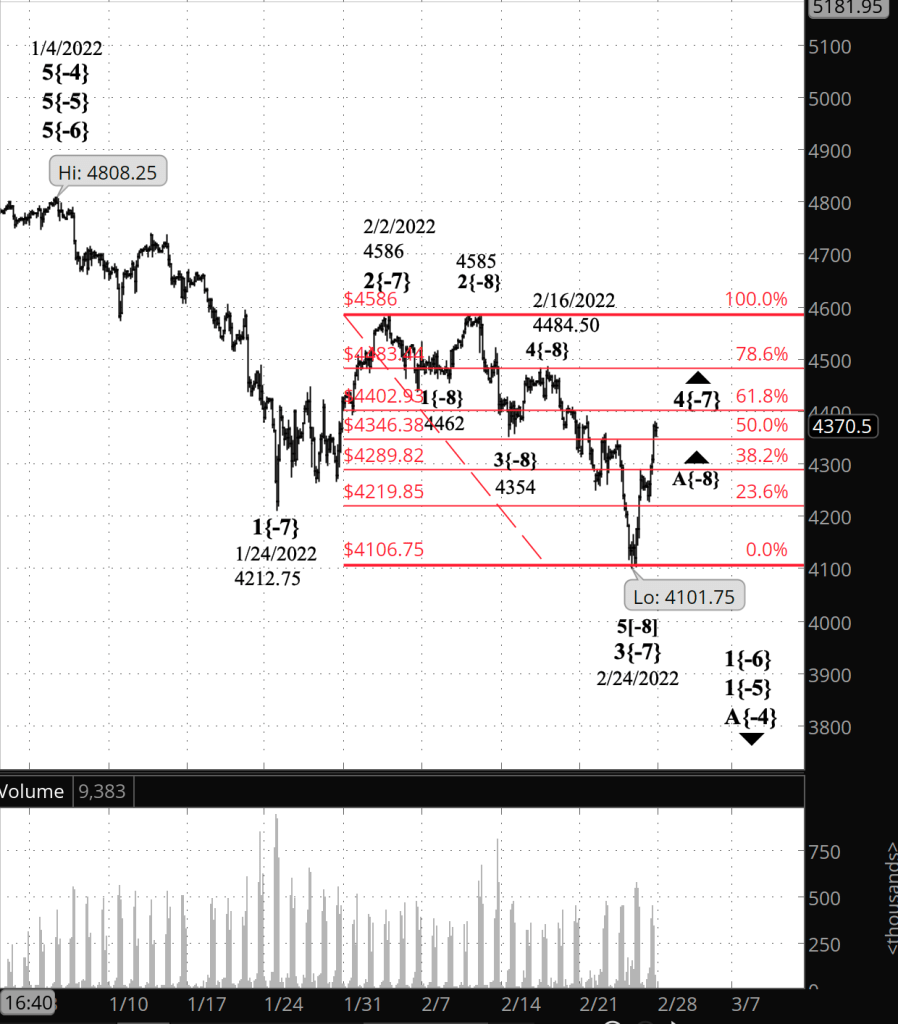
Half an hour before the closing bell. The S&P 500 futures rose during the day, pushing above the 50% retracement level. The rise puts the price within the target range for the present correction — between the 50% and the 78.6% retracement levels (4354 to 4494.50).

That target level is for the entire correction, wave 4{-7}. By this morning’s count, the entire rise has been wave A{-8}, the first leg of the parent 4th wave. The rise so far can be seen either a wave A{-8} with five subwaves, or as the entirely of wave 4{-7}, with three subwaves, one of which is a very small B wave.

The wave-A-only scenario means that correction is taking the form of a Zigzag, the same form as the previous 2nd wave correction. Normally waves 2 and 4 have different patterns, but not always. So it’s a tendency, not a rule.

The full-wave-4 scenario has a B-wave that is only 62.5 points long. Elliott wave analysis focuses on the length of wave B in relation to wave A. The A wave in this scenario is 188.25 points long. So wave B has retraced 33.2% of wave A. In Zigzags, B waves typically retrace 38% to 79% of the preceding A waves, so this B wave is coming up a bit short. In Flats, the B wave retraces 100% to 138% of wave A, and this wave B is coming in way too short.

So although those lengths are guidelines and not rules, I think it far more reasonable to treat the rise so far as wave A{-8}, with five internal waves, meaning that we’re tracing out a Zigzag correction to the upside and waves B and C lie in the future.

Bottom line: No change in the analysis. I’ve updated the chart.

11 a.m. New York time

LVS earnings play exit. I’ve exited my short bull put vertical options spread for 9.2% of maximum potential profit and have updated the trade analysis with full results.

9:37 a.m. New York time

What’s happening now? The S&P 500 E-mini futures overnight pushed above the 38.2% Fibonacci retracement level, paused (as in common at Fibonacci levels), and then rose past it.

What does it mean? The upward correction that began on February 24 continues and is in its first of three legs, the first one rising, the second one falling, and the third leg rising. The first upward leg has met the minimum requirements identified by Elliott wave analysis if the correction is a Flat pattern (three waves within the first wave), which is the most likely scenario. The second leg, also with three legs internally, could begin at any time. The entire correction, if it is typical, will end between the 50% and 78.6% retracement levels (4354 and 4494.50).

What’s the alternative? If the correction is forming a Zigzag, then the first internal wave will have five waves internally. The target range wouldn’t apply to a Zigzag. See more in the Elliott wave theory secvtion below.

[S&P 500 E-mini futures at 3:30 p.m., 140-minute bars, with volume]

What does Elliott wave theory say? The rise of February 24 is wave 4{-7} and within it, wave A{-8} is under way. Both the Flat and the Zigzag pattern have three subwaves — A, B, C — but differ in the number of waves within the subwaves.. For a Flat, the internal counts are 3-3-5, and for a Zigzag, 5-3-5. Wave 2{-7} was a Zigzag, and since 2nd and 4th waves tend to have different patterns, wave 4{-7} is likely to be a Flat. Wave A{-8} already has formed three waves internally, and so if the structure is a Flat, wave B{-8} can begin at any time.

Fourth waves have a tendency to end within the range of the 4th wave within the preceding 3rd wave — that is, between the start and end points in this case of wave 4{-9} in wave 3{-7}. That range is 4354 and 4494.50, coinciding with the 50% and 78.6% retracement levels.

We Are Here.

These are the waves currently in progress under my principal analysis. Each line on the list shows the wave number, with the subscript in curly brackets, the traditional degree name, the starting date, the starting price of the S&P 500 E-mini futures, and the direction of the wave.

  • 5{0} Intermediate, 12/21/2018, 2316.75 (up)
  • 3{1} Minor, 3/23/2018 2174 (up)
  • 5{-2} Minute, 10/4/2020, 4267.50 (up)
  • 4{-3} Minuette, 1/4/2022, 4808.25 (down)
  • A{-4} Subminuette, 1/4/2022, 4808.25 (down)
  • 1{-5} Micro, 1/4/2022, 4808.25 (down)
  • 1{-6} Submicro, 1/4/2022, 4808.25 (down)
  • 4{-7} Minuscule, 2/24/2022, 4101.75 (up)
  • A{-8} Subminuscule, 2/24/2022, 4101.75 (up)

Learning and other resources. Elliott wave analysis provides context, not prophecy. As the 20th century semanticist Alfred Korzybski put it this way in his book Science and Sanity (1933), “The map is not the territory … The only usefulness of a map depends on similarity of structure between the empirical world and the map.” And I would add, in the ever-changing markets, we can judge that similarity of structure only after the fact.

See the menu page Analytical Methods for a rundown on where to go for information on Elliott wave analysis.

By Tim Bovee, Portland, Oregon, February 25, 2022

Disclaimer

Tim Bovee, Private Trader tracks the analysis and trades of a private trader for his own accounts. Nothing in this blog constitutes a recommendation to buy or sell stocks, options or any other financial instrument. The only purpose of this blog is to provide education and entertainment.

No trader is ever 100 percent successful in his or her trades. Trading in the stock and option markets is risky and uncertain. Each trader must make trading decisions for his or her own account, and take responsibility for the consequences.

License
Creative Commons License

All content on Tim Bovee, Private Trader by Timothy K. Bovee is licensed under a Creative Commons Attribution-ShareAlike 4.0 International License.

Based on a work at www.timbovee.com.
Trader’s Notebook

9:35 a.m. New York time

What’s happening now? The S&P 500 E-mini futures traded in a narrow range overnight

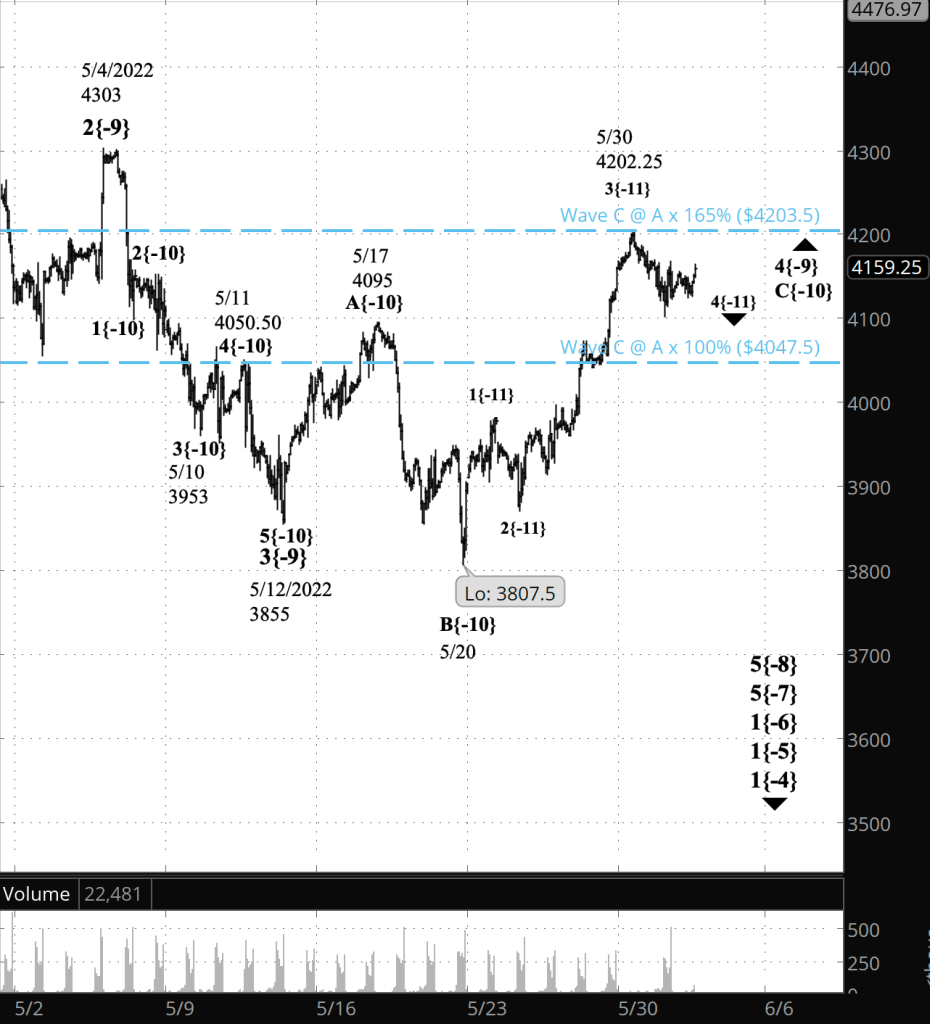
What does it mean? The third leg of an upward correction that began on May 12 continues. Internally, that third segment is in a correction to the downside.

What are the alternatives? The same three as those listed in yesterday’s Trader’s Notebook.

Alternative #1: The May 30 peak marks the end of the larger upward correction and the downtrend that began on April 21 has resumed.

Alternative #2: The final move to the upside may fall short of the May 30 peak, a condition known as truncation. Or it could move beyond the peak.

Alternative #3: Most corrections have three waves internally. Sometimes a correction will connect two or three corrective patterns together before reaching its end.

[S&P 500 E-mini futures at 9:35 a.m., 70-minute bars, with volume]

What does Elliott wave theory say? The larger upward correction is wave 4{-9}. It is in its third internal movement, wave C{-10}. The C wave in turn is undergoing a downward correction, wave 4{-11}, whose completion will be followed by a rise that will complete wave C{-10} and most likely wave 4{-9} as well.

The likely target range for completion of wave 4{-9} is marked with blue dashed lines on the chart. The upper boundary of the range is at 4203.50. That range is a tendency, not a firm rule, and so the price could move higher. However, it cannot move above the beginning of wave 1{-9}, at 4509.

Under Alternative #1, wave C{-10} ended at the May 30 peak.

Under Alternative #2, the upward wave 5{-11} that will follow the present wave 4{-11} pullback will fall short of 4303, the May 30 peak, in a truncated 5th.

Under Alternative #3, the end of wave C{-10} won’t be the end of its parent, wave 4{-9}. Instead, wave C{-10} will be followed by a downward connecting wave, X{-10} and then a second corrective pattern, which possibly will be followed by another connecting wave and then third corrective pattern.

We Are Here.

These are the waves currently in progress under my principal analysis. Each line on the list shows the wave number, with the subscript in curly brackets, the traditional degree name, the starting date, the starting price of the S&P 500 E-mini futures, and the direction of the wave.

  • S&P 500 Index:
  • 5{+3} Supercycle, 7/8/1932, 4.40 (up)
  • 5{+2} Cycle, 12/9/1974, 60.96 (up)
  • 5{+1} Primary, 3/6/2009, 666.79 (up)
  • 5{0} Intermediate, 12/26/2018, 2346.58 (up)
  • 4{-1} Minor, 1/4/2022 4818.62 (down)
  • 1{-2} Minute, 1/4/2022 4818.62 (down)
  • S&P 500 Futures and index:
  • 1{-3} Minuette, 1/4/2022, 4808.25 (down) (futures), 4818.62 (down) (index)
  • S&P 500 Futures:
  • 1{-4} Subminuette, 1/4/2022, 4808.25 (down)
  • 1{-5} Micro, 1/4/2022, 4808.25 (down)
  • 1{-6} Submicro, 1/4/2022, 4808.25 (down)
  • 5{-7} Minuscule, 3/29/2022, 4631 (down)
  • 5{-8} Subminuscule, 4/21/2022, 4509, (down)

Learning and other resources. Elliott wave analysis provides context, not prophecy. As the 20th century semanticist Alfred Korzybski put it in his book Science and Sanity (1933), “The map is not the territory … The only usefulness of a map depends on similarity of structure between the empirical world and the map.” And I would add, in the ever-changing markets, we can judge that similarity of structure only after the fact.

See the menu page Analytical Methods for a rundown on where to go for information on Elliott wave analysis.

By Tim Bovee, Portland, Oregon, June 1, 2022

Disclaimer

Tim Bovee, Private Trader tracks the analysis and trades of a private trader for his own accounts. Nothing in this blog constitutes a recommendation to buy or sell stocks, options or any other financial instrument. The only purpose of this blog is to provide education and entertainment.

No trader is ever 100 percent successful in his or her trades. Trading in the stock and option markets is risky and uncertain. Each trader must make trading decisions for his or her own account, and take responsibility for the consequences.

License
Creative Commons License

All content on Tim Bovee, Private Trader by Timothy K. Bovee is licensed under a Creative Commons Attribution-ShareAlike 4.0 International License.

Based on a work at www.timbovee.com.

Trader’s Notebook

3:30 p.m. New York time

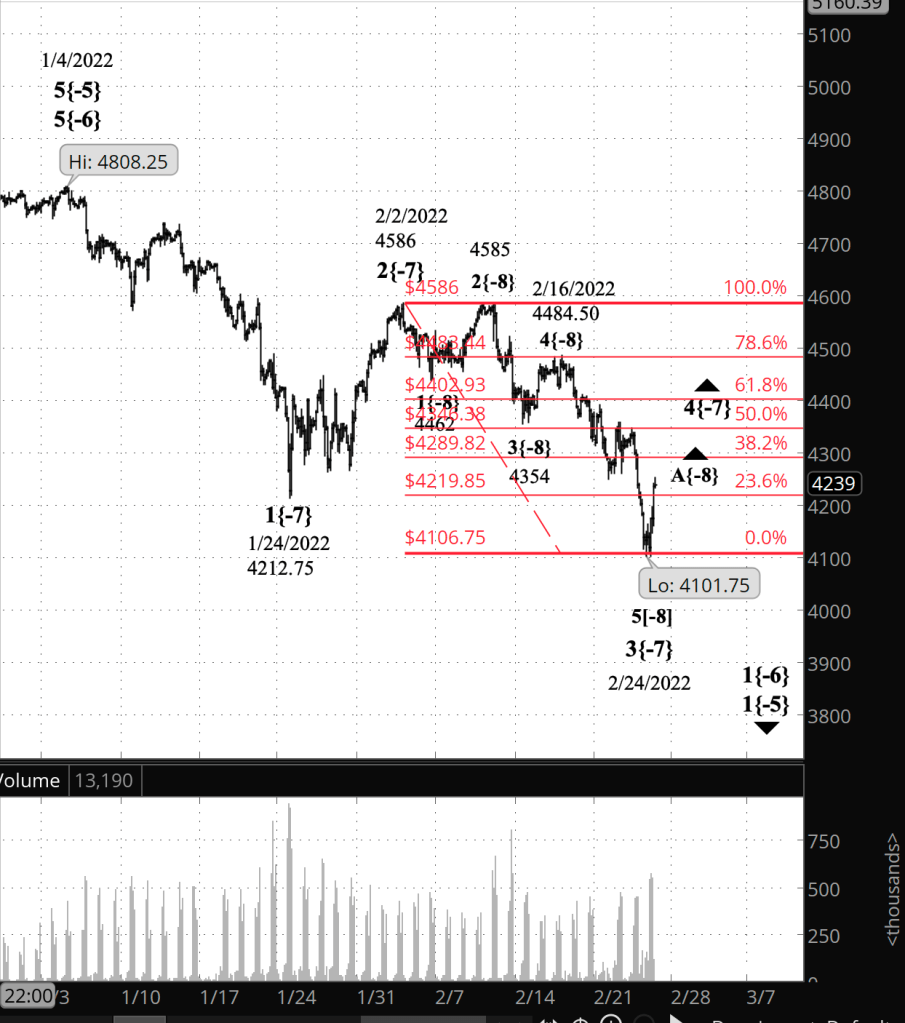
Half an hour before the closing bell. The overnight low, 4101.75, has ended the downtrend that began on February 2. After the the opening bell the price has risen so far to 4252.25 in what is the first leg of what will most likely be a three-part upward correction. I expect to it to take the form of a Flat, a sideways corrective pattern. So far it has moved above a 23.6% retracement of the decline. The 23.6% retracement is part of the Fibonacci series, and quite often prices will pause at Fibonacci levels. The next one higher is the 38.2% retracement, at 4289.82.

In Elliott wave terminology: Wave 5{-8} and its parent wave 3{-7} ended at 4101.75, the overnight low, and the subsequent upward movement is wave A{-8} within wave 4{-7}, a correction to the decline.

Fourth waves often end within the range of the the 4th wave one degree smaller within the preceding 3rd wave. In this case it would be wave 4{-8} within wave 3{-7}; the 4th subwave started at 4354 and ended on February 16 at 4484.50. Those start and end points are my expectation for the range within which wave 4{-7} will end, roughly a 50% to a 78.6% retracement.

The upward correction, wave 4{-7}, will contain three subwaves (unless it extends into a compound correction) — A, B and C, all at the {-8} degree — and will be followed by a declining wave 5{-7}, which will carry the price below the 4101.75, perhaps significantly lower.

2:40 p.m. New York time

LYFT earnings play exit. I’ve exited my short bear call vertical spread on LYFT for 70% of maximum potential profit and have updated the trade analysis with full results.

10:20 a.m. New York time

SPY options position exit. I’ve exited my short bear call vertical spread on SPY for 51% of maximum potential profit and have updated the trade analysis with full results.

10:05 a.m. New York time

DIS earnings play exit. I’ve exited my short bull put vertical spread on DIS for 29.4% of maximum potential profit and have updated the trade analysis with full results.

9:35 a.m. New York time

What’s happening now? The S&P 500 E-mini futures continued to decline in overnight trading, reaching a low of 4101.75 so far, the lowest it has been this year.

What does it mean? The downtrend that began on January 4 from 4808.75 and that, after an upward correction, resumed on February 2 continues. So far it has fallen more than 700 points below the January 4 peak, with more downside to come, with the usual corrections along the way that will interrupt its progress.

What’s the alternative? At this point I have none. The chart patterns have a high degree of clarity. As always, ambiguities will arise, but not today.

[S&P 500 E-mini futures at 3:30 p.m., 140-minute bars, with volume]

What does Elliott wave theory say? Wave 5{-8} is underway, tracing its course within wave 3{-7} within wave 1{-6}, all declining in the direction of the downtrend that began on January 4.

In Elliott, the term for a wave moving in the direction the trend is an impulse wave. Within wave 3{-7}, the 5th wave, the ending wave within an impulse wave, is the longest of the three. Normally, the 3rd (middle) wave is the longest. The Elliott wave analysis rule is only that the 3rd wave can’t be the shortest of the three waves moving in the direction of the trend, the 1st, 3rd and 5th.

Wave 1{-8} is the shortest of three, at 124 points; wave 3{-8} is next, at 231 points; and wave 5{-8} is the longest, at 382.75 points. So the Elliott wave rule is satisfied.

There is no rule limiting on how far a 5th wave can travel, although a grotesquely outsized 5th wave should prompt the analyst to re-evaluate the work.

I’ve seen headlines this morning linking the market decline to the Russian attack on the Ukraine. A principle of Elliott wave theory is that market movements, the waves, are driven by the public mood, what German philosophrs called the Zeitgeist. The public mood anticipates events, and so the market weeks ago priced in the war in Ukraine. The movements we see today will be anticipations of what happens next, not responses to what happened earlier today Ukraine time.

We Are Here.

These are the waves currently in progress under my principal analysis. Each line on the list shows the wave number, with the subscript in curly brackets, the traditional degree name, the starting date, the starting price of the S&P 500 E-mini futures, and the direction of the wave.

  • 5{0} Intermediate, 12/21/2018, 2316.75 (up)
  • 3{1} Minor, 3/23/2018 2174 (up)
  • 5{-2} Minute, 10/4/2020, 4267.50 (up)
  • 4{-3} Minuette, 1/4/2022, 4808.25 (down)
  • A{-4} Subminuette, 1/4/2022, 4808.25 (down)
  • 1{-5} Micro, 1/4/2022, 4808.25 (down)
  • 1{-6} Submicro, 1/4/2022, 4808.25 (down)
  • 4{-7} Minuscule, 2/24/2022, 4101.75 (up)
  • A{-8} Subminuscule, 2/24/2022, 4101.75 (up)

Learning and other resources. Elliott wave analysis provides context, not prophecy. As the 20th century semanticist Alfred Korzybski put it this way in his book Science and Sanity (1933), “The map is not the territory … The only usefulness of a map depends on similarity of structure between the empirical world and the map.” And I would add, in the ever-changing markets, we can judge that similarity of structure only after the fact.

See the menu page Analytical Methods for a rundown on where to go for information on Elliott wave analysis.

By Tim Bovee, Portland, Oregon, February 24, 2022

Disclaimer

Tim Bovee, Private Trader tracks the analysis and trades of a private trader for his own accounts. Nothing in this blog constitutes a recommendation to buy or sell stocks, options or any other financial instrument. The only purpose of this blog is to provide education and entertainment.

No trader is ever 100 percent successful in his or her trades. Trading in the stock and option markets is risky and uncertain. Each trader must make trading decisions for his or her own account, and take responsibility for the consequences.

License
Creative Commons License

All content on Tim Bovee, Private Trader by Timothy K. Bovee is licensed under a Creative Commons Attribution-ShareAlike 4.0 International License.

Based on a work at www.timbovee.com.

NEM Trade

Newmont Corp. (NEM)

Update 3/3/2022: I exited my bull put vertical options spread on NEM, 42 days before expiration, for a $1.38 debit per contract/share, a profit before fees of $54 per contract. Shares were trading at $70.48, up $2.08 from the entry level.

The Implied Volatility Rank at exit was 75, up 6.6 points from the entry level.

I exited because the position exceeded 25% of maximum potential profit, my normal exit point for earnings plays.I exited at 28.1% of maximum potential profit.

Shares rose by 3.0% over eight days for a +139% annual rate. The options position produced a 39.1% return for a +1,785% annual rate.


I have entered a short bull put options spread on NEM, using options that trade for the last time 50 days hence, on April 14. The premium is a $1.92 credit per contract share and the stock at the time of entry was priced at $68.40.

The Implied Volatility Ratio stood at 72.3%.

Premium:$1.92Expire OTM
NEM-bull put spreadStrikeOddsDelta
Puts
Long62.5071.0%24
Break-even69.4260.0%34
Short67.5049.0%44

The premium is 76.8% of the width of the position’s short/long spread. The profit zone covers a 1.5% move to the downside and an unlimited move to the upside.

The risk/reward ratio is 1.6:1, with maximum risk of $308 and maximum reward of $192 per contract.

How I chose the trade. The trade was placed to coincide with NEM’s earnings announcement, before the opening bell on the day after entry. The short strikes were set to coincide as closely as possible with the expected move of $1.94 either way, based on options pricing, which gives a price range of $66.39 to $70.27.

By Tim Bovee, Portland, Oregon, February 23, 2022

Disclaimer

Tim Bovee, Private Trader tracks the analysis and trades of a private trader for his own accounts. Nothing in this blog constitutes a recommendation to buy or sell stocks, options or any other financial instrument. The only purpose of this blog is to provide education and entertainment.

No trader is ever 100 percent successful in his or her trades. Trading in the stock and option markets is risky and uncertain. Each trader must make trading decisions for his or her own account, and take responsibility for the consequences.

License
Creative Commons License

All content on Tim Bovee, Private Trader by Timothy K. Bovee is licensed under a Creative Commons Attribution-ShareAlike 4.0 International License.

Based on a work at www.timbovee.com.

Trader’s Notebook

3:30 p.m. New York time

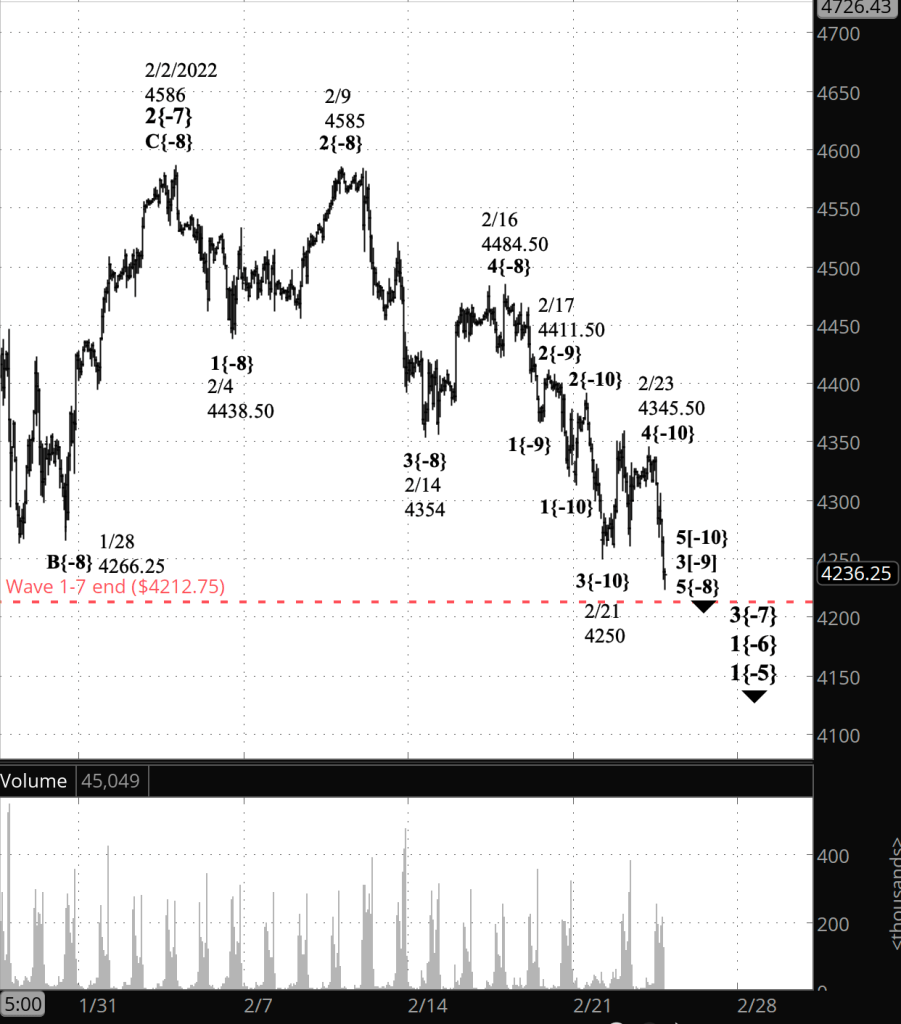
Half an hour before the closing bell. The S&P 500 futures ended their low level upward correction at the overnight high, 4345.50, and began a resumption of the downtrend that picked up speed at the opening bell. The overnight high was the end of wave 4{-9}, and the decline, the beginning of wave 5{-9}. The first decline from the January 4 peak, wave 1{-7}, ended at 4212.75 on January 24, and as the closing bell drew near, the price was again approaching that level, which I’ve marked with a dotted red line on the updated chart below.

Wave 5{-9} is a subwave of wave 5{-8}, which in turn is a subwave of wave 3{-7}. Third waves tend to have a lot of energy as they leap out in the direction of the trend, and that’s what we’re seeing here. Wave 1{-7} lasted for 20 days, and the present movement at that degree, wave 3{-7}, has lasted 21 days. Third waves tend to cover more terrain than first waves, so I expect wave 3{-7} to be with us for weeks to come, with the usual subwave upward corrections to make the journey interesting.

1:25 p.m. New York time

NEM earnings play entry. I’ve entered a short bull put vertical spread on NEM timed to coincide with the company’s earnings announcement tomorrow before the opening bell. I’ve posted an analysis of the trade.

9:35 a.m. New York time

What’s happening now? Overnight, the S&P 500 E-mini futures continued to trade 80 points and bit more above the February 21 low of 4250.

What does it mean? A low level upward correction that began two days ago is under way. It will be followed by a decline, most likely to below 4250, perhaps significantly lower.

What’s the alternative? The uncertainty about the degrees of the waves labelled on the chart continue, as is always the case early in trend. The relative degree among the various waves shown is quite clear, so yes, there are ambiguities, but they aren’t of great significance at this point.

[S&P 500 E-mini futures at 9:35 a.m., hourly bars, with volume]

What does Elliott wave theory say? I moved the chart closer in today in order to gain a better understanding of the progress of wave 3{-7}, which began on February 7 from 4586. Internally, wave 5{-8}, the final wave within 3{-7}, began on February 16 from 4484.50. One degree lower, wave 3{-9} is underway, having begun on February 17 from 4411.50, and within it, an upward correction, wave 4{-10}, began on February 21 from 4250 and would appear to be in wave C{-11}, its final wave unless it becomes a compound correction.

The odds favor the downside at this point. When wave 4{-10} reaches its end, then wave 5{-10} will carry the price down. Fifth waves can move quite a distance below the end of the preceding 3rd wave, or they can truncate and never reach that level.

What is certain is that completion of wave 5{-10} will also be the end of its parent, wave 3{-9}, and the beginning of wave 4{-9}, most likely a Flat, which tends to be a sideways correction. The following wave 5{-9} will carry the price down still further, and the end of 5{-9} will also be the end of 5{-8}, which in turn will be the end of wave 3{-7}, which will be followed by a 4th wave correction that is most likely to be a Flat. So once our present wave 4{-10} ends, everything is a downtrend within the larger downtrend, and at the end, it hits what will most likely be a sideways correction, after which the downtrend will resume. The next directional upward movement will be wave 2{-6}, a correction of the decline that began on January 4 from 4808.25. It will remain below that level and will be followed by a truly impressive wave 3{-6} to the downside.

We Are Here.

These are the waves currently in progress under my principal analysis. Each line on the list shows the wave number, with the subscript in curly brackets, the traditional degree name, the starting date, the starting price of the S&P 500 E-mini futures, and the direction of the wave.

  • 5{0} Intermediate, 12/21/2018, 2316.75 (up)
  • 3{1} Minor, 3/23/2018 2174 (up)
  • 5{-2} Minute, 10/4/2020, 4267.50 (up)
  • 4{-3} Minuette, 1/4/2022, 4808.25 (down)
  • A{-4} Subminuette, 1/4/2022, 4808.25 (down)
  • 1{-5} Micro, 1/4/2022, 4808.25 (down)
  • 1{-6} Submicro, 1/4/2022, 4808.25 (down)
  • 3{-7} Minuscule, 2/2/2022, 4586 (down)
  • 5{-8} Subminuscule, 2/16/2022, 4484.50 (down)
  • 3{-9} Bitsy, 2/17/2022, 4411.50(down)
  • 4{-10} Subbitsy, 2/21/2022, 4250 (up)

Learning and other resources. Elliott wave analysis provides context, not prophecy. As the 20th century semanticist Alfred Korzybski put it this way in his book Science and Sanity (1933), “The map is not the territory … The only usefulness of a map depends on similarity of structure between the empirical world and the map.” And I would add, in the ever-changing markets, we can judge that similarity of structure only after the fact.

See the menu page Analytical Methods for a rundown on where to go for information on Elliott wave analysis.

By Tim Bovee, Portland, Oregon, February 23, 2022

Disclaimer

Tim Bovee, Private Trader tracks the analysis and trades of a private trader for his own accounts. Nothing in this blog constitutes a recommendation to buy or sell stocks, options or any other financial instrument. The only purpose of this blog is to provide education and entertainment.

No trader is ever 100 percent successful in his or her trades. Trading in the stock and option markets is risky and uncertain. Each trader must make trading decisions for his or her own account, and take responsibility for the consequences.

License
Creative Commons License

All content on Tim Bovee, Private Trader by Timothy K. Bovee is licensed under a Creative Commons Attribution-ShareAlike 4.0 International License.

Based on a work at www.timbovee.com.

SPY Trade

S&P 500 ETF Trust (SPY)

Lot 2022-3

Update 2/24/2022: I exited my bear call vertical options spread on SPY, 49 days before expiration, for a $2.06 debit per contract/share, a profit before fees of $214.00 per contract. Shares were trading at $412.53, down $17.21 from the entry level.

The Implied Volatility Rank at exit was 82.7%, up 18.9 points from the entry level.

I exited because the position reached 51% of maximum potential profit, one point above my normal 50% exit point for options positions.

Shares declined by 4.0% over two days for a -731% annual rate. The options position produced a 103.9% return for a +18,959% annual rate.


I have entered a short bear call options spread on SPY, using options that trade for the last time 51 days hence, on April 14. The premium is a $4.20 credit per contract share and the stock at the time of entry was priced at $429.74.

The Implied Volatility Ratio stood at 63.8%.

Premium:$4.20Expire OTM
SPY-bear call spreadStrikeOddsDelta
Calls
Long450.0076.0%27
Break-even444.2070.0%33.5
Short440.0064.0%40

The premium is 84% of the width of the position’s short/long spread. The profit zone covers a 3.4% move to the upside and an unlimited move to the downside.

The risk/reward ratio is 1.4:1, with maximum risk of $580 and maximum reward of $420 per contract.

How I chose the trade. The trade was placed to coincide with Elliott wave analysis of the S&P 500, which brings an expectation that the downtrend that began on January 4 has resumed.

By Tim Bovee, Portland, Oregon, February 22, 2022

Disclaimer

Tim Bovee, Private Trader tracks the analysis and trades of a private trader for his own accounts. Nothing in this blog constitutes a recommendation to buy or sell stocks, options or any other financial instrument. The only purpose of this blog is to provide education and entertainment.

No trader is ever 100 percent successful in his or her trades. Trading in the stock and option markets is risky and uncertain. Each trader must make trading decisions for his or her own account, and take responsibility for the consequences.

License
Creative Commons License

All content on Tim Bovee, Private Trader by Timothy K. Bovee is licensed under a Creative Commons Attribution-ShareAlike 4.0 International License.

Based on a work at www.timbovee.com.