Trader’s Notebook

3:30 p.m. New York time

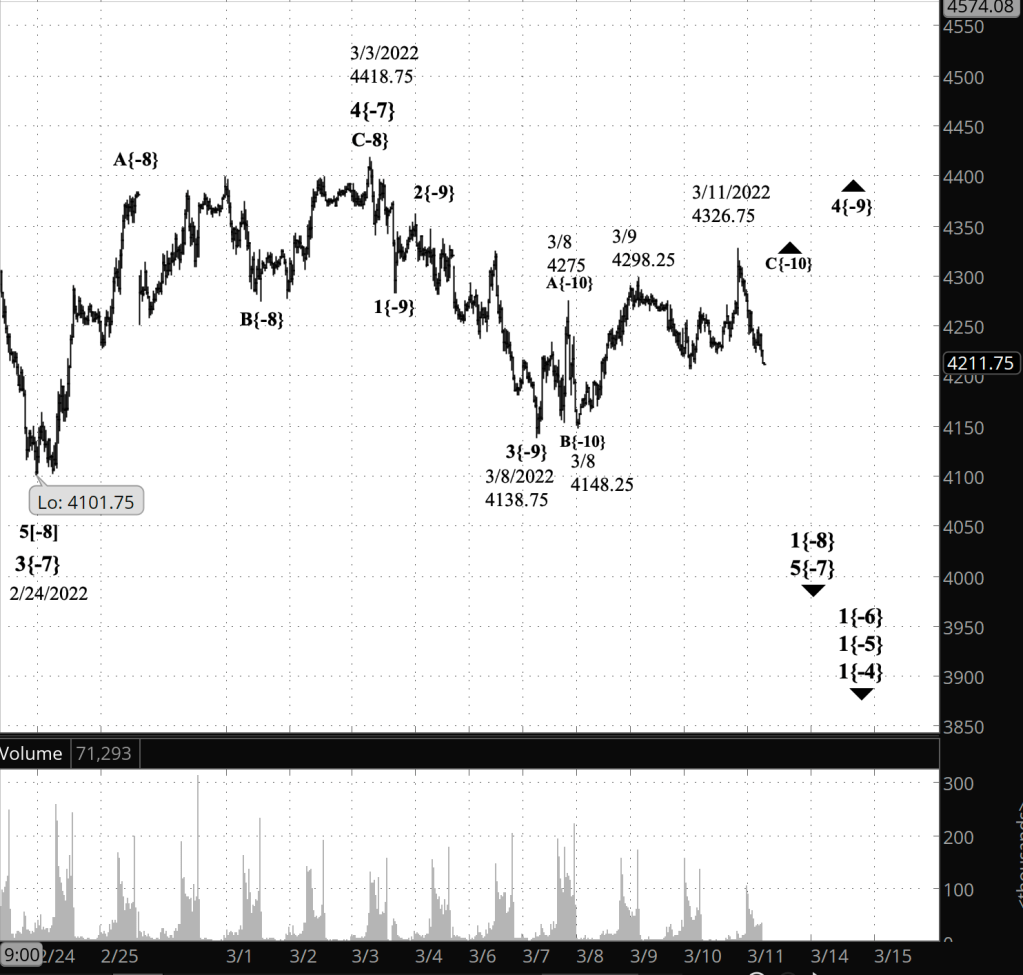
Half an hour before the closing bell. The S&P futures have continued to fall during the session, reaching below 4215. The present wave C{-10} has so far remained well above its starting point, 4148.25. Wave 4{-9}, the upward correction that began on March 8, continues, although the alternative, that wave 4{-9} ended at the overnight high, 4326.75, remains a strong possibility. I’ve updated the upper chart.

10:50 a.m. New York time

PFE earnings play exit. I have exited my short bull put options spread on PFE for 25% of maximum potential profit and have updated the trade analysis with full results.

9:35 a.m. New York time

What’s happening now? The S&P 500 E-mini futures in overnight trading moved to a new high within the upward correction that began on March 8, reaching 4326.75 so far.

What does it mean? By my principal analysis (yesterday’s alternative analysis), the third leg within the upward correction is still underway.

What are the alternatives? It’s possible that the overnight high marks the end of the correction, and the subsequent, still small downward movement that followed is a resumption of the downtrend that began on March 3.

It’s also possible that the upward correction ended on March 9 and that the resumed downtrend is forming a Diagonal Triangle.

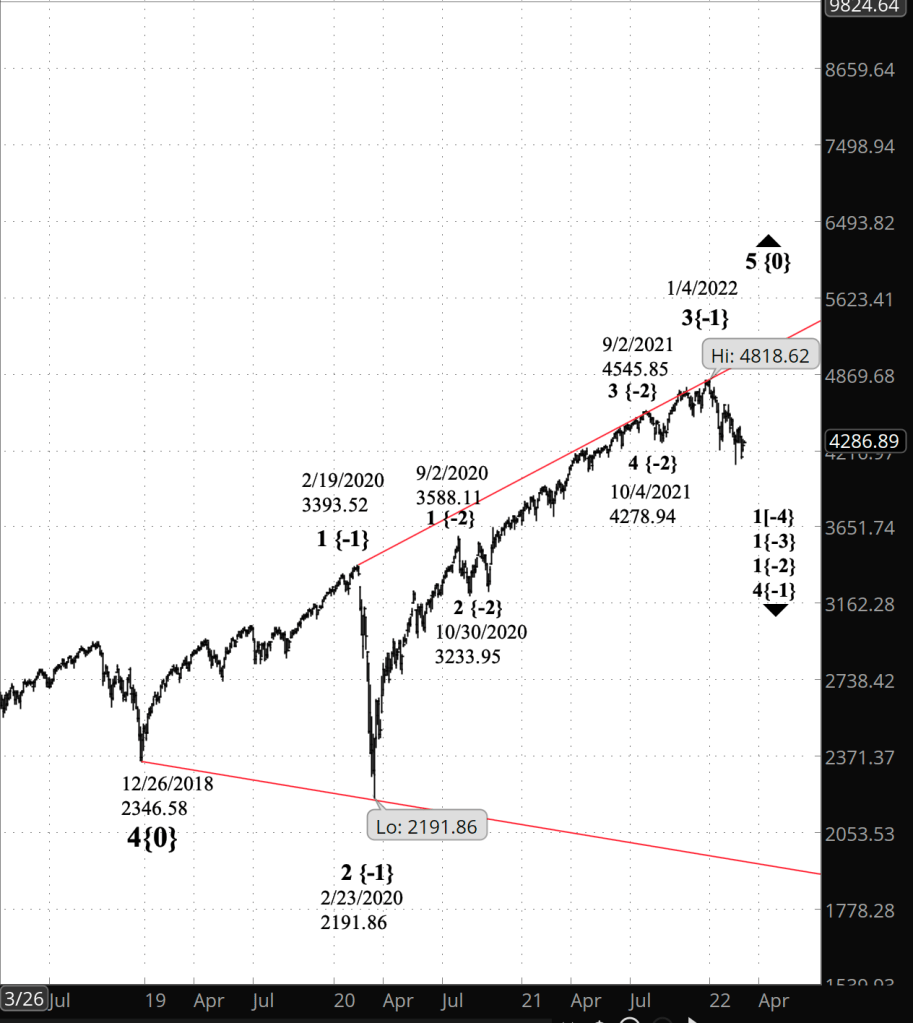
Charts. I’m discussing two charts today in the Elliott wave theory section. The upper chart is near-term look at the S&P 500 E-mini futures, stretching back to late February. The lower chart is a big-picture look at the S&P 500 index from December 2018 to the present.
[S&P 500 E-mini futures at 3:30 p.m., 30-minute bars, with volume]
[S&P 500 index at 9:33 a.m., 2-day bars]

What does Elliott wave theory say? I’ll discuss the near-term chart of the S&P 500 futures first.

Under my principal analysis, the wave 4{-9} upward correction is continuing, and internally is in wave C{-10} to the upside. This was presented as an alternative in yesterday’s post, and as it turns out, the alternative was correct, because of the price moving above the March 9 high, a level that my principal analysis had labeled as the end of wave 4{-9}.

There are several possibilities that could occur after the end of C{-10}, the 3rd wave of the correction.

One would be that wave 4{-9} turns out to be a simple three-wave correction, and the end of C{-10} is also the end of 4{-9} and the start of a wave 5{-9} resumption of the downtrend. I consider this to be the most likely outcome.

Or the correction could form a compound structure, connecting two or three corrective patterns together. If that occurs, then upward wave C{-10} will be followed by a downward connector wave X{-10} and then another three-wave corrective pattern within wave 4{-9}, beginning with a rising wave A{-10}.

And it’s possible, although not likely in my opinion, that yesterday’s principal analysis was correct: Wave 4{-9} ended on March 9 at 4298.25 and the subsequent decline and rise are the first steps of a five-wave Diagonal Triangle within downtrending wave 5{-9}.

Turning now to the big-picture chart of the S&P 500 index.

All of the near-term action discussed above is occurring within the downtrending 4th wave of an expanding Diagonal Triangle that began on December 26, 2018. The “expanding” part of the name means that the upper and lower boundaries progressively move further from each other. When complete the Triangle will have five waves internally. The 4th wave decline will carry the price into the region of the lower boundary, and then a 5th wave rise will move the price back to the by then higher upper boundary to complete the Triangle.

The Diagonal Triangle is uptrending wave 5{0}, which began on December 26, 2018 from 2346.58. Within it, wave 1{-1} ended at 3393.32 in February 2020, the subsequent wave 2{-1} decline — the early pandemic crash — ended at 2191.86 on February 23, 2020. Wave 3{-1}, the massive rise that we’ve seen since the crash, ended at 4818.62 on January 4, 2022. And in our present decline we see the early stages of wave 4{-1}, which eventually will carry the price down to the lower boundary, which is presently in the mid-1900s and moving lower each day. Wave 5{-1} will follow, rising back to the upper boundary, which is presently in the upper 4900s and by the time wave 5{-1} returns could well be in the 6000s.

Basically, wave 4{-1} will feel like the end of the world as we know it, and wave 5{-1} will at the peak will see people dancing in the street, certain that the uptrend will continue forever. Which it won’t. The end of wave 5{-1} will also be the end of wave 5{0}, and the subsequent long-term decline will be a life-altering event for the generations of people impoverished by it, a cautionary tale to tell the grandchildren who in turn will tell their grandchildren about those dark days, the Crash of 20??.

We Are Here.

These are the waves currently in progress under my principal analysis. Each line on the list shows the wave number, with the subscript in curly brackets, the traditional degree name, the starting date, the starting price of the S&P 500 E-mini futures, and the direction of the wave.

  • Index:
  • 5{0} Intermediate, 12/26/2018, 2346.58 (up)
  • 4{-1} Minor, 1/4/2022 4818.62 (down)
  • 1{-2} Minute, 1/4/2022 4818.62 (down)
  • Futures and index:
  • 1{-3} Minuette, 1/4/2022, 4808.25 (down) (futures), 4818.62 (down) (index)
  • Futures:
  • 1{-4} Subminuette, 1/4/2022, 4808.25 (down)
  • 1{-5} Micro, 1/4/2022, 4808.25 (down)
  • 1{-6} Submicro, 1/4/2022, 4808.25 (down)
  • 5{-7} Minuscule, 3/3/2022, 4101.75 (down)
  • 1{-8} Subminuscule, 3/3/2022, 4101.75 (down)
  • 4{-9} Bitsy, 3/8/2022, 4138.75 (up)
  • C{-10} Subbitsy, 3/8/2022, 4148.25 (up)

Learning and other resources. Elliott wave analysis provides context, not prophecy. As the 20th century semanticist Alfred Korzybski put it in his book Science and Sanity (1933), “The map is not the territory … The only usefulness of a map depends on similarity of structure between the empirical world and the map.” And I would add, in the ever-changing markets, we can judge that similarity of structure only after the fact.

See the menu page Analytical Methods for a rundown on where to go for information on Elliott wave analysis.

By Tim Bovee, Portland, Oregon, March 11, 2022

Disclaimer

Tim Bovee, Private Trader tracks the analysis and trades of a private trader for his own accounts. Nothing in this blog constitutes a recommendation to buy or sell stocks, options or any other financial instrument. The only purpose of this blog is to provide education and entertainment.

No trader is ever 100 percent successful in his or her trades. Trading in the stock and option markets is risky and uncertain. Each trader must make trading decisions for his or her own account, and take responsibility for the consequences.

License
Creative Commons License

All content on Tim Bovee, Private Trader by Timothy K. Bovee is licensed under a Creative Commons Attribution-ShareAlike 4.0 International License.

Based on a work at www.timbovee.com.
Trader’s Notebook

3:30 p.m. New York time

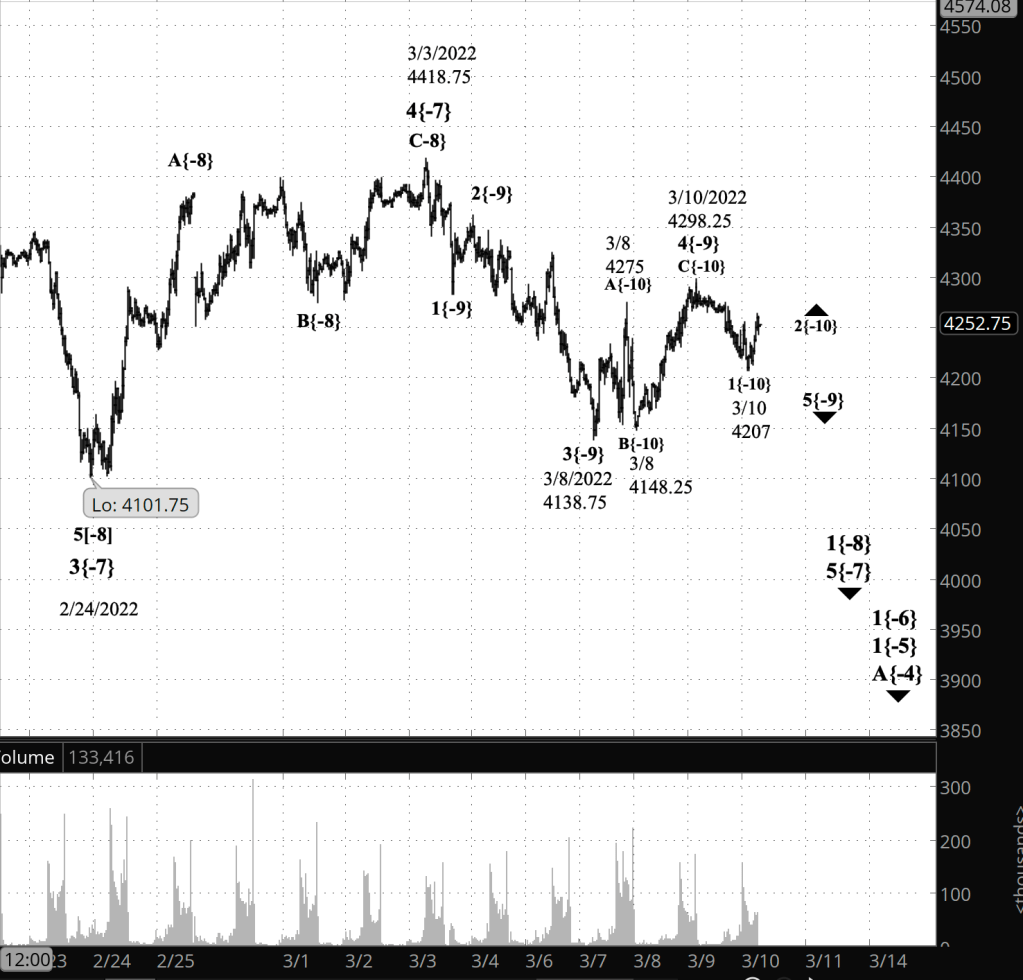
Half an hour before the closing bell. The S&P 500 futures fell to 4207 during the first two hours of the session, and then reversed to the upside. By my principal count, the decline was wave 1{-10} within downtrending wave 5{-9}. The rise that followed is wave 2{-10}. Second waves tend to take a Zigzag pattern, which means three subwaves labeled A, B and C. The A wave has five subwaves within it; the B, three; and the C, five.

The 2nd wave never moves beyond the start of the preceding 1st wave, so if events match my analysis, the price will remain at or below 4298.25. If it moves above that level, then my alternative analysis from this morning is correct: Wave 5{-9} hasn’t begun, but instead the upward correction, wave 4{-9}, is still underway.

I’ve updated the chart, below.

9:35 a.m. New York time

What’s happening now? The S&P 500 E-mini futures reached a high of 4298.25 in overnight trading and reversed.

What does it mean? Under my principal analysis, the downtrend that began on March 3 has resumed.

What’s the alternative? The decline that began overnight is the second wave within the final, upward movement of the correction that began on March 8.

[S&P 500 E-mini futures at 3:30 p.m., 30-minute bars, with volume]

What does Elliott wave theory say? Under my principal analysis, wave C{-10} and its parent wave 4{-9} ended overnight at 4298.25. For wave C, it was a 110% retracement of the preceding wave A. The correction pattern is a Flat, and in Flats, C waves retrace from 100% to 160% of the preceding A waves. The decline, wave 5{-9}, will fall below the end of wave 3{-9}, at 4138.75 on March 8, and perhaps significantly so.

Under the alternative analysis, the overnight peak ended the first of five waves within wave C{-10} and the subsequent decline is wave 2{-11}. The price won’t move below 4148.25, the start of the preceding 1st wave.

In Elliott wave theory, waves of the same degree tend to be proportional. It’s not a firm rule — I’ve seen disproportional waves many times, especially 4th and 5th waves. But the tendency is that waves in a set will take roughly the same amount of time to complete their work. Within wave 4{-9} each subwave has lasted about a day. The principal analysis keeps that proportionality intact. The alternative analysis would make wave C significantly longer than the other two waves within wave 4{-9}.

The principal analysis will be confirmed if the price moves below 4138.75, the end of wave 3{-9}.

The alternative analysis will be tentatively confirmed if the price reverses upward significantly while above 4138.75 and entirely confirmed if it moves above 4298.25, the end of wave B{-10} within wave 4{-9}.

We Are Here.

These are the waves currently in progress under my principal analysis. Each line on the list shows the wave number, with the subscript in curly brackets, the traditional degree name, the starting date, the starting price of the S&P 500 E-mini futures, and the direction of the wave.

  • 5{0} Intermediate, 12/21/2018, 2316.75 (up)
  • 3{1} Minor, 3/23/2018 2174 (up)
  • 5{-2} Minute, 10/4/2020, 4267.50 (up)
  • 4{-3} Minuette, 1/4/2022, 4808.25 (down)
  • A{-4} Subminuette, 1/4/2022, 4808.25 (down)
  • 1{-5} Micro, 1/4/2022, 4808.25 (down)
  • 1{-6} Submicro, 1/4/2022, 4808.25 (down)
  • 5{-7} Minuscule, 3/3/2022, 4101.75 (down)
  • 1{-8} Subminuscule, 3/3/2022, 4101.75 (down)
  • 5{-9} Bitsy, 3/10/2022, 4298.25 (down)
  • 2{-10} Subbitsy, 3/10/2022, 4207 (up)

Learning and other resources. Elliott wave analysis provides context, not prophecy. As the 20th century semanticist Alfred Korzybski put it in his book Science and Sanity (1933), “The map is not the territory … The only usefulness of a map depends on similarity of structure between the empirical world and the map.” And I would add, in the ever-changing markets, we can judge that similarity of structure only after the fact.

See the menu page Analytical Methods for a rundown on where to go for information on Elliott wave analysis.

By Tim Bovee, Portland, Oregon, March 10, 2022

Disclaimer

Tim Bovee, Private Trader tracks the analysis and trades of a private trader for his own accounts. Nothing in this blog constitutes a recommendation to buy or sell stocks, options or any other financial instrument. The only purpose of this blog is to provide education and entertainment.

No trader is ever 100 percent successful in his or her trades. Trading in the stock and option markets is risky and uncertain. Each trader must make trading decisions for his or her own account, and take responsibility for the consequences.

License
Creative Commons License

All content on Tim Bovee, Private Trader by Timothy K. Bovee is licensed under a Creative Commons Attribution-ShareAlike 4.0 International License.

Based on a work at www.timbovee.com.
Trader’s Notebook

12:30 p.m. New York time

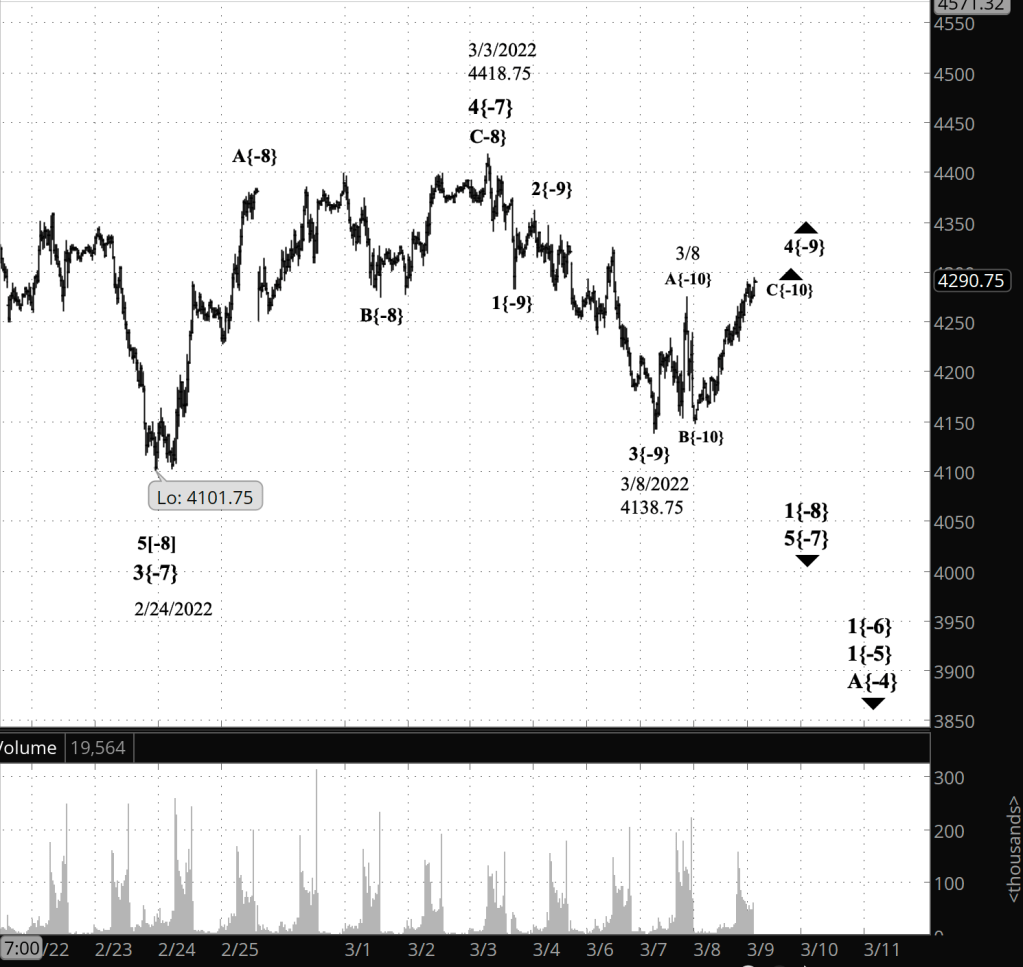
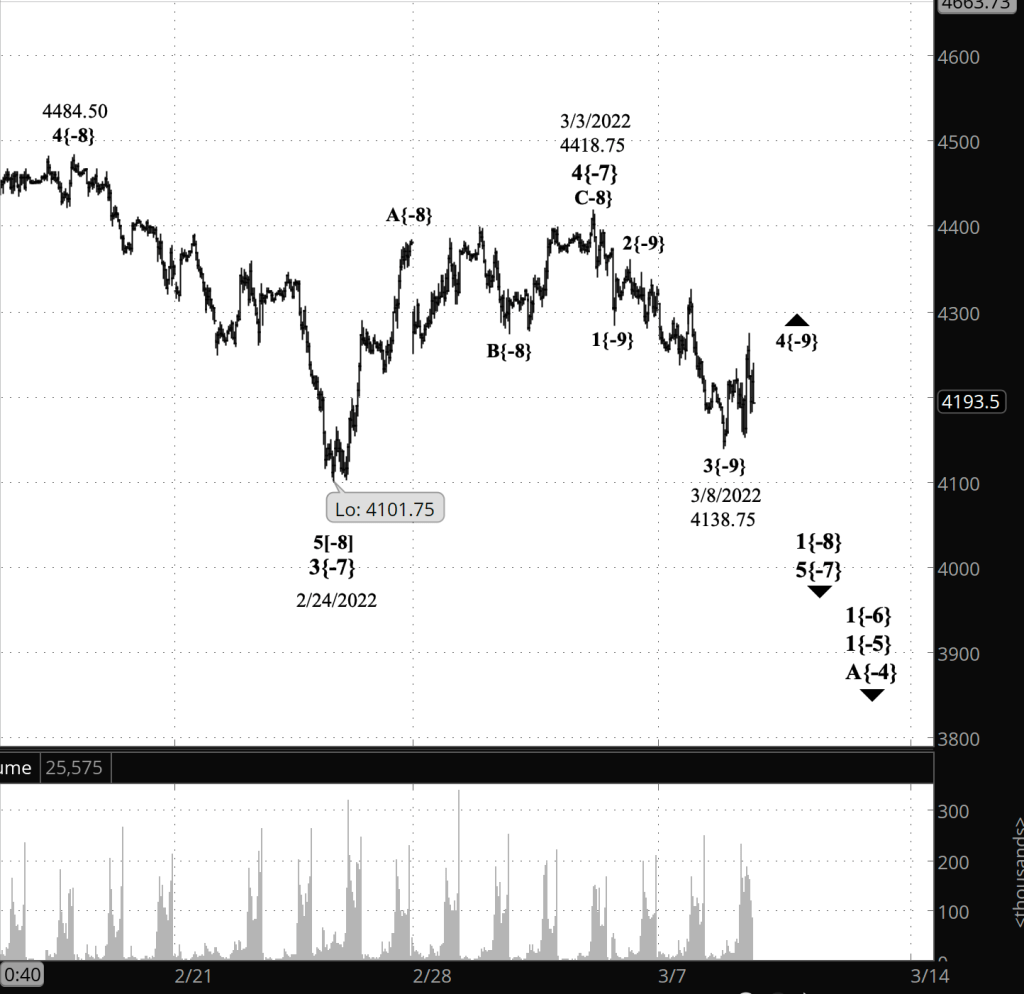
Half an hour before the closing bell. The S&P 500 futures have continued to rise during the trading session, coming close to 4300. The present wave in progress is rising wave C{-10} within an upward correction, wave 4{-9}, within downtrending wave 1{-8}. I’ve updated the chart.

9:35 a.m. New York time

What’s happening now? The S&P 500 E-mini futures rose in overnight trading, moving into the mid-4200s.

What does it mean? The rise is the third, and perhaps final, leg of an upward correction that began on March 8.

What’s the alternative? It’s possible that the upward correction ended at the March 8 high, 4275, and that the subsequent decline is a continuation of the larger downtrend that began on March 3.

[S&P 500 E-mini futures at 3:30 p.m., 30-minute bars, with volume]

What does Elliott wave theory say? Under my principal analysis, the upward correction is wave 4{-9}, and within it, the overnight rise is wave C{-10}. Corrections tend to have three waves internally, but there is an exception. Wave 4{-9} could form a compound correction, where several three-wave corrective patterns within it are linked together. As many as three corrective patterns can be part of a compound correction. The correction is happening within wave 5{-7}, a downtrending impulse wave that began on March 3.

The alternative analysis places the end of wave 4{-9} at the March 8 high, the point labeled as the end of wave A{-10} in the principal analysis. Under this scenario, the subsequent decline is wave 5{-9}, the final wave within its parent wave 1{-8}, which began its downward trek on March 3.

Wave 4{-9} is a Flat corrective pattern, and so internally its A and B waves will have three waves internally, at the {-10} degree, and its C wave will have five waves internally. And indeed, A and B encompass three waves each.

However, wave-counting is never that simple. At a closer up view, it’s possible to see a lot of ambiguity in the count. The wave count I used in my principal analysis seems to best fit the Elliott rule set. And in either case — the principal or the alternative — the price will soon reverse, if it hasn’t already, and wave 5{-9} will carry the price down below 4101.75, the end of wave 3{-7} on February 24, and perhaps significantly below that level.

This is all happening within wave 1{-6}, which in turn is part of wave 1{-5} within wave A{-4}, all of which began on January 4 from 4808.25. Those structures are part of a downward correction, wave 4{-3}, which also began on January 4.

We Are Here.

These are the waves currently in progress under my principal analysis. Each line on the list shows the wave number, with the subscript in curly brackets, the traditional degree name, the starting date, the starting price of the S&P 500 E-mini futures, and the direction of the wave.

  • 5{0} Intermediate, 12/21/2018, 2316.75 (up)
  • 3{1} Minor, 3/23/2018 2174 (up)
  • 5{-2} Minute, 10/4/2020, 4267.50 (up)
  • 4{-3} Minuette, 1/4/2022, 4808.25 (down)
  • A{-4} Subminuette, 1/4/2022, 4808.25 (down)
  • 1{-5} Micro, 1/4/2022, 4808.25 (down)
  • 1{-6} Submicro, 1/4/2022, 4808.25 (down)
  • 5{-7} Minuscule, 3/3/2022, 4101.75 (down)
  • 1{-8} Subminuscule, 3/3/2022, 4101.75 (down)
  • 4{-9} Bitsy, 3/8/2022, 4178.35 (up)

Learning and other resources. Elliott wave analysis provides context, not prophecy. As the 20th century semanticist Alfred Korzybski put it in his book Science and Sanity (1933), “The map is not the territory … The only usefulness of a map depends on similarity of structure between the empirical world and the map.” And I would add, in the ever-changing markets, we can judge that similarity of structure only after the fact.

See the menu page Analytical Methods for a rundown on where to go for information on Elliott wave analysis.

By Tim Bovee, Portland, Oregon, March 9, 2022

Disclaimer

Tim Bovee, Private Trader tracks the analysis and trades of a private trader for his own accounts. Nothing in this blog constitutes a recommendation to buy or sell stocks, options or any other financial instrument. The only purpose of this blog is to provide education and entertainment.

No trader is ever 100 percent successful in his or her trades. Trading in the stock and option markets is risky and uncertain. Each trader must make trading decisions for his or her own account, and take responsibility for the consequences.

License
Creative Commons License

All content on Tim Bovee, Private Trader by Timothy K. Bovee is licensed under a Creative Commons Attribution-ShareAlike 4.0 International License.

Based on a work at www.timbovee.com.
Trader’s Notebook

3:30 p.m. New York time

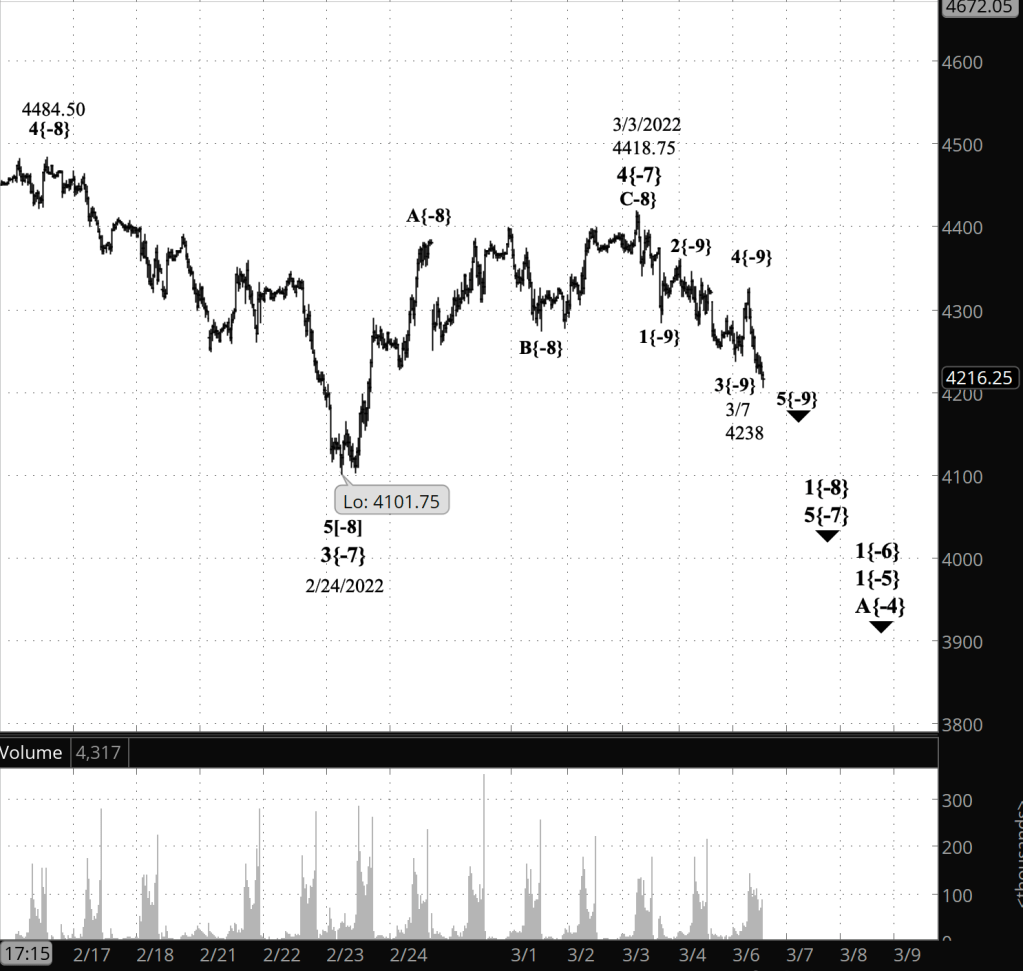
Half an hour before the closing bell. The S&P 500 futures has reached a peak during today’s session of 4275. It reversed from that level, declined, and now has moved again back to the upside. A close view of the day’s trading suggests that internally, the upward movement is still in its third and most likely final leg. In Elliott wave terminology, the upward movement is wave 4{-9}, and within it, I count rising wave C{-10} as being underway. The C wave will most likely have five waves within it, and I count rising wave 3{-11} as now being underway, with declining wave 4{-11} and rising wave 5{-11} to follow.

10:15 a.m. New York time

Exited MRVL earnings play. I’ve exited my short bull put options spread on MRVL at 25% of maximum potential profit and have updated the trade analysis with full results.

9:35 a.m. New York time

What’s happening now? The S&P 500 E-mini futures declined to 4178.35 in overnight trading and then in the early morning hours reversed, rising nearly 95 points, to 4233.50.

What does it mean? By my principal analysis the low, 4178.35, marks the end of the middle leg of the decline that began on March 3 from 4418.75. The upward move is a low-level correction within the larger downtrend and will be followed by a push lower that I expect to reach below the February 24 low, 4101.75.

What’s the alternative? It possible to see the overnight low as being the end of the last leg of the decline from March 3, and the subsequent rise as the beginning of a larger upward correction that will carry the price up toward the March 3 high, 4418.75. I expect the price to remain below that level. I’ll discuss my reasoning for rejecting this scenario in the Elliott wave theory, below.

Also, as a second alternative, the downward leg could still be underway. If the subsequent rise continues with three legs — up, down, up — then this alternative will be disproven.

[S&P 500 E-mini futures at 3:30 p.m., 40-minute bars, with volume]

What does Elliott wave theory say? Under my principal analysis, the overnight low, 4138.75, was the end of wave 3{-9} within wave 1{-8}, both downtrending waves. The reversal from the overnight low is the beginning of wave 4{-9}, an upward correction, with three wave internally, within the larger downtrend.

Today’s analysis differs from Monday’s in that I’ve moved the end of wave 3{-9} to today’s low from Monday’s low point, 4181. The extent of the downward move had the feel of an energetic 3rd wave more than a 5th wave. Leaving the end of wave 3{-9} at 4181 produced an awkwardly short 3rd wave compared to the subsequent 5th.

Note that there is nothing in the rules that requires a 5th wave to be shorter than the preceding 3rd wave. The closest rule is that the 3rd wave can’t be shorter than both waves 1 and 5. And 5th waves have a lot of variety. They can be truncated, ending below the end of the preceding 3rd wave. Or they can extend, moving quite a bit further than seems reasonable.

As is often the case in Elliott wave analysis, it’s an aesthetic judgement — what analysis matches the look and feel of what I’ve seen before in my decades of chart analysis. If that look and feel changes, then I’ll readily alter my principal analysis to accommodate it.

So i rejected the alternative analysis, which labels the overnight low, 4138.75, as the end of wave 5{-9} within wave 1{-8}. the subsequent rise would be labeled wave A{-9} within wave 2{-8}, an upward correction.

A second alternative is that downtrendng wave 3{-9} is still underway. A rapid return to new lows after this morning’s rise will increase the likelihood of this scenario.

We Are Here.

These are the waves currently in progress under my principal analysis. Each line on the list shows the wave number, with the subscript in curly brackets, the traditional degree name, the starting date, the starting price of the S&P 500 E-mini futures, and the direction of the wave.

  • 5{0} Intermediate, 12/21/2018, 2316.75 (up)
  • 3{1} Minor, 3/23/2018 2174 (up)
  • 5{-2} Minute, 10/4/2020, 4267.50 (up)
  • 4{-3} Minuette, 1/4/2022, 4808.25 (down)
  • A{-4} Subminuette, 1/4/2022, 4808.25 (down)
  • 1{-5} Micro, 1/4/2022, 4808.25 (down)
  • 1{-6} Submicro, 1/4/2022, 4808.25 (down)
  • 5{-7} Minuscule, 3/3/2022, 4101.75 (down)
  • 1{-8} Subminuscule, 3/3/2022, 4101.75 (down)
  • 4{-9} Bitsy, 3/8/2022, 4178.35 (up)

Learning and other resources. Elliott wave analysis provides context, not prophecy. As the 20th century semanticist Alfred Korzybski put it this way in his book Science and Sanity (1933), “The map is not the territory … The only usefulness of a map depends on similarity of structure between the empirical world and the map.” And I would add, in the ever-changing markets, we can judge that similarity of structure only after the fact.

See the menu page Analytical Methods for a rundown on where to go for information on Elliott wave analysis.

By Tim Bovee, Portland, Oregon, March 8, 2022

Disclaimer

Tim Bovee, Private Trader tracks the analysis and trades of a private trader for his own accounts. Nothing in this blog constitutes a recommendation to buy or sell stocks, options or any other financial instrument. The only purpose of this blog is to provide education and entertainment.

No trader is ever 100 percent successful in his or her trades. Trading in the stock and option markets is risky and uncertain. Each trader must make trading decisions for his or her own account, and take responsibility for the consequences.

License
Creative Commons License

All content on Tim Bovee, Private Trader by Timothy K. Bovee is licensed under a Creative Commons Attribution-ShareAlike 4.0 International License.

Based on a work at www.timbovee.com.
SPY Trade

S&P 500 ETF Trust (SPY)

Lot 2022-4

Update 4/12/2022: I exited my short bear call vertical options spread on SPY, two days before expiration, for an $8.50 debit per contract/share, a loss before fees of $392 per contract. Shares were trading at $443.33, up $20.5 from the entry level.

The Implied Volatility Rank at exit was 37.8%, down 64.9 points from the entry level.

I exited because the position because the options it was built from were days away from expiration. The position became unprofitable shortly after I entered it, and remained unprofitable as the share price moved contrary to my expectations.

Shares rose by 4.9% over 36 days for a +50% annual rate. The options position produced a 46.1% loss for a -468% annual rate.


I have entered a short bear call vertical spread on SPY, using options that trade for the last time 37 days hence, on April 14. The premium is a $4.58 credit per contract share and the stock at the time of entry was priced at $422.58.

The Implied Volatility Ratio stood at 102.7%.

Premium:$4.58Expire OTM
SPY-bull call spreadStrikeOddsDelta
Calls
Long440.0072.0%32
Break-even434.5866.5%38
Short430.0061.0%44

The premium is 91.6% of the width of the position’s short/long spread. The profit zone covers a 1.8% move to the upside and an unlimited move to the downside.

The risk/reward ratio is 1.2:1, with maximum risk of $542 and maximum reward of $458 per contract.

How I chose the trade. SPY, along with the rest of the S&P 500 family of instruments, ended an upward correction on March 7 at 441.11 and resumed its downtrend. I expect the price to move below 410.64, where the correction began, and perhaps significantly below that level. I set the strike price for the long call close to the peak of the upward correction, anticipating that the price won’t move above that level.

By Tim Bovee, Portland, Oregon, March 7, 2022

Disclaimer

Tim Bovee, Private Trader tracks the analysis and trades of a private trader for his own accounts. Nothing in this blog constitutes a recommendation to buy or sell stocks, options or any other financial instrument. The only purpose of this blog is to provide education and entertainment.

No trader is ever 100 percent successful in his or her trades. Trading in the stock and option markets is risky and uncertain. Each trader must make trading decisions for his or her own account, and take responsibility for the consequences.

License
Creative Commons License

All content on Tim Bovee, Private Trader by Timothy K. Bovee is licensed under a Creative Commons Attribution-ShareAlike 4.0 International License.

Based on a work at www.timbovee.com.
Trader’s Notebook

3:30 p.m.

Half an hour before the closing bell. See the 2:55 p.m. entry below. No change. Wave 5{-9} continues its decline. I’ve updated the chart again.

2:55 p.m. New York time

S&P 500 futures end upward correction, reverse downward. The S&P 500 futures have ended the wave 4{-9} upward correction and have reverse to the downside, moving below the correction’s starting point. I’ve updated the chart, below.

SPY options spread entry. I’ve entered a short bear call options spread on SPY, anticipating that it will track the S&P 500 to the downside as wave 5{-9} continues. I’ve posted an analysis of the trade.

9:35 a.m. New York time

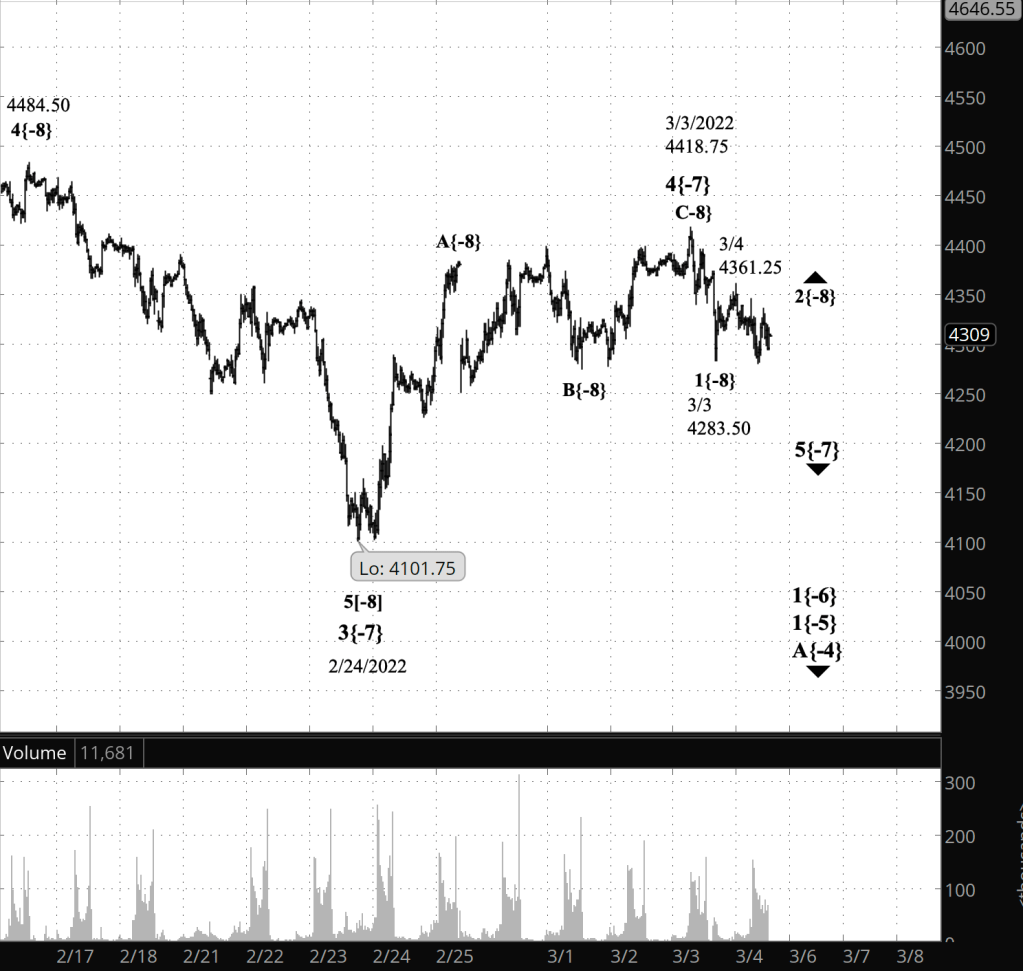
What’s happening now? The S&P 500 E-mini futures reached a low of 4238 in overnight trading and then reversed, having risen more than 90 points at the opening bell.

What does it mean? The decline from March 3 high was a resumption of the downtrend that began on January 4. Internally, it is in an upward correction that began overnight within its first leg.

What’s the alternative? The ambiguity on the chart as to do with size of the movements being analyzed. Elliott waves are fractal in nature — a five-wave trend contains with it both smaller five-wave uptrends and three-wave corrections. The smaller degree labelings on a chart this early in a trend will be, at best, a guess.

[S&P 500 E-mini futures at 3:30 p.m., 35-minute bars, with volume]

What does Elliott wave theory say? Downtrending wave 5{-7}, a resumption of the downtrending wave 1{-6}, which began on January 4, is now underway. Internally, it is in wave 1{-8} to the downside, and one degree lower, within an upward correction, wave 4{-9}.

In Friday’s analysis I had labeled the smallest degrees on the chart as being of degree {-8}, but given the swiftness of their completion, I’ve pushed them down one degree smaller, to degree {-9}. This is what I meant above about the ambiguity of degrees early in a price trend — there’s simply not enough data to know for a certainty the size of the degree being labeled.

Wave 4{-9}, when complete, will be followed by wave 5{-9} to downside, the final wave within wave 1{-8}. It will carry the price below the 4238 terminus of wave 3{-8}, perhaps significantly below for such a small-degree wave.

We Are Here.

These are the waves currently in progress under my principal analysis. Each line on the list shows the wave number, with the subscript in curly brackets, the traditional degree name, the starting date, the starting price of the S&P 500 E-mini futures, and the direction of the wave.

  • 5{0} Intermediate, 12/21/2018, 2316.75 (up)
  • 3{1} Minor, 3/23/2018 2174 (up)
  • 5{-2} Minute, 10/4/2020, 4267.50 (up)
  • 4{-3} Minuette, 1/4/2022, 4808.25 (down)
  • A{-4} Subminuette, 1/4/2022, 4808.25 (down)
  • 1{-5} Micro, 1/4/2022, 4808.25 (down)
  • 1{-6} Submicro, 1/4/2022, 4808.25 (down)
  • 5{-7} Minuscule, 3/3/2022, 4101.75 (down)
  • 1{-8} Subminuscule, 3/3/2022, 4101.75 (down)
  • 4{-9} Bitsy, 3/7/2022, 4238 (up)

Learning and other resources. Elliott wave analysis provides context, not prophecy. As the 20th century semanticist Alfred Korzybski put it this way in his book Science and Sanity (1933), “The map is not the territory … The only usefulness of a map depends on similarity of structure between the empirical world and the map.” And I would add, in the ever-changing markets, we can judge that similarity of structure only after the fact.

See the menu page Analytical Methods for a rundown on where to go for information on Elliott wave analysis.

By Tim Bovee, Portland, Oregon, March 7, 2022

Disclaimer

Tim Bovee, Private Trader tracks the analysis and trades of a private trader for his own accounts. Nothing in this blog constitutes a recommendation to buy or sell stocks, options or any other financial instrument. The only purpose of this blog is to provide education and entertainment.

No trader is ever 100 percent successful in his or her trades. Trading in the stock and option markets is risky and uncertain. Each trader must make trading decisions for his or her own account, and take responsibility for the consequences.

License
Creative Commons License

All content on Tim Bovee, Private Trader by Timothy K. Bovee is licensed under a Creative Commons Attribution-ShareAlike 4.0 International License.

Based on a work at www.timbovee.com.
Trader’s Notebook

3:30 p.m. New York time

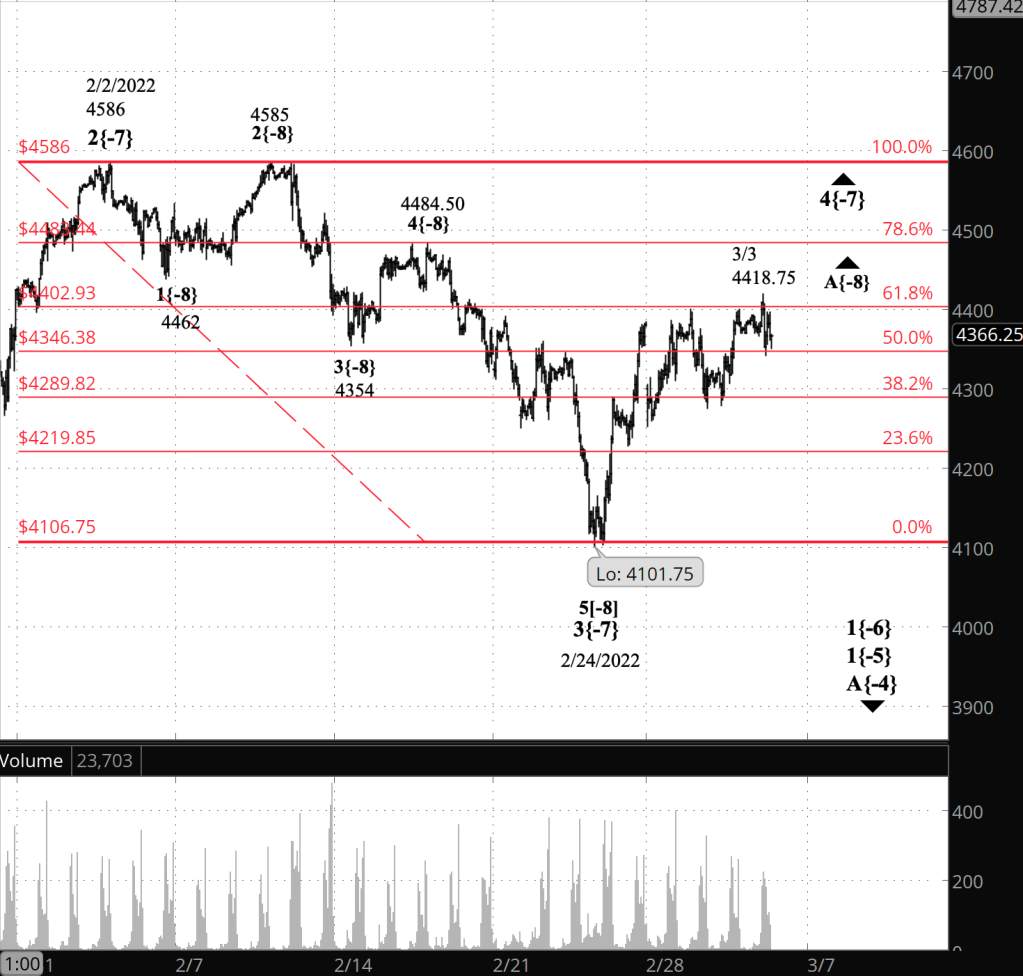
Half an hour before the closing bell. The S&P 500 futures fell from the overnight high, 4361.25, to low of 4281.25 during the day and then rose a bit. Wave 2{-8}, an upward correction, is underway and internally is in either its B (middle) wave to the downside or has started its C (final) wave to the upside. All of this is happening within downtrending wave 5{-7} within downtrending wave 1{-6}. I’ve updated the chart.

9:35 a.m. New York time

What’s happening now? The S&P 500 E-mini futures traded in a narrow range below the 50% retracement of the rise that began on February 24.

What does it mean? By my best reckoning, the March 3 peak marks the end of the upward correction that began on February 24. The final leg of the downtrend that began on January 4 is underway and will carry the price well below 4101.75, the end point of the middle leg of the downtrend.

What’s the alternative? There are two.

Alternative #1: The March 3 peak was the end of the first leg of the upward correction that began on February 24 and is still underway.

Alternative #2: The March 3 peak is the end of the final leg, still underway, of the ongoing upward correction.

[S&P 500 E-mini futures at 3:30 p.m., 30-minute bars, with volume]

What does Elliott wave theory say? Elliott wave analysis is famous for its ambiguities and is illustrating that fact again today. Everything hinges on the interpretation of the March 3 high.

Under my principal analysis, the March 3 high , 4418.75, marked the end of a Zigzag correction that began on February 24 from 4101.75. From that point wave 5{-7} began. It is the final wave within wave 1{-6}, the downtrend that began on January 4.

That principal analysis best fits the chart, in my opinion. However, a strong case can be made for the two alternative counts.

Alternative #1 sees the March 3 high as the end of wave A{-8}, the first leg of the wave 4{-7} upward correction that began on February 24. The subsequent decline under this scenario is wave B{-8}, which will be followed by a rising finale, wave C{-8}, which likely will end wave 4{-7}, unless it forms a compound structure, stringing several corrective patterns together.

Alternative #2, like the principal analysis, sees the March 3 high as being within wave C{-8}, but under this scenario wave C{-8} is not complete.

The principal analysis will be confirmed if the price falls below 4101.75, the end of wave 3{-7}. Alternative #1 will be proven if the price continues to decline but remains above the end of wave 3{-7}. Alternative #2 will be proven if the price moves above the March 3 high, 4418.75.

One note on the principal analysis. I’ve marked the March 3 low as the end of wave 1{-8}. The degree of a movement is at best a guess in the early stages, and that low could well be of a lower degree, {-9} or {-10}. The proper degree labelling will sort itself out as wave 5{-7} continues.

We Are Here.

These are the waves currently in progress under my principal analysis. Each line on the list shows the wave number, with the subscript in curly brackets, the traditional degree name, the starting date, the starting price of the S&P 500 E-mini futures, and the direction of the wave.

  • 5{0} Intermediate, 12/21/2018, 2316.75 (up)
  • 3{1} Minor, 3/23/2018 2174 (up)
  • 5{-2} Minute, 10/4/2020, 4267.50 (up)
  • 4{-3} Minuette, 1/4/2022, 4808.25 (down)
  • A{-4} Subminuette, 1/4/2022, 4808.25 (down)
  • 1{-5} Micro, 1/4/2022, 4808.25 (down)
  • 1{-6} Submicro, 1/4/2022, 4808.25 (down)
  • 5{-7} Minuscule, 3/3/2022, 4418.75 (down)
  • 2{-8} Subminuscule, 3/3/2022, 4283.50 (up)

Learning and other resources. Elliott wave analysis provides context, not prophecy. As the 20th century semanticist Alfred Korzybski put it this way in his book Science and Sanity (1933), “The map is not the territory … The only usefulness of a map depends on similarity of structure between the empirical world and the map.” And I would add, in the ever-changing markets, we can judge that similarity of structure only after the fact.

See the menu page Analytical Methods for a rundown on where to go for information on Elliott wave analysis.

By Tim Bovee, Portland, Oregon, March 4, 2022

Disclaimer

Tim Bovee, Private Trader tracks the analysis and trades of a private trader for his own accounts. Nothing in this blog constitutes a recommendation to buy or sell stocks, options or any other financial instrument. The only purpose of this blog is to provide education and entertainment.

No trader is ever 100 percent successful in his or her trades. Trading in the stock and option markets is risky and uncertain. Each trader must make trading decisions for his or her own account, and take responsibility for the consequences.

License
Creative Commons License

All content on Tim Bovee, Private Trader by Timothy K. Bovee is licensed under a Creative Commons Attribution-ShareAlike 4.0 International License.

Based on a work at www.timbovee.com.
MRVL Trade

Marvell Technology Inc. (MRVL)

Update 3/8/2022: I exited my bull put vertical options spread on MRVL, 37 days before expiration, for a $1.01 debit per contract/share, a profit before fees of $33 per contract. Shares were trading at $67.78, up $1.15 from the entry level.

The Implied Volatility Rank at exit was 66.7%, down 22.9 points from the entry level.

I exited because the position reached 25% of maximum potential profit, my normal exit point for earnings plays.

Shares rose by 1.7% over 5 days for a +126% annual rate. The options position produced a 32.7% return for a +2,385% annual rate.


I have entered a short bull put vertical spread on MRVL, using options that trade for the last time 42 days hence, on April 14. The premium is a $1.34 credit per contract share and the stock at the time of entry was priced at $66.63.

The Implied Volatility Ratio stood at 89.6%.

Premium:$1.34Expire OTM
MRVL-bull put spreadStrikeOddsDelta
Calls/Puts
Long55.0074.0%18
Break-even61.3468.5%23
Short60.0063.0%28

The premium is 53.6% of the width of the position’s short/long spread. The profit zone covers a 7.9% move to the downside and an unlimited move to the upside.

The risk/reward ratio is 2.7:1, with maximum risk of $366 and maximum reward of $134 per contract.

How I chose the trade. The trade was placed to coincide with MRVL’s earnings announcement, after the closing bell on the day of entry. The short strikes were set to coincide with the expected move of $7.25 either way, based on options pricing, which gives a price range of $60.09 to $74.59.

By Tim Bovee, Portland, Oregon, March 3, 2022

Disclaimer

Tim Bovee, Private Trader tracks the analysis and trades of a private trader for his own accounts. Nothing in this blog constitutes a recommendation to buy or sell stocks, options or any other financial instrument. The only purpose of this blog is to provide education and entertainment.

No trader is ever 100 percent successful in his or her trades. Trading in the stock and option markets is risky and uncertain. Each trader must make trading decisions for his or her own account, and take responsibility for the consequences.

License
Creative Commons License

All content on Tim Bovee, Private Trader by Timothy K. Bovee is licensed under a Creative Commons Attribution-ShareAlike 4.0 International License.

Based on a work at www.timbovee.com.

Trader’s Notebook

3:30 p.m. New York time

Half an hour before the closing bell. The S&P 500 futures so far have traded below the morning high, 4418.75, throughout the session, remaining in the region between the 61.8% and 50% retracement levels. The analysis is ambiguous. Was the morning high the end of wave A{-8} within wave 4{-7}? Or is the present decline just a mini-correction within a still rising wave A{-8}? Flip a coin. there’s no way to choose between them. I’ve updated the chart, continuing to mark it to show wave A{-8} still in progress.

10:40 a.m. New York time

MRVL earnings play entry. I’ve entered a short bull put options spread on MRVL and have posted a trade analysis.

10:15 a.m. New York time

NEM earnings play exit. I exited my short bull put options spread on NEM for 28.1% of maximum and have updated the trade analysis with full results.

9:35 a.m. New York time

What’s happening now? The S&P 500 E-mini futures broke past the prior high, 4399, in the rise that began on February 24, reaching 4418.75 at the opening bell. The rise brought the price above the 61.8% Fibonacci retracement level.

What does it mean? The first leg of the upward correction that began on February 24 is still underway.

What’s the alternative? I have no viable alternative at this point. For more on the subject, see the Elliott wave theory section below.

[S&P 500 E-mini futures at 3:30 p.m., hourly bars, with volume]

What does Elliott wave theory say? The rise is wave A{-8} within wave 4{-7}. Yesterday’s afternoon analysis counted wave A{-8} as complete at the February 28 high, 4399. Today’s break above that level invalidates that analysis in favor wave wave A{-8} continuing. Under the rules of Elliott wave analysis, a 4th wave can’t move beyond the end of the preceding 1st wave. In this case, the end of wave 1{-7} was 4586 on February 2, and that price is the upper limit of wave 4{-7}.

In analyzing the chart I considered whether the February 28 high could be considered the end of wave A{-8}, the following decline wave B{-8}, and the subsequent rise still underway as wave C{-8}. However, under Elliott’s rules, a B wave must retrace at least 90% of the preceding A wave, and the rather stunted decline after February 28 falls short. So, I’m left without an alternative this morning. Past experience being a guide, I’m quite certain that ambiguities will develop.

We Are Here.

These are the waves currently in progress under my principal analysis. Each line on the list shows the wave number, with the subscript in curly brackets, the traditional degree name, the starting date, the starting price of the S&P 500 E-mini futures, and the direction of the wave.

  • 5{0} Intermediate, 12/21/2018, 2316.75 (up)
  • 3{1} Minor, 3/23/2018 2174 (up)
  • 5{-2} Minute, 10/4/2020, 4267.50 (up)
  • 4{-3} Minuette, 1/4/2022, 4808.25 (down)
  • A{-4} Subminuette, 1/4/2022, 4808.25 (down)
  • 1{-5} Micro, 1/4/2022, 4808.25 (down)
  • 1{-6} Submicro, 1/4/2022, 4808.25 (down)
  • 4{-7} Minuscule, 2/24/2022, 4101.75 (up)
  • A{-8} Subminuscule, 2/24/2022, 4101.75 (up)

Learning and other resources. Elliott wave analysis provides context, not prophecy. As the 20th century semanticist Alfred Korzybski put it this way in his book Science and Sanity (1933), “The map is not the territory … The only usefulness of a map depends on similarity of structure between the empirical world and the map.” And I would add, in the ever-changing markets, we can judge that similarity of structure only after the fact.

See the menu page Analytical Methods for a rundown on where to go for information on Elliott wave analysis.

By Tim Bovee, Portland, Oregon, March 3, 2022

Disclaimer

Tim Bovee, Private Trader tracks the analysis and trades of a private trader for his own accounts. Nothing in this blog constitutes a recommendation to buy or sell stocks, options or any other financial instrument. The only purpose of this blog is to provide education and entertainment.

No trader is ever 100 percent successful in his or her trades. Trading in the stock and option markets is risky and uncertain. Each trader must make trading decisions for his or her own account, and take responsibility for the consequences.

License
Creative Commons License

All content on Tim Bovee, Private Trader by Timothy K. Bovee is licensed under a Creative Commons Attribution-ShareAlike 4.0 International License.

Based on a work at www.timbovee.com.

Trader’s Notebook

3:30 p.m. New York time

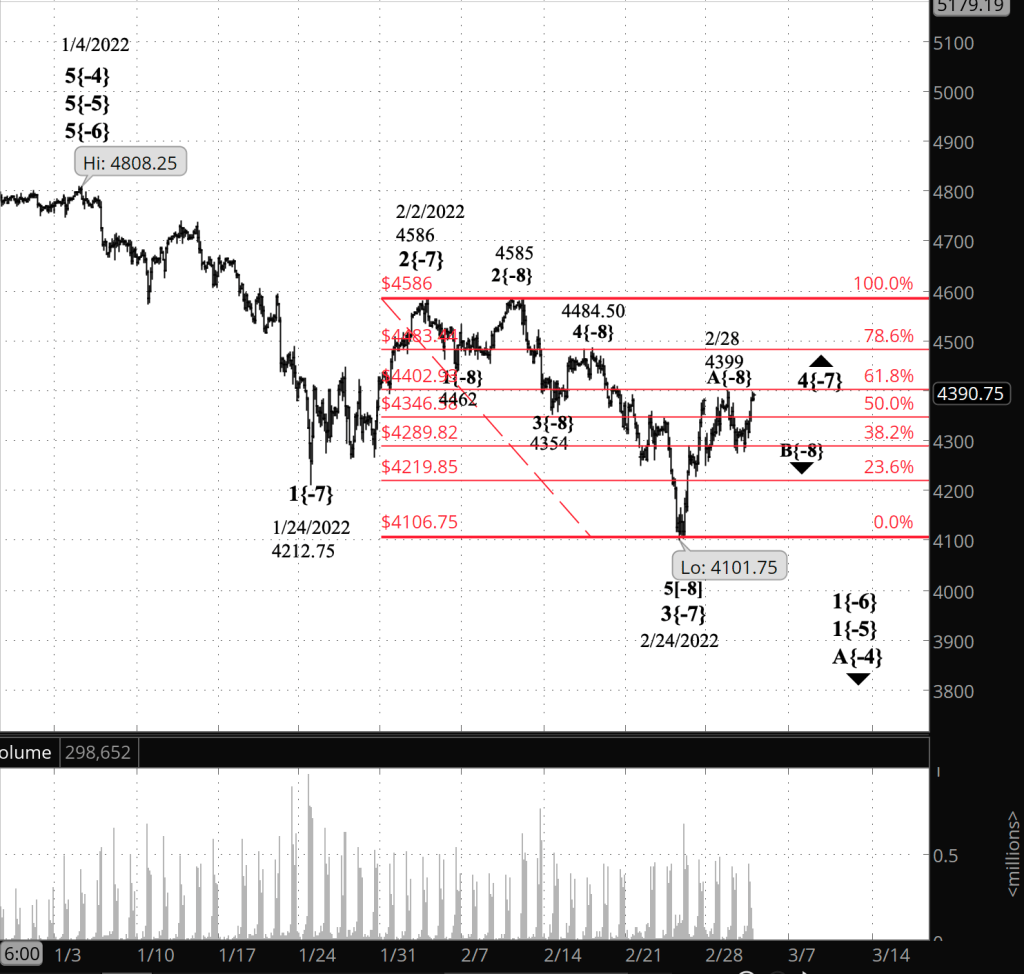
Half an hour before the market close. The S&P 500 futures rose to within two points of the February 28 high, 4399, which my analysis this morning had identified as the end of wave A{-8} and the beginning of downward wave B{-8}, the middle wave within the larger wave 4{-7} upward correction. If the price moves above 4399, then this morning’s analysis, which sees wave B{-8} as being underway, must be scrapped and replaced by the alternative, which sees wave A{-8} as being still underway. As of this time the B-wave-in-progress scenario stands. And under the alternative analysis, the only change is to the interpretation of the February 28 peak. The rest of the analysis applies to both scenarios. I’ve updated the chart.

10:30 a.m. New York time

OKE earnings play exit. I’ve exited my short bull put options spread on OKE for 24.8% of maximum potential profit and have updated the entry analysis with full results.

9:35 a.m. New York time

What’s happening now? The S&P 500 E-mini futures rose from a 38.2% retracement back to a 50% retracement — both are Fibonacci levels — and then declined slightly before the opening bell.

What does it mean? The movement is consistent with my principal analysis from yesterday — the downward middle wave of an upward correction, which began on February 24, is now underway.

What’s the alternative? The upward correction ended at the February 28 high, and the subsequent decline is a resumption of the downtrend that began on January 4.

[S&P 500 E-mini futures at 3:30 p.m., 2-hour bars, with volume]

What does Elliott wave theory say? The decline from February 28 is wave B{-8} within an upward correction, wave 4{-7}, which began on February 24. All of that is happening within downtrending wave 1{-6}, which began on January 4. That 1st wave is contained within wave 1{-5} of wave A{-4}, which all began on that same day.

Wave B{-8} will be followed by upward wave C{-8}, the final wave in a three-wave corrective pattern. Under the rules of Elliott wave analysis the correction could end with the C wave. However, sometimes corrections have a compound structure, linking up to three corrective patterns together. If a compound correction forms, then upward wave C{-8} will be followed by downward wave X{-8}, which will connect the first corrective pattern with a second one. The parent wave is a 4th, and 4th waves have a greater tendency toward compound structures than do the other corrective waves, the 2nd.

When wave 4{-7} is complete, it will be followed by wave 5{-7}, which will fall below the end of the preceding 3rd wave, 4101.75 on February 24, perhaps significantly below that level. The end of wave 5{-7} will also end its parent, wave 1{-6}. The following wave 2{-6} will be an upward correction. Second waves tend to retrace a great deal of the preceding 1st wave, and so wave 2{-6} will present an opportunity to close out bullish positions before the magnitude of the subsequent wave 3{-6} decline puts the markets in panicky mood.

The alternative analysis sees the February 28 peak as the end of wave 4{-7} and the subsequent decline as the early stage of wave 5{-7}.

We Are Here.

These are the waves currently in progress under my principal analysis. Each line on the list shows the wave number, with the subscript in curly brackets, the traditional degree name, the starting date, the starting price of the S&P 500 E-mini futures, and the direction of the wave.

  • 5{0} Intermediate, 12/21/2018, 2316.75 (up)
  • 3{1} Minor, 3/23/2018 2174 (up)
  • 5{-2} Minute, 10/4/2020, 4267.50 (up)
  • 4{-3} Minuette, 1/4/2022, 4808.25 (down)
  • A{-4} Subminuette, 1/4/2022, 4808.25 (down)
  • 1{-5} Micro, 1/4/2022, 4808.25 (down)
  • 1{-6} Submicro, 1/4/2022, 4808.25 (down)
  • 4{-7} Minuscule, 2/24/2022, 4101.75 (up)
  • B{-8} Subminuscule, 2/28/2022, 4399 (down)

Learning and other resources. Elliott wave analysis provides context, not prophecy. As the 20th century semanticist Alfred Korzybski put it this way in his book Science and Sanity (1933), “The map is not the territory … The only usefulness of a map depends on similarity of structure between the empirical world and the map.” And I would add, in the ever-changing markets, we can judge that similarity of structure only after the fact.

See the menu page Analytical Methods for a rundown on where to go for information on Elliott wave analysis.

By Tim Bovee, Portland, Oregon, March 2, 2022

Disclaimer

Tim Bovee, Private Trader tracks the analysis and trades of a private trader for his own accounts. Nothing in this blog constitutes a recommendation to buy or sell stocks, options or any other financial instrument. The only purpose of this blog is to provide education and entertainment.

No trader is ever 100 percent successful in his or her trades. Trading in the stock and option markets is risky and uncertain. Each trader must make trading decisions for his or her own account, and take responsibility for the consequences.

License
Creative Commons License

All content on Tim Bovee, Private Trader by Timothy K. Bovee is licensed under a Creative Commons Attribution-ShareAlike 4.0 International License.

Based on a work at www.timbovee.com.