Trader’s Notebook

3:30 p.m. New York time

Half an hour before the closing bell. No change from the re-analysis that I posted an hour and 10 minutes ago. Wave 2{-7}, an upward correction, continues and now internally is in wave C{-8}, it’s final wave, unless it extends in a complex correction. Wave C{-8} will have five waves total within it and by my count is now on it’s middle leg, upward wave 3{-9}. I’ve updated the chart.

2:20 p.m. New York time

The new principal analysis. The old principal analysis from this morning having been invalidated when it bumped into a firm rule of Elliott wave theory, I’ve been looking at the chart to find a re-analysis that would be true to the rules.

One approach that I try to take with any reanalysis is that of Minimum Necessary Change, a term borrowed from Isaac Asimov’s 1955 time-travel novel The End of Eternity. In it, the guardians of the future make small changes in the past — moving a box from one shelf to another — in order safeguard the timeline that leads to them. They make the Minimum Necessary Change.

In the case of the S&P 500, the Minimum Necessary Change would keep the 4th wave rule from being broken (see the discussion below) while preserving the January 4 peak as a significant reversal in the trend.

The way to do that is to make the rise that began on January 24 into something other than a 4th wave. Which I’ve done, by taking some waves that had been at degree {-7} in the earlier count and demoting them to degree {-8}, which makes the low of January 24 the end of wave 1{-7} and the subsequent rise an upward correction, wave 2{-7}, which is still underway and internally is in its 3rd wave, wave C{-8}.

The rule for 2nd waves is this: Wave 2 cannot move above the beginning of the preceding wave 1. That 1st wave began at the January 4 peak, 2808.25, leaving ample room for wave 2{-7} to complete its rise before the downtrend continues with wave 3{-7} to the downside.

Yesterday I entered a bear position on SPY based on the old principal analysis. The reasoning behind the trade remains valid under the new analysis.

1:05 p.m. New York time

S&P 500 index invalidates 4th-wave count. The S&P 500 index has moved above the low of January 10. In terms of Elliott wave theory, that low point, 4582.84, was then end of wave 1{-7}. This morning’s principal count had labelled the rise from January 24 as wave 4{-7}. if a 4th wave moves beyond the end of the prior 1st wave, then it’s not a 4th wave, and something else is going on. I’ll post a fresh analysis half an hour before the closing bell.

12:55 p.m. New York time

SPY breaks the 4th wave rule. The exchange-traded fund SPY, based on the S&P 500, joined the S&P 500 futures in moving above the end of the preceding 1st wave, which beaks a rule of Elliott wave theory. See my extensive discussion of the question from this morning. The S&P 500 index, the decider in case of conflicting signals, remains below the end of the preceding 1st wave. The 1st wave terminus for SPY was $456.60, and the price has moved above that level, so far, by 8 cents.

10:20 a.m. New York time

FB earnings play entry. I’ve entered a short bull put options spread on FB timed to coincide with its earnings announcement after the closing bell today. I’ve posted an analysis of the trade.

9:35 a.m. New York time

What’s happening now? The S&P 500 E-mini futures rose overnight to 4580 and then fell back, remaining above the 61.8% Fibonacci retracement level.

What does it mean? The futures high exceeds the end of the first leg of the downtrend that began on January 4, violating a rule of Elliott wave analysis. If that violation is confirmed by the index, then the principal count will be replaced by the alternative count. More on the discrepancy in the Elliott wave theory section.

What’s the alternative? The downward movement from the January 4 peak, 4808.25, was a correction within an ongoing uptrend, which has now resumed and will reach new heights.
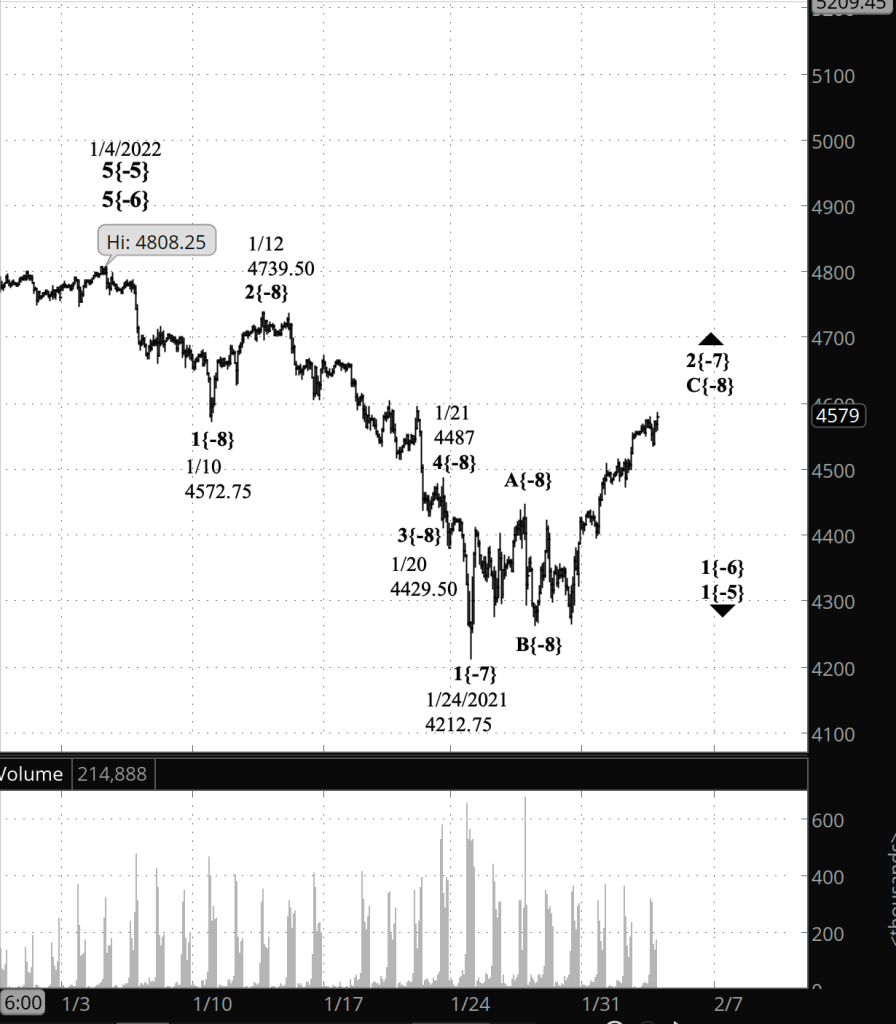
[S&P 500 E-mini futures at 3:30 p.m., 80-minute bars, with volume]

What does Elliott wave theory say? The rules and tendencies governing market behavior described by R.N. Elliott are heavy on the tendency side. The markets are too complex and unruly to march to the beat of a single drummer. Rather, the more accurate comparison is to the unruly Feast of Fools in medieval France However, there are a few rules. One is that the 3rd wave of a trend can’t be the shortest of the three waves in the direction of the trend. Either wave 1 or wave 3 must be shorter. Another rule, applicable in this case, is that the 4th wave can’t move beyond the end of the preceding 1st wave. If it does, then it’s not a 4th wave, and something else is going on.

When Elliott created his theory, there was no S&P 500. He used the Dow Jones Industrial Average. Moreover, there were no index futures and no index-based exchange-traded funds (ETFs) such as SPY. He lived in a market world having far less ambiguity than ours does.

The S&P 500 futures wave 4{-7} moved above the end the wave 1{-7} first during the London market session, and again during the Tokyo market session. The U.S. markets were closed, and the S&P 500 index only tracks prices during the U.S. market session.

There’s also the problem of granularity. The index moves in penny increments with, while the futures move in 25-cent increments, both with prices in the four figures. SPY, the S&P 500 ETF, moves in penny increments with prices in the three figures, meaning its granularity is far less than that of the index.

So, if the futures have violated the 4th wave rule, but the index and ETFs have not, how do we analyze the chart? An expert wise in the ways in Elliott wave analysis once told me that they are separate products and must be analyzed separately. And yet, the futures and the ETFs are clones of the index, closely following it while operating under separate rules and separate platforms.

We’ve been here before. In the run-up of wave 3{-1} after the early pandemic crash, several times the three platforms diverged, and within a few days regained their unanimity. My practice then, when the futures broke a rule but the index did not, was to analyze the futures as though the rule hadn’t been broken. I designated the index as the rule-keeper and required that it also break the rule before changing the analysis.

And that’s what I’ll do today.

Under my principal analysis, wave C{-8} continues it’s rise, trading in the area between the 61.8% and the 78.6% Fibonacci retracement levels. The upward correction parent, wave 4{-7}, continues its upward movement.

Under the alternative analysis, the downward correction that began on January 4 ended on January 24, and wave 5{-7} within wave 5{-6} has resumed its upward course.

At the opening bell the S&P 500 index and SPY remain below the end of wave 1{-7}, which is4582.24 on the index and 456.60 on SPY.

We Are Here.

These are the waves currently in progress according to my principal analysis. Each line on the list shows the wave number, with the subscript in curly brackets, the traditional degree name, the starting date, the starting price of the S&P 500 E-mini futures, and the direction of the wave.

  • 5{0} Intermediate, 12/21/2018, 2316.75 (up)
  • 3{1} Minor, 3/23/2018 2174 (up)
  • 5{-2} Minute, 10/4/2020, 4267.50 (up)
  • 4{-3} Minuette, 1/4/2022, 4808.25 (down)
  • A{-4} Subminuette, 1/4/2022, 4808.25 (down)
  • 1{-5} Micro, 1/4/2022, 4808.25 (down)
  • 1{-6} Submicro, 1/4/2022, 4808.25 (down)
  • 2{-7} Minuscule, 1/24/2022, 4212.75 (up)
  • C{-8} Subminuscule, 1/26/2022, 4263.75 (up)

Learning and other resources. Elliott wave analysis provides context, not prophecy. As the 20th century semanticist Alfred Korzybski put it this way in his book Science and Sanity (1933), “The map is not the territory … The only usefulness of a map depends on similarity of structure between the empirical world and the map.” And I would add, in the ever-changing markets, we can judge that similarity of structure only after the fact.

See the menu page Analytical Methods for a rundown on where to go for information on Elliott wave analysis.

By Tim Bovee, Portland, Oregon, February 2, 2022

Disclaimer

Tim Bovee, Private Trader tracks the analysis and trades of a private trader for his own accounts. Nothing in this blog constitutes a recommendation to buy or sell stocks, options or any other financial instrument. The only purpose of this blog is to provide education and entertainment.

No trader is ever 100 percent successful in his or her trades. Trading in the stock and option markets is risky and uncertain. Each trader must make trading decisions for his or her own account, and take responsibility for the consequences.

License
Creative Commons License

All content on Tim Bovee, Private Trader by Timothy K. Bovee is licensed under a Creative Commons Attribution-ShareAlike 4.0 International License.

Based on a work at www.timbovee.com.
SPY Trade

S&P 500 ETF Trust (SPY)

Update 2/14/2022: I exited my short bear call options spread on SPY, 32 days before expiration, for a $1.40 debit per contract/share, a profit before fees of $2.04 per contract. Shares were trading at $437.54, down $12.98 from the entry level.

The Implied Volatility Rank at exit was 66.1%, up 25.3 points from the entry level.

I exited because the position reached 50% of maximum potential profit, the exit goal under my rules for short option trades.

Shares declined by 2.9% over 13 days for a -81% annual rate. The options position produced an 85.0% return for a +2,387% annual rate.


(I erred in entering the trade and created an iron condor rather than a bear call vertical spread. I’m treating the calls as a separate trade, and have adjusted some figures on this analysis to conform to the lower premium.)

I have entered a short bear call options spread on SPY, using options that trade for the last time 456 days hence, on March 18. The premium is a $4.44 credit per contract share and the exchange-traded fund at the time of entry was priced at $450.52.

The Implied Volatility Ratio stood at 40.8%.

Premium:$4.44Expire OTM
SPY-bear call spreadStrikeOddsDelta
Calls
Long466.0074.0%29
Break-even460.8067.0%36.5
Short456.0060.0%44

The premium is 44.4% of the width of the position’s short/long spread. The profit zone covers a 2.2% move to the upside and an unlimited move to the downside.

The risk/reward ratio is 1.3:1, with maximum risk of $546 and maximum reward of $444 per contract.

How I chose the trade. My Elliott wave analysis shows that an upward correction that began on January 24 on the S&P 500 is nearing an end. Under the results of Elliott, the price of the index and it’s deritives must remain below the end of the first wave of the downtrend that began on January 4. For SPY, the first wave ended at 456.60, and I placed the short strike at 456, which is as close to that level as the strike prices allowed.

By Tim Bovee, Portland, Oregon, February 1, 2022

Disclaimer

Tim Bovee, Private Trader tracks the analysis and trades of a private trader for his own accounts. Nothing in this blog constitutes a recommendation to buy or sell stocks, options or any other financial instrument. The only purpose of this blog is to provide education and entertainment.

No trader is ever 100 percent successful in his or her trades. Trading in the stock and option markets is risky and uncertain. Each trader must make trading decisions for his or her own account, and take responsibility for the consequences.

License
Creative Commons License

All content on Tim Bovee, Private Trader by Timothy K. Bovee is licensed under a Creative Commons Attribution-ShareAlike 4.0 International License.

Based on a work at www.timbovee.com.
GM Trade

General Motors Co. (GM)

Update 3/15/2022: I exited my bull put vertical options spread on GM, three days before expiration, for a $4.90 debit per contract/share, a loss before fees of $379 per contract. Shares were trading at $41.96, down $11.54 from the entry level.

The Implied Volatility Rank at exit was 75.2, up 18.2 points from the entry level.

I exited because the position was in the money as it neared expiration.

Shares declined by 21.6% over 42 days for a -188% annual rate. The options position produced a 77.3% loss for a -672% annual rate.


I have entered a short bull put options spread on GM, using options that trade for the last time 45 days hence, on March 18. The premium is a $1.11 credit per contract share and the stock at the time of entry was priced at $53.50.

The Implied Volatility Ratio stood at 57.0%.

Premium:$1.11Expire OTM
GM-bull put spreadStrikeOddsDelta
Puts
Long45.0081.0%15
Break-even51.1172.0%23
Short50.0063.0%31

The premium is 44.4% of the width of the position’s short/long spread. The profit zone covers a 4.5% move to the downside and an unlimited move to the upside.

The risk/reward ratio is 3.5:1, with maximum risk of $389 and maximum reward of $111 per contract.

How I chose the trade. The trade was placed to coincide with GM’s earnings announcement, after the closing bell on the day of entry. The short strikes were set to coincide with the expected move of $2.50 either way, based on options pricing, which gives a price range of $51.08 to $56.08.

By Tim Bovee, Portland, Oregon, February 1, 2022

Disclaimer

Tim Bovee, Private Trader tracks the analysis and trades of a private trader for his own accounts. Nothing in this blog constitutes a recommendation to buy or sell stocks, options or any other financial instrument. The only purpose of this blog is to provide education and entertainment.

No trader is ever 100 percent successful in his or her trades. Trading in the stock and option markets is risky and uncertain. Each trader must make trading decisions for his or her own account, and take responsibility for the consequences.

License
Creative Commons License

All content on Tim Bovee, Private Trader by Timothy K. Bovee is licensed under a Creative Commons Attribution-ShareAlike 4.0 International License.

Based on a work at www.timbovee.com.
Trader’s Notebook

3:30 p.m. New York time

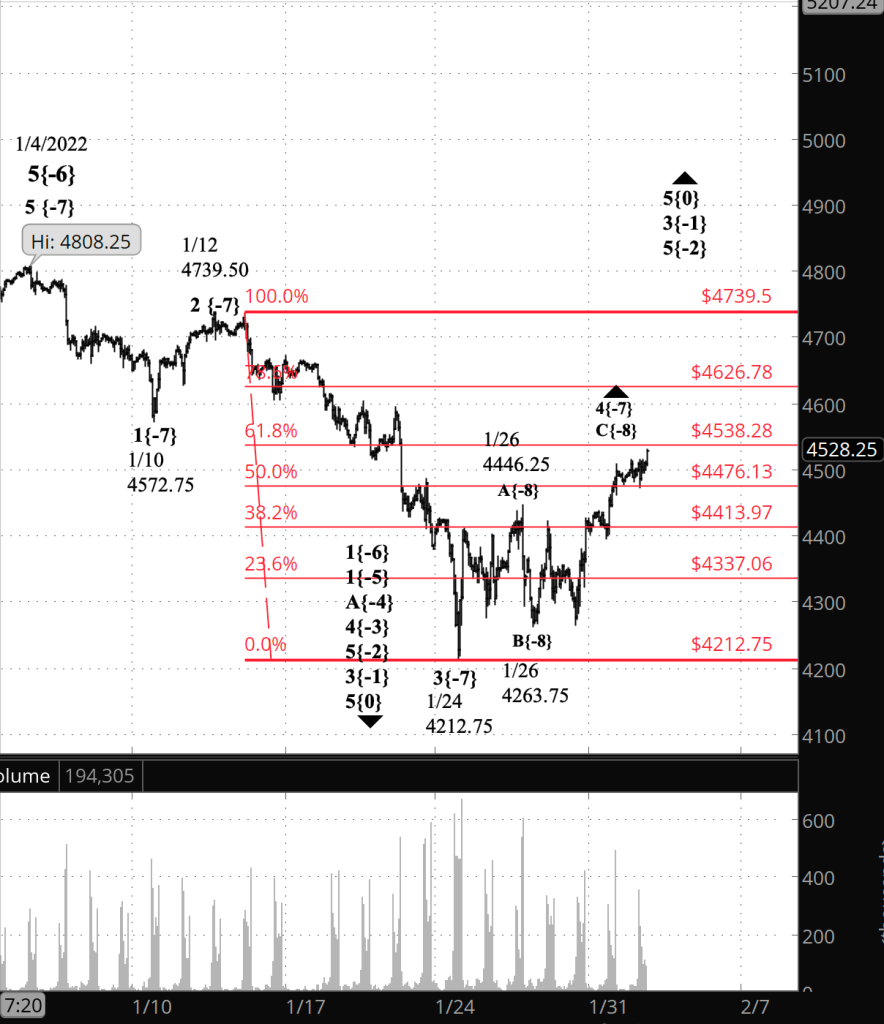
Half an hour before the closing bell. The S&P 500 futures rose during the session, approaching to within 53 points of the highest point this 4th wave upward correction can reach without violating the rules of Elliott wave analysis. As I put it in my cheatsheet: “If the wave moves beyond the end of wave 1, then it’s not wave 4”. No change in the analysis. I’ve updated the chart.

3:15 p.m. New York time

SPY options spread entry. I’ve entered a short bear call options spread on SPY, based on Elliott wave analysis, in an attempt to capture the 5th wave decline that will follow the end of the present 4th wave correction to the upside. I’ve posted an analysis of the trade.

2:25 p.m. New York time

UNP earnings play exit. I’ve exited my short iron condor spread on UNP for an 8.2% return and have updated the trade analysis with full results.

2 p.m. New York time

XOM earnings play exit. I’ve exited my short bull put spread on XOM for a 44.1% return and have updated the trade analysis with full results.

1:45 p.m. New York time

C earnings play exit. I’ve exited my short iron condor spread on C for a 40% return and have updated the trade analysis with full results.

1:15 p.m. New York time

GM earnings play entry. I’ve entered a short bull put options spread on GM timed to coincide with the company’s earnings announcement after the closing bell today. I’ve posted an analysis of the trade.

9:35 a.m. New York time

What’s happening now? The S&P 500 E-mini futures traded sideways overnight in the space between the 50% and 61.8% Fibonacci retracement levels.

What does it mean? The upward correction that began on January 24 is nearing an end. It may well rise further but will remain below 2572.75. It will be followed by a resumption of the downtrend that began on January 4.

What are the alternatives? There are 2. Both rely on the chart being analyzed as showing that the corrective pattern is complete.

  1. The downtrend following the correction is taking the first tentative steps of its resumption.
  2. The downtrend within the correction is the beginning of will be followed by a second corrective pattern in a complex correction.
[S&P 500 E-mini futures at 3:30 p.m., 70-minute bars, with volume]

What does Elliott wave theory say? Wave 5{-9} within rising wave C{-8} is underway, as the parent wave 4{-7} nears it’s end. Under the rules of Elliott wave analysis, a rising 4th wave must remain below the end of the preceding 1st wave. Wave 1{-7} ended on January 10 at 4572.75. Wave 5{-9} has almost reached its end but could rise a bit more, perhaps to the 61.8% retracement level, 4538.28, which is 35 points below the end of wave 1{-7} and so is within the rules.

Under the first alternative, wave C{-8} is complete, along with its parent, wave 4{-7}. Downtrending wave 5{-7} has begun and will carry the price below 4212.75, the end of wave 3{-7}.

Under the second alternative, wave C{-8} is complete and will be followed by downward wave X{-8}, which marks the end of the first corrective pattern and the beginning of a second corrective pattern within a compound structure. Wave X will remain above 4212.75.

We Are Here.

These are the wave currently in progress. Each line on the list shows the wave number, with the subscript in curly brackets, the traditional degree name, the starting date, the starting price of the S&P 500 E-mini futures, and the direction of the wave.

  • 5{0} Intermediate, 12/21/2018, 2316.75 (up)
  • 3{1} Minor, 3/23/2018 2174 (up)
  • 5{-2} Minute, 10/4/2020, 4267.50 (up)
  • 4{-3} Minuette, 1/4/2022, 4808.25 (down)
  • A{-4} Subminuette, 1/4/2022, 4808.25 (down)
  • 1{-5} Micro, 1/4/2022, 4808.25 (down)
  • 1{-6} Submicro, 1/4/2022, 4808.25 (down)
  • 4{-7} Minuscule, 1/24/2022, 4212.75 (up)
  • C{-8} Subminuscule, 1/26/2022, 4263.75 (up)

Learning and other resources. Elliott wave analysis provides context, not prophecy. As the 20th century semanticist Alfred Korzybski put it this way in his book Science and Sanity (1933), “The map is not the territory … The only usefulness of a map depends on similarity of structure between the empirical world and the map.” And I would add, in the ever-changing markets, we can judge that similarity of structure only after the fact.

See the menu page Analytical Methods for a rundown on where to go for information on Elliott wave analysis.

By Tim Bovee, Portland, Oregon, February 1, 2022

Disclaimer

Tim Bovee, Private Trader tracks the analysis and trades of a private trader for his own accounts. Nothing in this blog constitutes a recommendation to buy or sell stocks, options or any other financial instrument. The only purpose of this blog is to provide education and entertainment.

No trader is ever 100 percent successful in his or her trades. Trading in the stock and option markets is risky and uncertain. Each trader must make trading decisions for his or her own account, and take responsibility for the consequences.

License
Creative Commons License

All content on Tim Bovee, Private Trader by Timothy K. Bovee is licensed under a Creative Commons Attribution-ShareAlike 4.0 International License.

Based on a work at www.timbovee.com.
XOM Trade

Exxon Mobil Corp. (XOM)

Update 2/1/2022: I exited my short bull put spread position on XOM, 45 days before expiration, for a $0.93 debit per contract/share, a profit before fees of $41.00 per contract. Shares were trading at $77.59, up $2.22 from the entry level.

The Implied Volatility Rank at exit was 29.3%, down 9 points from the entry level.

I exited because the position exceeded 25% of maximum potential profit, my normal exit point for earnings plays.

Shares rose by 2.9% in one day for a +1,075% annual rate. The options position produced a 44.1% return for a +16,091% annual rate.


I have entered a short bull put vertical spread on XOM, using options that trade for the last time 46 days hence, on March 18. The premium is a $1.34 credit per contract share and the stock at the time of entry was priced at $75.37.

The Implied Volatility Ratio stood at 38.3%.

Premium:$1.34Expire OTM
XOM-bull put spreadStrikeOddsDelta
Puts
Long67.5078.0%18
Break-even73.8468.5%26.5
Short72.5059.0%35

The premium is 53.6% of the width of the positions short/long spread. The profit zone covers a 2% move to the downside and an unlimited move to the upside.

The risk/reward ratio is 2.7:1, with maximum risk of $366 and maximum reward of $134 per contract.

How I chose the trade. The trade was placed to coincide with XOM’S earnings announcement, before the opening bell on the day of entry. The short strikes were set to coincide with the expected move of $2.06 either way, based on options pricing, which gives a price range of $73.22 to $77.34.

By Tim Bovee, Portland, Oregon, January 31, 2022

Disclaimer

Tim Bovee, Private Trader tracks the analysis and trades of a private trader for his own accounts. Nothing in this blog constitutes a recommendation to buy or sell stocks, options or any other financial instrument. The only purpose of this blog is to provide education and entertainment.

No trader is ever 100 percent successful in his or her trades. Trading in the stock and option markets is risky and uncertain. Each trader must make trading decisions for his or her own account, and take responsibility for the consequences.

License
Creative Commons License

All content on Tim Bovee, Private Trader by Timothy K. Bovee is licensed under a Creative Commons Attribution-ShareAlike 4.0 International License.

Based on a work at www.timbovee.com.

Trader’s Notebook

3:30 p.m. New York time

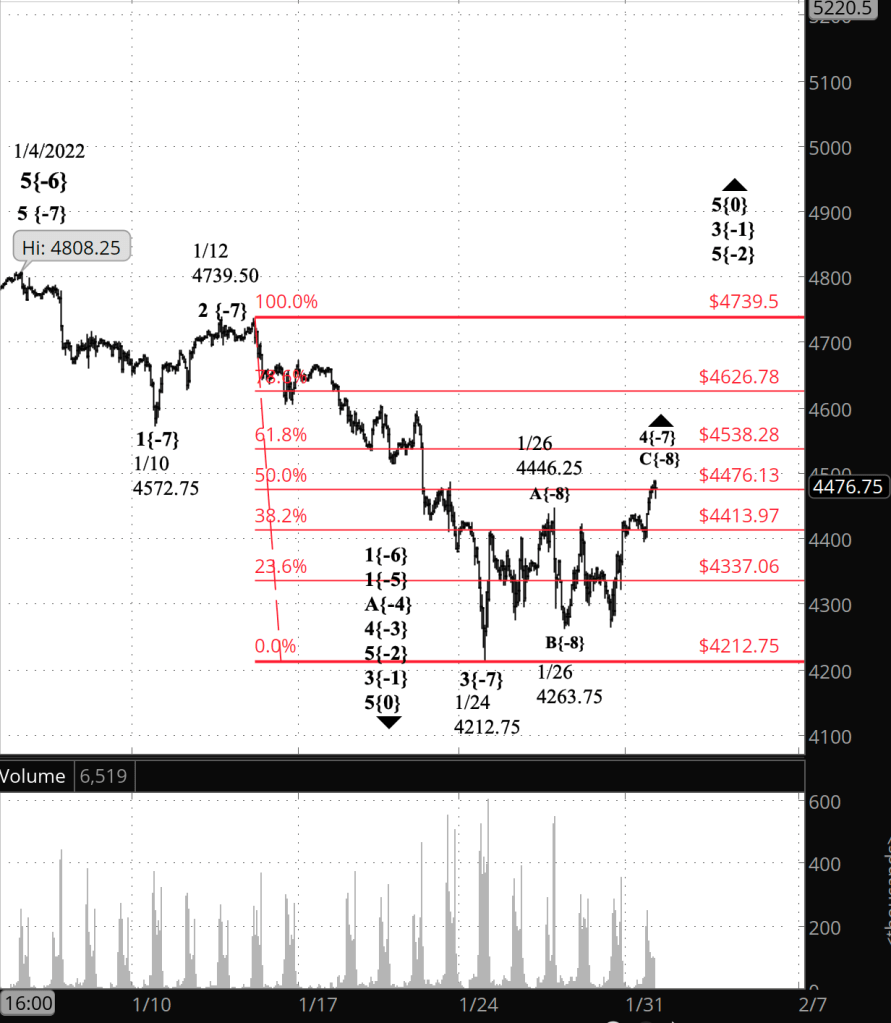
Half an hour before the closing bell. The S&P 500 futures pushed up to the 50% retracement level and again paused. The upward movement invalidates my first alternative from this morning, that the retracement had ended overnight. The present high of the session meets all of the requirements for completing the wave 4{-7}, the upward correction that began January 24. Under the rules of Elliott wave analysis, it could still rise further, but it must remain below the end of the preceding 1st wave, 4572.75. No change in the principal analysis. I’ve updated the chart.

11:30 a.m. New York time

XOM earnings play entry. I’ve entered a short bull put options vertical spread on XOM, timed to coincide with the company’s earnings announcement tomorrow before the opening bell. I’ve posted an analysis of the trade.

9:35 a.m. New York time

What’s happening now? The S&P 500 E-mini futures traded within a narrow range in overnight trading, staying close to the 38.2% Fibonacci retracement level.

What does it mean? The correction that began on January 24 continues and is now in its 4th leg within a five-leg pattern.

What are the alternatives? There are two, unchanged from Friday’s Notebook.

Alternative #1: It’s possible that the correction ended at the overnight peak. The internal structure of the rise to that high doesn’t appear to support such a reading of the chart. However, I can’t rule it out entirely.

Alternative #2: Corrections come with three waves internally, and this correction is now in its 3rd wave. However, it’s possible that the present correction will form a compound structure, with two corrective patterns connected by an intervening decline and rise.

[S&P 500 E-mini futures at 3:30 p.m., hourly bars, with volume]

What does Elliott wave theory say? Over the weekend I did an inventory of the Elliott waves I’ve identified within wave 5{0} — the Intermediate degree in the traditional naming — which began on December 21, 2018 from 2316.75 on the futures. In doing so I identified a few long-ago inelegancies enabled me to improve the count. As a result of that work, I’ve changed the degree level of the present-day chart, raising the degrees up three levels. What was wave C{-11} on Friday’s chart is now wave C{-8} on today’s chart, and other waves have had a corresponding adjustment.

Nothing significant has changed. The chart still shows us at the same place as Friday’s chart did; only the degree labelling has changed.

And so, wave C{-8} within wave 4{-7}, an upward correction, continues its rise. Overnight it stalled in a brief sideways correction — wave 4{-9} — and I expect it to follow with a final upward movement, wave 5{-9}.

The first alternative — that wave 4{-7} is complete — will be invalidated by a further rise. The second alternative — that wave 4{-7} will form a compound structure of two corrective patterns — will remain a possibility until the price falls below the beginning of wave 4{-7}, which is 4212.75.

The end of wave 4{-7} will be followed by a resumption of the downtrend that began on January 4 from 4808.25. Wave 5{-7} will stretch below 4212.75, perhaps significantly so. It’s end will also mark the end of its parent wave 1{-6}, which also began on January 4.

The We Are Here list. As part of my weekend work, I’ve built a list of waves that shows where we are at present with the S&P 500, from the lowly wave C{-8} corrective component, which is now in its 5th day. all the way up wave 5{0} itself, which has been with us for more than three years.

Each line on the list shows the wave number, with the subscript in curly brackets, the traditional degree name, the starting date, the starting price of the S&P 500 E-mini futures, and the direction of the wave.

We Are Here

  • 5{0} Intermediate, 12/21/2018, 2316.75 (up)
  • 3{1} Minor, 3/23/2018 2174 (up)
  • 5{-2} Minute, 10/4/2020, 4267.50 (up)
  • 4{-3} Minuette, 1/4/2022, 4808.25 (down)
  • A{-4} Subminuette, 1/4/2022, 4808.25 (down)
  • 1{-5} Micro, 1/4/2022, 4808.25 (down)
  • 1{-6} Submicro, 1/4/2022, 4808.25 (down)
  • 4{-7} Minuscule, 1/24/2022, 4212.75 (up)
  • C{-8} Subminuscule, 1/26/2022, 4263.75 (up)

Learning and other resources. Elliott wave analysis provides context, not prophecy. As the 20th century semanticist Alfred Korzybski put it this way in his book Science and Sanity (1933), “The map is not the territory … The only usefulness of a map depends on similarity of structure between the empirical world and the map.” And I would add, in the ever-changing markets, we can judge that similarity of structure only after the fact.

See the menu page Analytical Methods for a rundown on where to go for information on Elliott wave analysis.

By Tim Bovee, Portland, Oregon, January 31, 2022

Disclaimer

Tim Bovee, Private Trader tracks the analysis and trades of a private trader for his own accounts. Nothing in this blog constitutes a recommendation to buy or sell stocks, options or any other financial instrument. The only purpose of this blog is to provide education and entertainment.

No trader is ever 100 percent successful in his or her trades. Trading in the stock and option markets is risky and uncertain. Each trader must make trading decisions for his or her own account, and take responsibility for the consequences.

License
Creative Commons License

All content on Tim Bovee, Private Trader by Timothy K. Bovee is licensed under a Creative Commons Attribution-ShareAlike 4.0 International License.

Based on a work at www.timbovee.com.

Trader’s Notebook

3:30 p.m. New York time

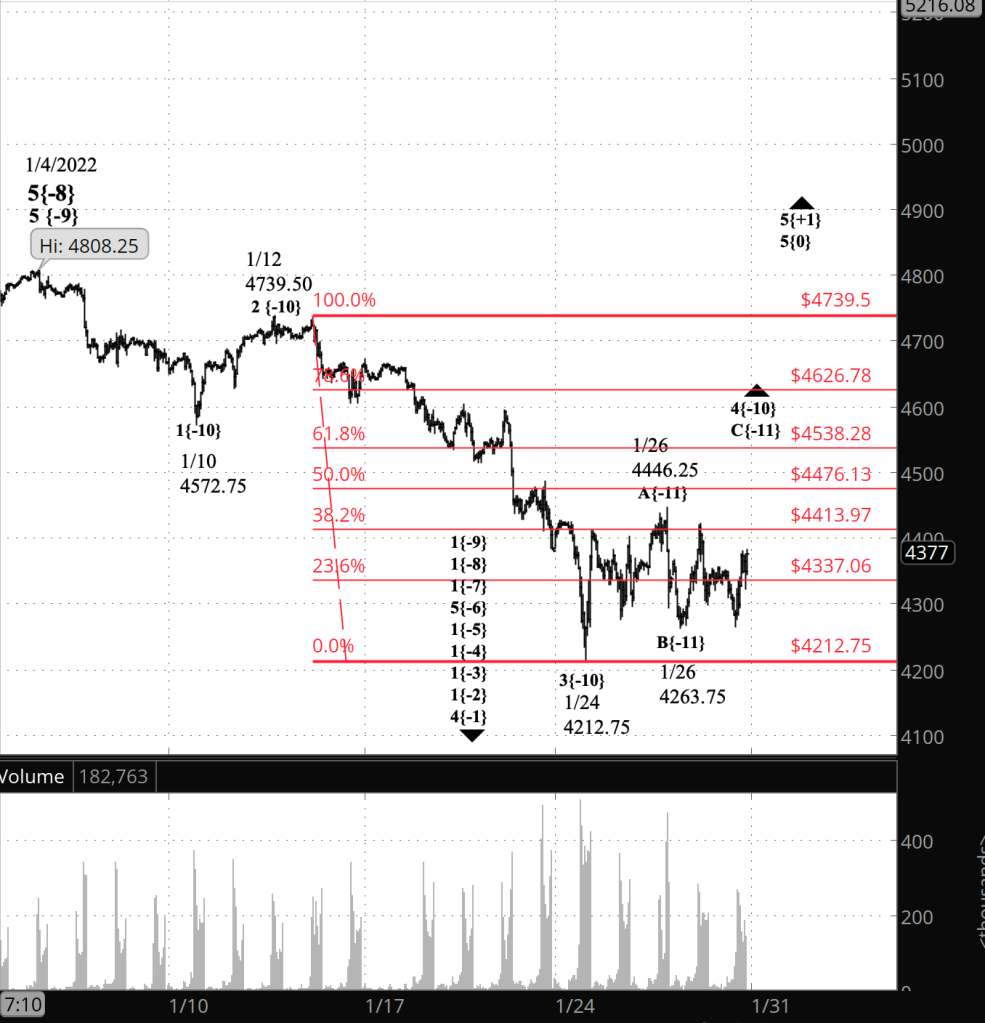
Half an hour before the closing bell. The S&P 500 futures spent the day crossing and recrossing the 23.6% retracement level. Just as a rough guess, based on several waves that don’t really go anywhere, each with three internal waves, wave C{-11} might well be taking the form of a Triangle, perhaps a Descending Triangle (flat lower boundary and descending upper boundary). At this point, though, it’s quite ambiguous, and I’m not proposing it as my principal analysis, which is unchanged this afternoon. I’ve updated the chart.

11:20 a.m. New York time

AAPL earnings play exit. I’ve exited my short bull put options spread on AAPL the day after entering the position as an earnings play. The return was 32.5%. I’ve updated the trade analysis with the result.

9:35 a.m. New York time

What’s happening now? The S&P 500 E-mini futures again declined below the 23.6% Fibonacci retracement level, with the overnight low, 4266.25, coming with 54 points of the January 24 low. The price then rose slightly as the opening bell approached.

What does it mean? The upward correction that began on January 24 from 4212.75 is still underway and is now in its 3rd and possibly final leg.

What are the alternatives? There are two.

Alternative #1: It’s possible that yesterday’s high just above the 38.2% Fibonacci retracement was the end of the correction, although the internal structure of the rise to that high point doesn’t appear to support such a reading of the chart with a great degree of clarity. Nonetheless, it’s conceivable.

Alternative #2: Although corrections come with three waves internally, there are variations. It’s possible that the present correction will form a compound structure, attaching a second corrective pattern to the first.

[S&P 500 E-mini futures at 3:30 p.m., 55-minute bars, with volume]

What does Elliott wave theory say? Under the principal analysis rising wave C{-11} within the upward wave 4{-10} correction is still underway.

Alternative #1: C waves in a Flat — the pattern of the present correction — have five waves internally. I can only count three in wave C{-11}, with a very minuscule correction in the middle. Nonetheless, if I squint real hard, it can be counted as five waves.

Alternative #2: If the wave 4{-10} correction expands into a complex pattern, then wave C{-11} will be followed by an X-wave, which will connect the two patterns, and then by a second corrective pattern.

Learning and other resources. Elliott wave analysis provides context, not prophecy. As the 20th century semanticist Alfred Korzybski put it this way in his book Science and Sanity (1933), “The map is not the territory … The only usefulness of a map depends on similarity of structure between the empirical world and the map.” And I would add, in the ever-changing markets, we can judge that similarity of structure only after the fact.

See the menu page Analytical Methods for a rundown on where to go for information on Elliott wave analysis.

By Tim Bovee, Portland, Oregon, January 28, 2022

Disclaimer

Tim Bovee, Private Trader tracks the analysis and trades of a private trader for his own accounts. Nothing in this blog constitutes a recommendation to buy or sell stocks, options or any other financial instrument. The only purpose of this blog is to provide education and entertainment.

No trader is ever 100 percent successful in his or her trades. Trading in the stock and option markets is risky and uncertain. Each trader must make trading decisions for his or her own account, and take responsibility for the consequences.

License
Creative Commons License

All content on Tim Bovee, Private Trader by Timothy K. Bovee is licensed under a Creative Commons Attribution-ShareAlike 4.0 International License.

Based on a work at www.timbovee.com.

AAPL Trade

Apple Inc. (AAPL)

Update 1/28/2022: I exited my short bull put spread earnings play on AAPL 49 days before expiration, for a $0.80 debit per contract/share, a profit before fees of $26 per contract. Shares were trading at $166.78, up $4.28 from the entry level.

The Implied Volatility Rank at exit was 54.7%, down 9.4 points from the entry level.

I exited because the position reached 25% of maximum potential profit, my normal exit point for earnings plays.

Shares rose by 2.6% over one day for a +961% annual rate. The options position produced a 32.5% return for a +11,863% annual rate.


I have entered a short bull put options spread on AAPL, using options that trade for the last time 50 days hence, on March 18. The premium is a $1.06 credit per contract share and the stock at the time of entry was priced at $162.50.

The Implied Volatility Ratio stood at 64.1%.

Premium:$1.06Expire OTM
AAPL-bull put spreadStrikeOddsDelta
Puts
Long145.0070.0%25
Break-even151.0666.5%28.5
Short150.0063.0%32

The premium is 42.4% of the width of the positions short/long spread. The profit zone covers a 7% move to the downside and an unlimited move to the upside.

The risk/reward ratio is 3.7:1, with maximum risk of $394 and maximum reward of $106 per contract.

How I chose the trade. The trade was placed to coincide with LVS’s earnings announcement, after the closing bell on the day of entry. The short strikes were set to coincide with the expected move of $5.53 either way, based on options pricing, which gives a price range of $156.97 to $168.03.

By Tim Bovee, Portland, Oregon, January 27, 2022

Disclaimer

Tim Bovee, Private Trader tracks the analysis and trades of a private trader for his own accounts. Nothing in this blog constitutes a recommendation to buy or sell stocks, options or any other financial instrument. The only purpose of this blog is to provide education and entertainment.

No trader is ever 100 percent successful in his or her trades. Trading in the stock and option markets is risky and uncertain. Each trader must make trading decisions for his or her own account, and take responsibility for the consequences.

License
Creative Commons License

All content on Tim Bovee, Private Trader by Timothy K. Bovee is licensed under a Creative Commons Attribution-ShareAlike 4.0 International License.

Based on a work at www.timbovee.com.

Trader’s Notebook

3:30 p.m. New York time

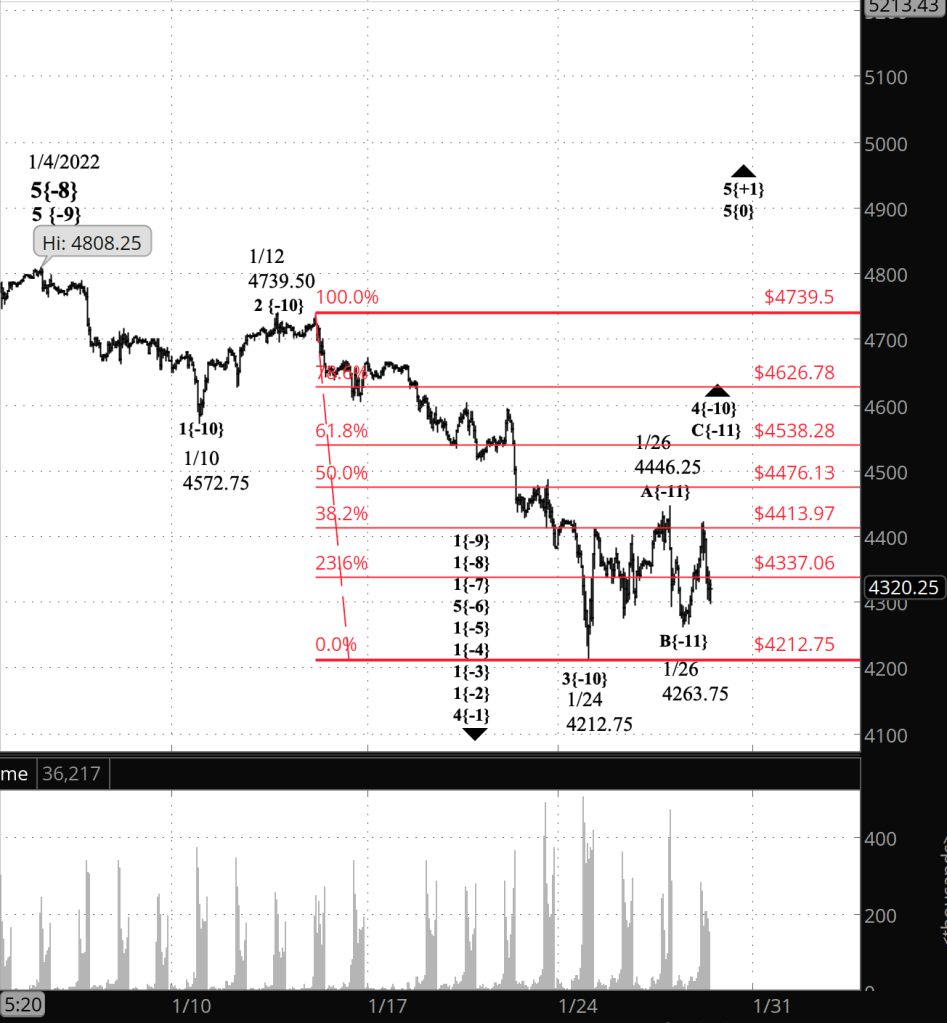
Half an hour before the closing bell. The S&P 500 futures spent much of the day at or below the 23.6% Fibonacci retracement level. Wave C{-11} within an upward correction, wave 4{-10} appears to still be underway. However, the first alternative — wave B{-11} is still underway — deserves consideration as long as the price is stalled well below the January 26 peak, 4446.25. No change in the analysis. I’ve updated the chart.

2:15 p.m. New York time

Earnings play entry, AAPL. I’ve entered a bull put options spread on AAPL, timed to coincide with the company’s earnings announcement after the closing bell today and have posted an analysis of the trade.

9:35 a.m. New York time

What’s happening now? The S&P 500 E-mini futures fell to 4263.25, 50 points above the January 24 low, and then reversed, rising more than 100 points.

What does it mean? The upward correction that began on January 24 continues. The overnight low was the middle leg of the correction, a retracement to the downside, and the subsequent rise is the final leg of the correction.

What are the alternatives? There are two:

Alternative #1: Yesterday’s high, 4446.25, marked the end of the upward correction, the subsequent decline is a resumption of the downtrend and the overnight rise is a low-level correction within the downtrend.

Alternative #2: The overnight rise is a continuation of the middle leg of the correction.

[S&P 500 E-mini futures at 3:30 p.m., 55-minute bars, with volume]

What does Elliott wave theory say? The upward correction that began on January 24 is wave 4{-10} — on that both the principal analysis and the alternatives agree. The disagreement is about the waves within that wave.

Principal analysis: Wave B{-11} ended with the overnight low and the subsequent rise is wave C{-11}, the final wave within wave 4{-10}, unless it forms a compound structure, a not uncommon occurrence in 4th waves.

Alternative #1: Wave 4{-10} ended with yesterday’s high, the subsequent decline is wave 1{-11} within wave 5{-10}, a resumption of the downtrend, and the rise that followed is wave 2{-11}, an upward correction.

Alternative #2: Wave B{-11} within wave 4{-10} is still underway.

If the price remains above the January 24 low, 4212.75, then either the principal analysis or the second alternative is correct. If the price falls below 4212.75, then the first alternative is correct.

Learning and other resources. Elliott wave analysis provides context, not prophecy. As the 20th century semanticist Alfred Korzybski put it this way in his book Science and Sanity (1933), “The map is not the territory … The only usefulness of a map depends on similarity of structure between the empirical world and the map.” And I would add, in the ever-changing markets, we can judge that similarity of structure only after the fact.

See the menu page Analytical Methods for a rundown on where to go for information on Elliott wave analysis.

By Tim Bovee, Portland, Oregon, January 27d, 2022

Disclaimer

Tim Bovee, Private Trader tracks the analysis and trades of a private trader for his own accounts. Nothing in this blog constitutes a recommendation to buy or sell stocks, options or any other financial instrument. The only purpose of this blog is to provide education and entertainment.

No trader is ever 100 percent successful in his or her trades. Trading in the stock and option markets is risky and uncertain. Each trader must make trading decisions for his or her own account, and take responsibility for the consequences.

License
Creative Commons License

All content on Tim Bovee, Private Trader by Timothy K. Bovee is licensed under a Creative Commons Attribution-ShareAlike 4.0 International License.

Based on a work at www.timbovee.com.

LVS Trade

Las Vegas Sands Corp. (LVS)

Update 2/25/2022: I exited my bull put vertical options spread on LVS, 21 days before expiration, for a $1.08 debit per contract/share, a profit before fees of $11 per contract. Shares were trading at $43.07, down $2.06 from the entry level.

The Implied Volatility Rank at exit was 59.1%, down 7.7 points from the entry level.

I exited because the position was within 21 days of expiration, with the exit price producing 9.2% of maximum potential profit. Under my rules for earnings plays, I exit at 25% of maximum potential profit up to 21 days prior to expiration. At that point, I exit for any amount of profit that will cover my fees.

Shares declined by 4.8% over 30 days for a -58% annual rate. The options position produced a 10.2% return for a +124% annual rate.


I have entered a short bull put options spread on LVS, using options that trade for the last time 51 days hence, on March 18. The premium is a $1.19 credit per contract share and the stock at the time of entry was priced at $45.23.

The Implied Volatility Ratio stands at 66.8%

Premium:$1.19Expire OTM
LVS-bull spreadStrikeOddsDelta
Puts
Long37.0080.0%16
Break-even43.1970.5%24.5
Short42.0061.0%33

The premium is 47.6% of the width of the positions short/long spread. The profit zone covers a 4.5% move to the downside and an unlimited move to the upside.

The risk/reward ratio is 3.2:1, with maximum risk of $381 and maximum reward of $119 per contract.

How I chose the trade. The trade was placed to coincide with LVS’s earnings announcement, after the closing bell on the day of entry. The short strikes were set to coincided with the expected move of $2.00 either way, based on options pricing, which gives a price range of $43.24 to $47.23.

By Tim Bovee, Portland, Oregon, January 26, 2022

Disclaimer

Tim Bovee, Private Trader tracks the analysis and trades of a private trader for his own accounts. Nothing in this blog constitutes a recommendation to buy or sell stocks, options or any other financial instrument. The only purpose of this blog is to provide education and entertainment.

No trader is ever 100 percent successful in his or her trades. Trading in the stock and option markets is risky and uncertain. Each trader must make trading decisions for his or her own account, and take responsibility for the consequences.

License
Creative Commons License

All content on Tim Bovee, Private Trader by Timothy K. Bovee is licensed under a Creative Commons Attribution-ShareAlike 4.0 International License.

Based on a work at www.timbovee.com.