Trader’s Notebook

3:30 p.m. New York time

Half an hour before the closing bell. The S&P 500 began to fall during the trading session, about 10 minutes after Federal Reserve Chair Powell began his news conference. The Fed’s Federal Open Markets Committee today declined to raise interest rates in response to higher inflation.

The futures fell from the 38.2% Fibonacci retracement level, where they had lingered during the early hours of the session, to below 23.6% Fibonacci retracement level. As a best guess, the peak at the 38.2% retracement looks like the end of wave A{-11} and the subsequent decline as wave B{-11}, all within the upward correction, wave 4{-9}.

It is a rule of Elliott wave analysis that a B wave cannot move beyond the start of the preceding wave A, which sets a lower boundary of 4212.75 or above.s

No change in the analysis. I’ve updated the chart.

2:45 p.m. New York time

LVS earnings play entry. I’ve entered a long bull put options spread on LVS, timed to coincide with the company’s earnings announcement after the closing bell. I’ve posted an analysis of the trade.

11:55 a.m. New York time

BA earnings play exit. I’ve exited my short bear call options spread on BA, one day after entry, for a 33.5% profit. I’ve updated the analysis with details of the exit.

9:35 a.m. New York time

What’s happening now? The S&P 500 E-mini futures barely moved in overnight trading, remaining at a 38.2% retracement of the preceding 12-day decline.

What does it mean? The upward correction that began on January 24 is still underway. It is happening within the early states of a larger downtrend that began on January 4 and will last for months and probably years.

What’s the alternative? The decline from January 4 is a downward correction within a larger uptrend that began on February 23, 2020, at the end of the market crash early in the pandemic.
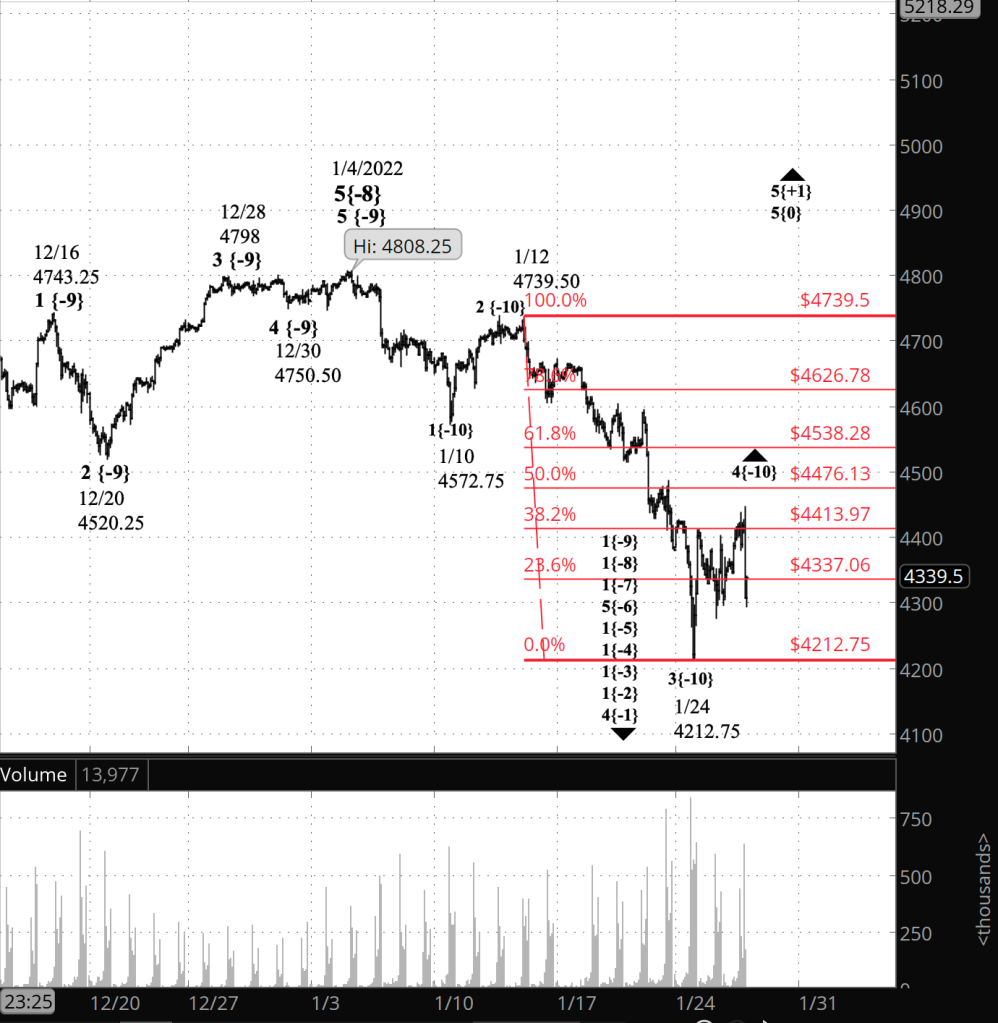
[S&P 500 E-mini futures at 3:30 p.m., 85-minute bars, with volume]

What does Elliott wave theory say? Under my principal analysis, January 24 marked the end of wave 3{-10} within a series of 1st waves of increasingly larger degree. It is a new downtrend that eventually will reach below 2000.

The preceding uptrend ended on January 4 at 4808.25. Wave 3{-10} has been followed present upward correction, wave 4{-10}. Internally, it looks as though wave C{-11} is now underway, although this early in the correction it’s hard to accurately judge the degrees of internal waves. This is all happening within downtrending wave 1{-9 } within downtrending wave 1{-8}, which both began on January 4.

Under the rules of Elliott wave analysis, a 4th wave must remain below the end of the preceding 1st wave. In this case, wave 1{-10} ended on January 10 at 4572.75 and wave 4{-10} cannot move above that price.

Under my secondary analysis, the January 4 peak was a stopping point within a still ongoing wave 5{-8} and larger uptrending waves. The subsequent decline at lower degrees, which the S&P 500 is still in today, is a correction that in fact may have ended on January 24. Under this scenario, the subsequent rise — small so far — is the early portion of a resumption of the uptrend and will exceed 4808.25.

Learning and other resources. Elliott wave analysis provides context, not prophecy. As the 20th century semanticist Alfred Korzybski put it this way in his book Science and Sanity (1933), “The map is not the territory … The only usefulness of a map depends on similarity of structure between the empirical world and the map.” And I would add, in the ever-changing markets, we can judge that similarity of structure only after the fact.

See the menu page Analytical Methods for a rundown on where to go for information on Elliott wave analysis.

By Tim Bovee, Portland, Oregon, January 26, 2022

Disclaimer

Tim Bovee, Private Trader tracks the analysis and trades of a private trader for his own accounts. Nothing in this blog constitutes a recommendation to buy or sell stocks, options or any other financial instrument. The only purpose of this blog is to provide education and entertainment.

No trader is ever 100 percent successful in his or her trades. Trading in the stock and option markets is risky and uncertain. Each trader must make trading decisions for his or her own account, and take responsibility for the consequences.

License
Creative Commons License

All content on Tim Bovee, Private Trader by Timothy K. Bovee is licensed under a Creative Commons Attribution-ShareAlike 4.0 International License.

Based on a work at www.timbovee.com.
BA Trade

The Boeing Co. (BA)

Update 1/26/2022: I exited my short bear call spread position on BA 51 days before expiration, for a $2.12 debit per contract/share, a profit before fees of $71 per contract. Shares were trading at $195.93, down $4.59 from the entry level.

The Implied Volatility Rank at exit was 66.3%, down 10.5 points from the entry level.

I exited because the position reached 25% of maximum potential profit, my normal exit point for earnings plays.

Shares declined by 2.3% over one day for a +836% annual rate. The options position produced a 33.5% return for a +12,224% annual rate.


I have entered a short bear call options spread on BA, using options that trade for the last time 52 days hence, on March 18. The premium is a $2.83 credit per contract share and the stock at the time of entry was priced at $200.52.

The Implied Volatility Ratio stands at 85.6%

Premium:$2.83Expire OTM
BA-bear call spreadStrikeOddsDelta
Calls
Long225.0079.0%27
Break-even217.8374.0%32
Short215.0069.0%37

The premium is 56.8% of the width of the positions short/long spread. The profit zone covers an 8.6% move to the upside and an unlimited move to the downside.

The risk/reward ratio is 2.5:1, with maximum risk of $717 and maximum reward of $283 per contract.

How I chose the trade. The trade was placed to coincide with BA’s earnings announcement, before the opening bell on the day after entry. The short strike was set to coincide with the expected move of $9.50 either way, based on options pricing, which gives a price range of $191.02 to $210.02.

By Tim Bovee, Portland, Oregon, January 25, 2022

Disclaimer

Tim Bovee, Private Trader tracks the analysis and trades of a private trader for his own accounts. Nothing in this blog constitutes a recommendation to buy or sell stocks, options or any other financial instrument. The only purpose of this blog is to provide education and entertainment.

No trader is ever 100 percent successful in his or her trades. Trading in the stock and option markets is risky and uncertain. Each trader must make trading decisions for his or her own account, and take responsibility for the consequences.

License
Creative Commons License

All content on Tim Bovee, Private Trader by Timothy K. Bovee is licensed under a Creative Commons Attribution-ShareAlike 4.0 International License.

Based on a work at www.timbovee.com.
Trader’s Notebook

3:30 p.m. New York time

Half an hour before the closing bell. The S&P 500 declined during the session, with the futures remaining more than 50 points above yesterday’s low, and then rose again, remaining below the overnight high. Wave 4{-9}, an upward correction, as been underway since yesterday, and the wave pattern is consistent with an A wave within wave 4{-9}. No change in the analysis. I’ve updated the chart.

11:10 a.m. New York time

BA earnings play entry. I’ve entered a short bear call options spread on BA, whose earnings will be announced Wednesday, January 26, before the opening bell. I’ve posted an analysis of the trade.

10:50 a.m. New York time

GE earnings play exit. I exited my short bear call options spread on GE the day after entering for a 74.4% profit, as shares fell sharply after earnings were announced. I’ve updated the analysis with details of the exit.

9:35 a.m. New York time

What’s happening now? The S&P 500 E-mini futures rose in overnight trading, retracing 38.2% of the decline from January 12.

What does it mean? An upward correction of that decline is now underway. The 38.2% retracement is a Fibonacci level, a not uncommon turning point within corrections. I expect this correction to remain below 4572.75. More on that expectation in the Elliott wave section, below.

What are the alternatives? Alternative #1: The upward movement that began on January 24 is a lower level correction within the downtrend, rather than a correction at the level of the downtrend. That sounds obscure, but it’s not. A higher level correction will move higher and take more time to complete than will a lower level correction.

Alternative #2: The downward movement that began on January 4 is a correction within an ongoing uptrend. A move above 4572.75 will increase the odds of this scenario being correction, and a rise above 4808.25 will confirm it.

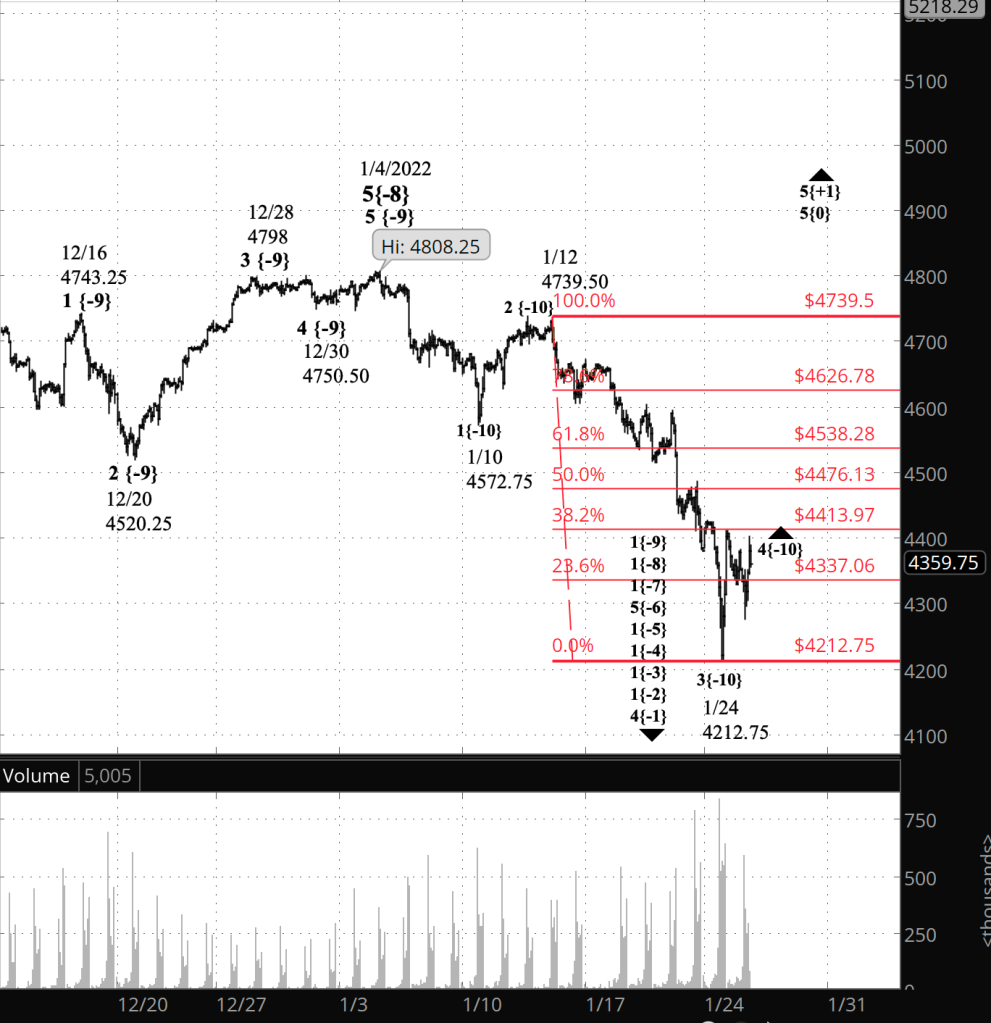
The chart. I’ve drawn a grid showing the Fibonacci retracement levels over the price chart, in red. See this Investopedia entry on Fibonacci levels for an explanation of what they are and how they relate to prices.

[S&P 500 E-mini futures at 3:30 p.m., 85-minute bars, with volume]

What does Elliott wave theory say? Under my principal analysis, wave 3{-10} within wave 1{-9} ended on January 24, at 4512.75, and the present rise is the early stage of wave 4{-10}. All of this is happening within wave 1{-8} a larger downtrend that began on January 4, the end of wave 5{-8} at 4808.25. Under the rules of Elliott wave analysis, 4th waves never move beyond the end of the preceding wave 1, which in this case ended on January 10 at 4572.75, slightly above the 61.8% retracement level. Given the tendency of corrections to fit within the structure of Fibonacci retracement levels, an upside target of 4538 — the 61.8% retracement — would be a reasonable expectation for the 4th wave’s ending point.

Fourth wave corrections tend to be of the Flat pattern, although not always. If this one is a Flat, then the A wave will have three subwaves, as will the B wave, and the C wave will have five subwaves.

Alternative #1 sees the present rise as an upward correction, but at a level below degree {-10}. A quick reversal to prices below 4512.75. would confirm this scenario.

Alternative #2 sees the January 24 low as the end of a correction within an ongoing uptrend, wave 5{-8}. A move above the January 4 high, 4808.25, would confirm this scenario.

Learning and other resources. Elliott wave analysis provides context, not prophecy. As the 20th century semanticist Alfred Korzybski put it this way in his book Science and Sanity (1933), “The map is not the territory … The only usefulness of a map depends on similarity of structure between the empirical world and the map.” And I would add, in the ever-changing markets, we can judge that similarity of structure only after the fact.

See the menu page Analytical Methods for a rundown on where to go for information on Elliott wave analysis.

By Tim Bovee, Portland, Oregon, January 25, 2022

Disclaimer

Tim Bovee, Private Trader tracks the analysis and trades of a private trader for his own accounts. Nothing in this blog constitutes a recommendation to buy or sell stocks, options or any other financial instrument. The only purpose of this blog is to provide education and entertainment.

No trader is ever 100 percent successful in his or her trades. Trading in the stock and option markets is risky and uncertain. Each trader must make trading decisions for his or her own account, and take responsibility for the consequences.

License
Creative Commons License

All content on Tim Bovee, Private Trader by Timothy K. Bovee is licensed under a Creative Commons Attribution-ShareAlike 4.0 International License.

Based on a work at www.timbovee.com.
GE Trade

General Electric Co. (GE)

Update 1/25/2022: I exited my short bear call options spread on GE 52 days before expiration, for a $1.25 debit per contract/share, a profit before fees of $93 per contract. Shares were trading at $89.19, down $4.87 from the entry level.

The Implied Volatility Rank at exit was 49.3%, down 6.6 points from the entry level.

The stock fell sharply after earnings were published, and I exited at 43% of maximum potential profit, well above my 25% goal for earnings plays.

Shares declined by 5.2% over one day for a 1,890% annual rate. The options position produced a 74.4% return for a 27,156% annual rate.


I have entered a short bear all spread on GE, using options that trade for the last time 53 days hence, on March 18. The premium is a $2.18 credit per contract share and the stock at the time of entry was priced at $94.06.

The Implied Volatility Ratio stands at 55.9%

Premium:$2.18Expire OTM
GE-bear spreadStrikeOddsDelta
Calls
Long110.0088.0%16
Break-even102.1878.5%26.5
Short100.0069.0%37

The premium is 43% of the width of the positions short/long spread. The profit zone covers a 7.8% move to the upside and an unlimited move to the downside.

The risk/reward ratio is 3.6:1, with maximum risk of $782 and maximum reward of $218 per contract.

How I chose the trade. The trade was placed to coincide with GE’s earnings announcement, before the opening bell on the day after. The short strikes were set to coincide with the expected move of $4.39 either way, based on options pricing, which gives a price range of $89.54 to 98.32. I chose a bearish position because recent analyst revisions have suggested the greater possibility of a negative earnings surprise.

By Tim Bovee, Portland, Oregon, January 24, 2022

Disclaimer

Tim Bovee, Private Trader tracks the analysis and trades of a private trader for his own accounts. Nothing in this blog constitutes a recommendation to buy or sell stocks, options or any other financial instrument. The only purpose of this blog is to provide education and entertainment.

No trader is ever 100 percent successful in his or her trades. Trading in the stock and option markets is risky and uncertain. Each trader must make trading decisions for his or her own account, and take responsibility for the consequences.

License
Creative Commons License

All content on Tim Bovee, Private Trader by Timothy K. Bovee is licensed under a Creative Commons Attribution-ShareAlike 4.0 International License.

Based on a work at www.timbovee.com.
Trader’s Notebook

3:30 p.m. New York time

Half an hour before the closing bell. The S&P 500 fell sharply for the first three hours of the trading session, reaching a low of 4212.75 on the futures, 4222.62 on the index, and then reversed, climbing more than 120 points. The decline, wave 3{-10}, has met the requirements set forth in Elliott wave theory, and so the rise could be the first steps of wave 4{-10}. I’m leaving the chart marked as wave 3 underway, as I analyzed it this morning, and will defer declaring wave 4 to have begun until I see a bit more upside and some internal wave patterns to confirm it. I’ve updated the chart.

1:35 p.m. New York time

A note on share positions. Every share of stock that I own is underwater, and I plan to exit some of them in order to lower my losses. Based on my principal analysis of the S&P 500 chart, my plan is to wait for the 2nd wave, wave 2{-9} to carry price up toward the January 4 high and exit there. Wave wave 4{-10} should be starting its upward correction movement soon, and it it goes high enough, then I’ll exit as close as I can get to that wave’s endpoint.

1:30 p.m. New York time

GE bear call spread earnings play. I’ve entered a short bear call spread on GE timed to coincide with Tuesday’s earnings announcement before the opening bell, and have posted an analysis.

1:15 p.m. New York time

ACI short iron condor partial exit. The short put on my ACI iron condor was in-the-money the day before the stock goes ex-dividend, and that created a risk that the puts would be assigned, dumping short shares into my account. To avoid assignment, I’ve exited my ACI puts, leaving the calls in place as a short bear call spread. I’ve updated the analysis with results of the puts exit.

9:35 a.m. New York time

What’s happening now? The S&P 500 E-mini futures declined into the low 4300s in overnight trading.

What does it mean? The downtrend that began on January 4 from 4808.25 is still in its first leg and eventually has much further to fall, with the decline being interrupted, as is usual in the markets, by the occasional upward correction. The next correction might well retrace much of the decline but will remain below the January 4 high.

What’s the alternative? The decline from January 4 is an exceptionally robust downward correction within a long-running uptrend. When the correction ends, the price will reverse to the upside and eventually will reach news highs above 4808.25.

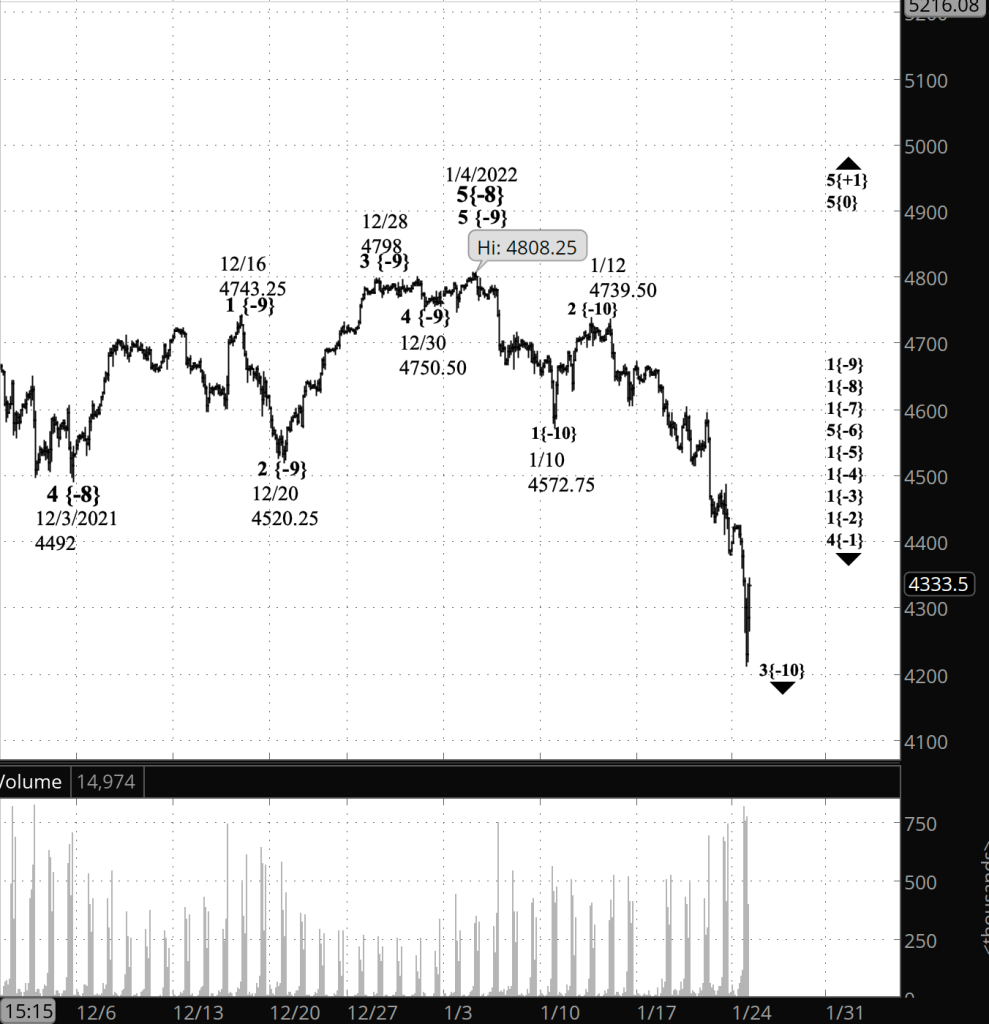
[S&P 500 E-mini futures at 3:30 p.m., 115-minute bars, with volume]

What does Elliott wave theory say? Under my principal analysis, which I consider to be by far the more likely scenario, the January 4 peak of wave 5{-8} has been followed by wave 1{-9} within wave 1{-8}. Internally, wave 1{-10} is in its 3rd wave, which reached 4311.50 before the opening bell.

Wave 1{-9} will be followed by an upward retracement, wave 2{-9}. Second waves often take back much of the previous decline and, typically, cause traders to question whether the downtrend is really underway. It’s a head-fake, and they become convinced of the downtrend only when the subsequent 3rd wave takes the prices still lower.

Under the alternative analysis, wave 5{-8} and larger 5th waves didn’t end on January 4, and the present decline is a downward correction that typically will consist of three waves.

The principal analysis will be proven wrong if the price breaks above 4808.25, the January 4 high. The alternative analysis will be proven wrong if the price remains below 4808.25 and reverses to lower lows.

Learning and other resources. Elliott wave analysis provides context, not prophecy. As the 20th century semanticist Alfred Korzybski put it this way in his book Science and Sanity (1933), “The map is not the territory … The only usefulness of a map depends on similarity of structure between the empirical world and the map.” And I would add, in the ever-changing markets, we can judge that similarity of structure only after the fact.

See the menu page Analytical Methods for a rundown on where to go for information on Elliott wave analysis.

By Tim Bovee, Portland, Oregon, January 24, 2022

Disclaimer

Tim Bovee, Private Trader tracks the analysis and trades of a private trader for his own accounts. Nothing in this blog constitutes a recommendation to buy or sell stocks, options or any other financial instrument. The only purpose of this blog is to provide education and entertainment.

No trader is ever 100 percent successful in his or her trades. Trading in the stock and option markets is risky and uncertain. Each trader must make trading decisions for his or her own account, and take responsibility for the consequences.

License
Creative Commons License

All content on Tim Bovee, Private Trader by Timothy K. Bovee is licensed under a Creative Commons Attribution-ShareAlike 4.0 International License.

Based on a work at www.timbovee.com.
HAL Trade

Halliburton Co. (HAL)

Update 3/16/2022: I exited my the put vertical spread within an iron condor on HAL, two days before expiration, for a $4.75 debit per contract/share, a loss before fees of $396 per contract. Shares were trading at $34.62, up $7.18 from the entry level.

The Implied Volatility Rank at exit was 66.6%, up 33.9 points from the entry level.

The call vertical spread within the iron condor is out of the money and can be expected to expire on Friday with no debit, for a profit before fees of $96 per contract share.

Assuming no debit on the calls, I expect the full iron condor to end with a $4.75 debit per contract share, a loss before fees of $300 per contract. I shall update the analysis after March 18 close with actual numbers.

I exited because the position is close to expiring and I wanted to avoid assignment, which would put shares of HAL in my account.

Assuming no debit on the calls, for the full iron condor shares rose by 26.2% over 54 days for a 177% annual rate. The options position produced a 63.2% loss for a -564% annual rate.


I have entered a short iron condor spread on HAL, using options that trade for the last time 56 days hence, on March 18. The premium is a $1.75 credit per contract share and the stock at the time of entry was priced at $27.44.

The Implied Volatility Ratio stands at 32.7%

Premium:$1.75Expire OTM
HAL-iron condorStrikeOddsDelta
Calls
Long34.0091.0%14
Break-even30.7578.5%28
Short29.0066.0%42
Puts
Short25.0066.0%27
Break-even21.7578.5%16.5
Long20.0091.0%6

The premium is 35% of the width of the position’s short and long spreads. The profit zone covers a 12.1% move to the upside and a 26.2 move to the downside.

The risk/reward ratio is 1.9:1, with maximum risk of $325 and maximum reward of $175 per contract.

How I chose the trade. The trade was placed to coincide with HAL’s earnings announcement, before the opening bell on January 24, after the weekend. The expected move was exceptionally narrow, at $0.36 either way, based on options pricing. So I went wider than the implied price range, $27.12 to $27.84.

By Tim Bovee, Portland, Oregon, January 21, 2022

Disclaimer

Tim Bovee, Private Trader tracks the analysis and trades of a private trader for his own accounts. Nothing in this blog constitutes a recommendation to buy or sell stocks, options or any other financial instrument. The only purpose of this blog is to provide education and entertainment.

No trader is ever 100 percent successful in his or her trades. Trading in the stock and option markets is risky and uncertain. Each trader must make trading decisions for his or her own account, and take responsibility for the consequences.

License
Creative Commons License

All content on Tim Bovee, Private Trader by Timothy K. Bovee is licensed under a Creative Commons Attribution-ShareAlike 4.0 International License.

Based on a work at www.timbovee.com.

Trader’s Notebook

3:30 p.m. New York time

Half an hour before the closing bell. The S&P 500 continued to fall during the day, with the futures reaching the 4380s and the index, the 4390s. Downtrending wave 1{-9} continues. No change to the analysis. I’ve updated both charts.

What comes next? Wave 1{-9} is late in the 3rd or possibly 5th wave internally, meaning that the end is in site. When 1{-9} is complete, it will be followed by a 2nd wave correction that typically will retrace much of the prior 1st wave, perhaps reaching back into the 4700s. That upward correction will be followed by a powerful downtrending wave 3{-9}, which will be a strong signal to traders that the bull years may have come to an end. The ensuing wave 4{-9} will typically be a largely sideways correction, and then wave 5{-9} will decline still further, completing the parent wave 1{-8}. After that, wave 2{-9} again carries the prices upward, most likely higher than they are now, before an even more power wave 3{-8} brings things crashing down.

11:15 a.m. New York time

HAL earnings play entry. I’ve opened a short iron condor options position on HAL in anticipation of its earnings announcement on Monday before the opening bell. I’ve posted an analysis of the trade.

10:55 a.m. New York time

MU earnings play exit. I exited a short iron condor options position on MU that I entered last December in two parts. The first came near the end of December, to avoid assignment of the in-the-money calls when the stock went ex-dividend. I held on to the puts, in the form of a bull put spread, until the last trading day. The put options at the last moment gained some value, raising the certain prospect of assignment, and I exited. I’ve updated the analysis with results for the remaining bull put spread and for the iron condor as a whole.

9:35 a.m. New York time

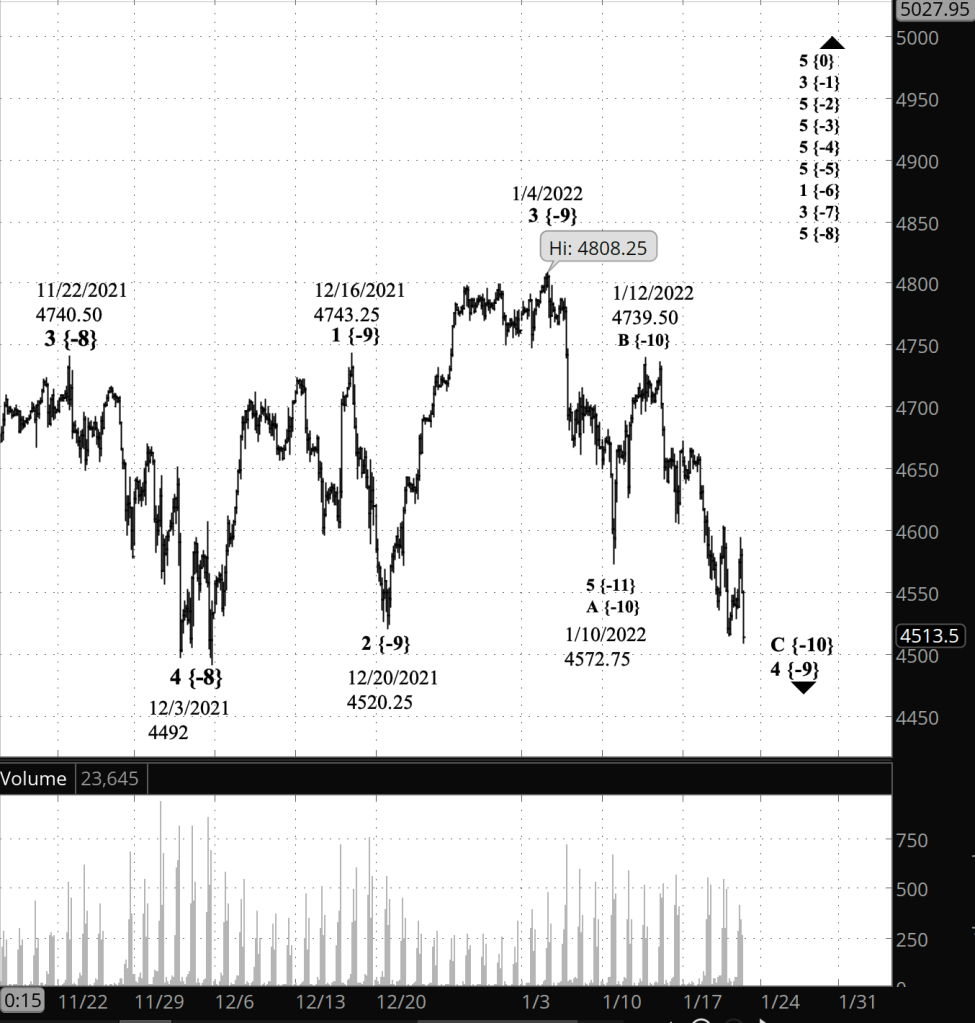
What’s happening now? The S&P 500 E-mini futures fell to 4429.50 in overnight trading, reaching below the December 3 low of 4492.

What does it mean? The January 4 peak at 4808.25 ended an uptrend that began on September 30 from 4293.75 and a new downtrend has begun that will eventually reach 2000 and below.

What’s the alternative? The correction that began from the January 4 peak is still underway and will be followed by a rise to new heights, above 4808.25.

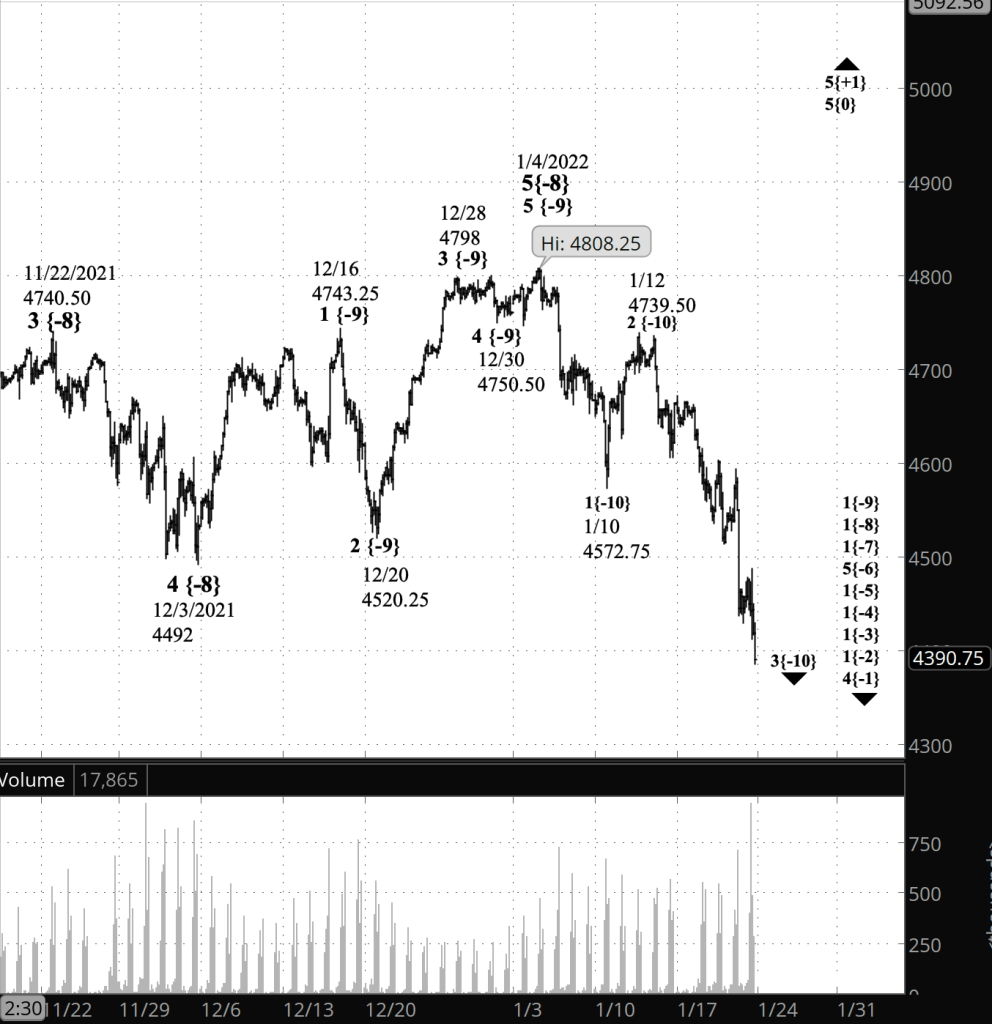
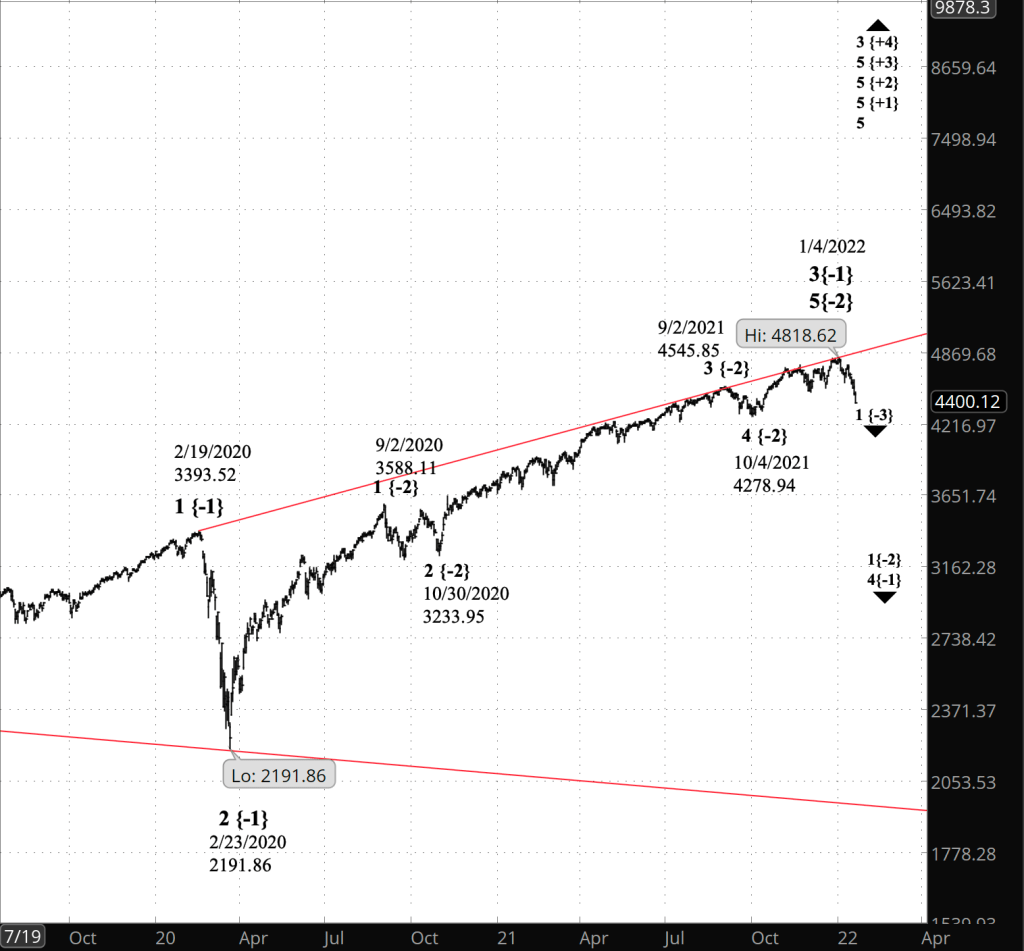
Charts. The upper chart is a near-term view of the S&P 500 futures, going back to mid-November 2021. The lower chart is a long-term view of the S&P 500 index, going back to mid-July 2019, showing the February 2020 crash early in the pandemic.

[S&P 500 E-mini futures at 3:30 p.m., 135-minute bars, with volume]
[S&P 500 index at 3:27 p.m., hourly bars]

What does Elliott wave theory say? I’ve said written on several occasions that if the price moved below 4492, the start of wave 5{-8}, then I would take that as a strong signal that a new downtrend had begun. The move below 4492 in overnight trading demanded a new downtrend the principal analysis.

The secondary analysis is where we’ve been since January 4 — a 4th wave downward correction of the {-9} degree that was in its C wave and nearing its end. This still remains as a viable options because there’s no rule in Elliott that says that a 4th wave can’t move below the beginning of the preceding 1st wave. It seems inelegant, but there you go. Sometimes the markets present an odd aesthetic.

Under my principal analysis, the January 4 peak completed 5th wave cascading up from wave 5{-8}, which began on August 19, 2021, all the way to wave 5{-2}, which began October 4, 2021. The end of wave 5{-2} in turn marks the end of its parent, wave 3{-1}, which began on February 23, 2020 at the end of the early pandemic crash.

The red lines on the long-term chart mark the boundaries of an expanding Diagonal Triangle that began in December 2018. Wave 4{-1} will eventually reach the lower boundary of the triangle, which is presently in the 1960s. Since the triangle is expanding, the lower boundary will decline further each day and so will be noticeably lower by the time the market arrives at that boundary.

It will be an epic decline, and then it will reverse in Wave 5{-1}, which will carry the price back to the every rising upper boundary. At that point, the triangle will be complete, cascading up the fractal wave structure to wave 3{+4}, which began in the late 17th century, according to Robert Prechter‘s analysis. The ensuing wave 4{+4} decline will be of a magnitude no person alive today has ever seen.

Learning and other resources. Elliott wave analysis provides context, not prophecy. As the 20th century semanticist Alfred Korzybski put it this way in his book Science and Sanity (1933), “The map is not the territory … The only usefulness of a map depends on similarity of structure between the empirical world and the map.” And I would add, in the ever-changing markets, we can judge that similarity of structure only after the fact.

See the menu page Analytical Methods for a rundown on where to go for information on Elliott wave analysis.

By Tim Bovee, Portland, Oregon, January 21, 2022

Disclaimer

Tim Bovee, Private Trader tracks the analysis and trades of a private trader for his own accounts. Nothing in this blog constitutes a recommendation to buy or sell stocks, options or any other financial instrument. The only purpose of this blog is to provide education and entertainment.

No trader is ever 100 percent successful in his or her trades. Trading in the stock and option markets is risky and uncertain. Each trader must make trading decisions for his or her own account, and take responsibility for the consequences.

License
Creative Commons License

All content on Tim Bovee, Private Trader by Timothy K. Bovee is licensed under a Creative Commons Attribution-ShareAlike 4.0 International License.

Based on a work at www.timbovee.com.

NFLX Trade

Netflix Inc. (NFLX)

Update 3/18/2022: I exited my short iron condor options spread on NFLX when it expired, for no debit per contract/share, a profit before fees of $405 per contract.

However, at expiry the in-the-money options — a vertical spread within the iron condor — were converted to shares, both long and short. My brokerage for options trading, TastyWorks (best in the business for active traders in my opinion), bought the short shares and sold the long shares for a net loss, as is normal when options expire. The loss was the maximum possible for a $10 spread between strike prices.

At the March 18 close, shares were trading at $380.60, down $136.90 from the entry level.

The Implied Volatility Rank at exit was 49.4%, down 37.1 points from the entry level.

As always when options are assigned, exercised or expire, there are three sets of results: For the options, for the shares, and a combination of the two.

The shares transactions followed the strike prices; shares were bought for $450 a share, and sold for $440 a share, for a $10 loss per shares before fees. Since an options contract is for 100 shares, the loss on the position created by expiration was $1,000.

However, when I entered the options position, I received a $4.05 premium for each contract/share, or $405 per contract. So when the options and the shares are combined, my credit was $444.50 and my debit was $450, for a $595 loss total on the 100 shares.

The earnings play fell into trouble immediately after the company announced its results. As I noted upon entry, options pricing implied a $34.36 move either way, and I chose to use an iron condor position to profit from a move in either direction within that range, and actually, I padded it, for a profit zone running from $483.14 to $561.86. When trading resumed after earnings were published, NFLX opened at $400.43, and hasn’t returned to the position’s profit zone since that time. The potential loss occasionally moved to less than the maximum potential loss from time to time, but I could never get a fill, and in the end holding the position until expiration proved to be the best way to minimize the loss.

Shares declined by 26.5% over 57 days for a -169% annual rate.

The options position produced a 100% return for a +640% annual rate.

The shares position produced a 2.2% loss for a -811% annual rate

The combined options and shares positions produced a -1.3% loss for a -8% annual rate.


I have entered a short iron condor spread on NFLX, using options that trade for the last time 57 days hence, on March 18. The premium is a $4.05 credit per contract share and the stock at the time of entry was priced at $517.50.

The Implied Volatility Ratio stands at 86.5%

Premium:$4.05Expire OTM
NFLX-iron condorStrikeOddsDelta
Calls
Long575.0078.0%27
Break-even569.0576.0%29
Short565.0074.0%31
Puts
Short450.0078.0%18
Break-even444.0579.5%16.5
Long440.0081.0%15

The premium is 40.5% of the width of the positions short/long spreads. The profit zone covers a 10% move to the upside and a 16.5% move to downside. I skewed the position in order to give greater protection to a downside move.

The risk/reward ratio is 1.5:1, with maximum risk of $595 and maximum reward of $405 per contract.

How I chose the trade. The trade was placed to coincide with NFLX’s earnings announcement, after the closing bell on the day of entry. The short strikes were set beyond the expected move of $34.36 either way, based on options pricing, which would give a price range of $483.14 to $561.86. NFLX has a history of breaking beyond expectations, and I’ve been burnt before by that tendency. So the position, as designed, is profitable between $450 and $565, providing more cushion for an overly large post-announcement move. And as a I said above, it’s skewed to the downside.

By Tim Bovee, Portland, Oregon, January 20, 2022

Disclaimer

Tim Bovee, Private Trader tracks the analysis and trades of a private trader for his own accounts. Nothing in this blog constitutes a recommendation to buy or sell stocks, options or any other financial instrument. The only purpose of this blog is to provide education and entertainment.

No trader is ever 100 percent successful in his or her trades. Trading in the stock and option markets is risky and uncertain. Each trader must make trading decisions for his or her own account, and take responsibility for the consequences.

License
Creative Commons License

All content on Tim Bovee, Private Trader by Timothy K. Bovee is licensed under a Creative Commons Attribution-ShareAlike 4.0 International License.

Based on a work at www.timbovee.com.

Trader’s Notebook

4:15 p.m. New York time

Earnings play exit. During the session I exited my short iron condor position on DAL, for a 24% return over eight days. I’ve updated the trade analysis with details of the exit.

3:50 p.m. New York time

Earnings play exit. I’ve exited my short iron condor position on WFC after seven days, for a 17.4% return. I’ve updated the trade analysis with full details.

3:30 p.m. New York time

Half an hour before the closing bell. The S&P 500 futures reversed and moved a few points below the overnight now, to 4510.25 so far. This morning’s first alternative analysis is correct. Wave C{-10} within wave 4{-9} is still underway. I’ve updated the chart.

10:35 a.m. New York time

Earnings play entry. I’ve entered a short iron condor options position on NFLX, timed to coincide with the company’s earnings announcement after the closing bell. I’ve posted an analysis of the trade.

9:35 a.m. New York time

What’s happening now? The S&P 500 E-mini futures declined overnight to 4514.50, below the December 20 low of 4520.25 and then rose by 50 points before the opening bell.

What does it mean? The last leg of the downward correction that began on January 4 from 4808.25 has met all requirements for completion. The overnight low could be the end of the correction …

What’s the alternative? … or, as the first alternative, the price could reverse and it could decline further. As I did yesterday, I’ve marked the chart to comply with the principal analysis. But I think this first alternative is equally likely.

As a second alternative, the pattern of the decline from the high of January 4 is also consistent with the beginning of a new downtrend. This would require adjusting the wave number for January 4. The ambiguities in the lead-up to that high make it possible this alternative will play out.

A decline below 4492 — the low of December 3 — would confirm this second alternative. A rise above 4808.25 — the high of January 4 — would confirm the principal analysis.

[S&P 500 E-mini futures at 3:30 p.m., 135-minute bars, with volume]

What does Elliott wave theory say? Under the principal analysis, wave C{-10} within wave 4{-9} ended overnight, and wave 5{-9} began its ascent to new highs.

Under the first alternative, wave C{-10} has a few more very low level internal waves to complete before it is done. I count the final downward movement that ended last night as wave 5{-12} within wave 5{-11} within wave C{-10}.

Both the principal analysis and the first alternative are taking place within wave 5{-8}, which began on December 3 from 4492, and the January 4 peak was the end of wave 3{-9} within wave 3{-8}.

Under the second alternative, the January 4 peak marked the end of wave 5{-8}, and the decline since then, internally movements of 5, 3 and 5 waves, marks waves 1, 2 and 3 — all of the {-10} degree — within downtrending wave 1{-9}.

Learning and other resources. Elliott wave analysis provides context, not prophecy. As the 20th century semanticist Alfred Korzybski put it this way in his book Science and Sanity (1933), “The map is not the territory … The only usefulness of a map depends on similarity of structure between the empirical world and the map.” And I would add, in the ever-changing markets, we can judge that similarity of structure only after the fact.

See the menu page Analytical Methods for a rundown on where to go for information on Elliott wave analysis.

By Tim Bovee, Portland, Oregon, January 20, 2022

Disclaimer

Tim Bovee, Private Trader tracks the analysis and trades of a private trader for his own accounts. Nothing in this blog constitutes a recommendation to buy or sell stocks, options or any other financial instrument. The only purpose of this blog is to provide education and entertainment.

No trader is ever 100 percent successful in his or her trades. Trading in the stock and option markets is risky and uncertain. Each trader must make trading decisions for his or her own account, and take responsibility for the consequences.

License
Creative Commons License

All content on Tim Bovee, Private Trader by Timothy K. Bovee is licensed under a Creative Commons Attribution-ShareAlike 4.0 International License.

Based on a work at www.timbovee.com.

UNP Trade

Union Pacific Corp. (UNP)

Update 2/1/2022: I exited my short iron condor position on UNP, 17 days before expiration, for a $1.71 debit per contract/share, a profit before fees of $14 per contract. Shares were trading at $245.34, up $5.76 from the entry level.

The Implied Volatility Rank at exit was 30.3, down 26.3 points from the entry level.

I exited because the position reached profitability with fewer than 21 days left before expiration, my normal practice for exiting positions that haven’t reached 25% of maximum potential profit.

Shares declined by 2.4% over 13 days for a +68% annual rate. The options position produced an 8.2% return for a +230% annual rate.


I have entered a short iron condor spread on UNP, using options that trade for the last time #30 days hence, on February 18. The premium is a $1.85 credit per contract share and the stock at the time of entry was priced at $239.58.

The Implied Volatility Ratio stands at 56.6%

Premium:$1.85Expire OTM
UNP-iron condorStrikeOddsDelta
Calls
Long255.0090.0%13
Break-even251.8584.5%18.5
Short250.0079.0%24
Puts
Short225.0073.0%25
Break-even221.8576.0%21.5
Long220.0079.0%18

The premium is 37% of the width of the positions short/long spreads. The profit zone covers a 5.1% move to the upside and an 8.0% move to the downside.

The risk/reward ratio is 1.7:1, with maximum risk of $315 and maximum reward of $185 per contract.

How I chose the trade. The trade was placed to coincide with UNP’s earnings announcement, before the opening bell on the day after entry. The short strikes were set to coincide with the expected move of $11.73 either way, based on options pricing, which gives a price range of $227.30 to $250.76.

By Tim Bovee, Portland, Oregon, January 19, 2022

Disclaimer

Tim Bovee, Private Trader tracks the analysis and trades of a private trader for his own accounts. Nothing in this blog constitutes a recommendation to buy or sell stocks, options or any other financial instrument. The only purpose of this blog is to provide education and entertainment.

No trader is ever 100 percent successful in his or her trades. Trading in the stock and option markets is risky and uncertain. Each trader must make trading decisions for his or her own account, and take responsibility for the consequences.

License
Creative Commons License

All content on Tim Bovee, Private Trader by Timothy K. Bovee is licensed under a Creative Commons Attribution-ShareAlike 4.0 International License.

Based on a work at www.timbovee.com.