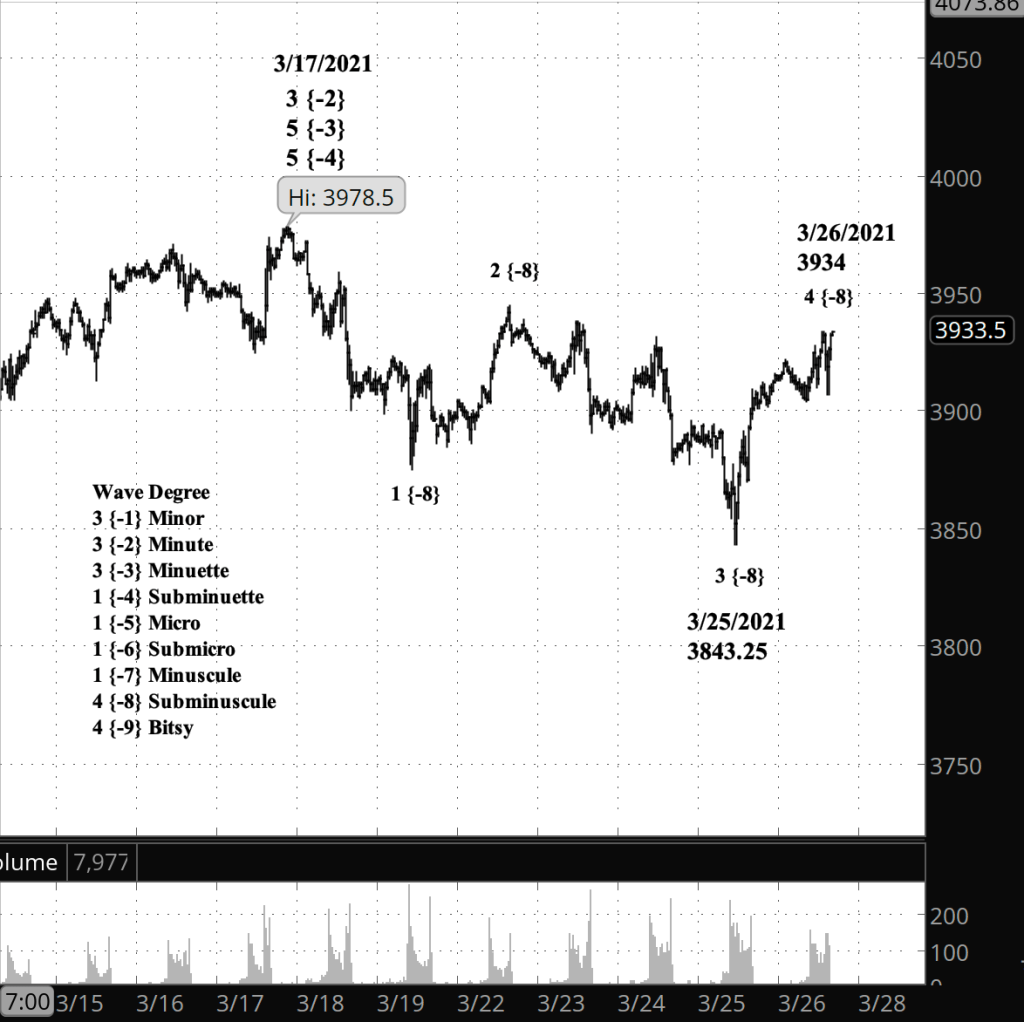
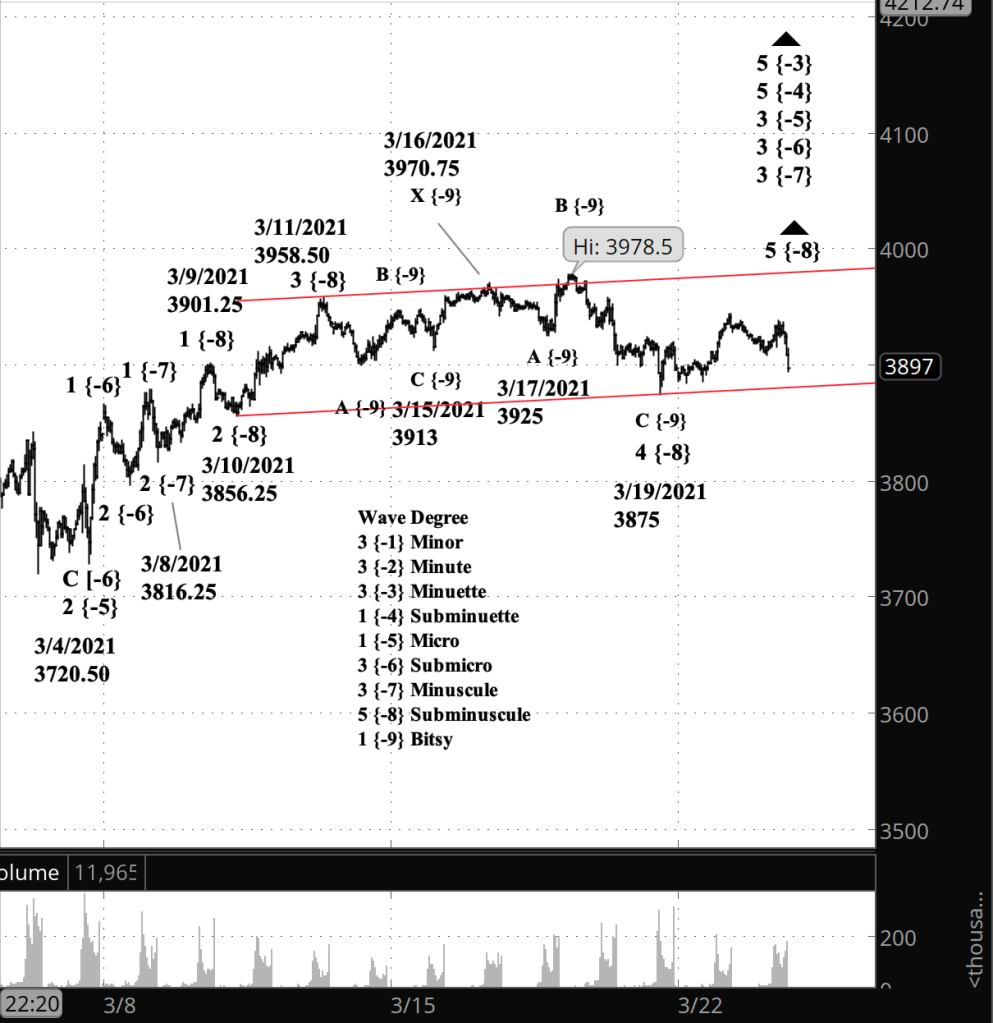
Half an hour before the closing bell. The S&P 500 has risen slightly above the morning high, to 3934 on the E-mini futures, 3919.54 on the index. It is unclear whether that level marks the end of wave 4 of Subminuscule degree. I’ve updated the chart.
9:55 a.m. New York time
What’s happening now? The S&P 500 E-mini futures continued to rise overnight, completing an upward correction within a larger downtrend.
What does it mean? The correction will be followed by a resumption of the downtrend as the prices drops below yesterday’s low, 3843.25.
What are the alternatives? The upward correction has the potential of extending in a net sideways movement before it is complete.
[S&P 500 E-mini futures at 3:30 p.m., 30-minute bars, with volume]
What does Elliott wave theory say? The upward correction, wave 4 of Subminuscule degree, appears to have within it three waves, meaning it has satisfied the rules of Elliott wave theory. The declining middle wave within Subminuscule 4 — a B wave — is quite small compared to the rising waves that surround it, so it is impossible that the rise we’ve seen since yesterday was in fact only the A wave of Bitsy degree. A decline of the price below the start of Subminuscule 4, from 3843.25, will be proof that the 4th wave is complete, eliminating the alternative analysis. A move above today’s high so far, 3921.50, will prove that Subminuscule 4 is still underway and will have at least two more waves of Bitsy degree within it before it conclues.
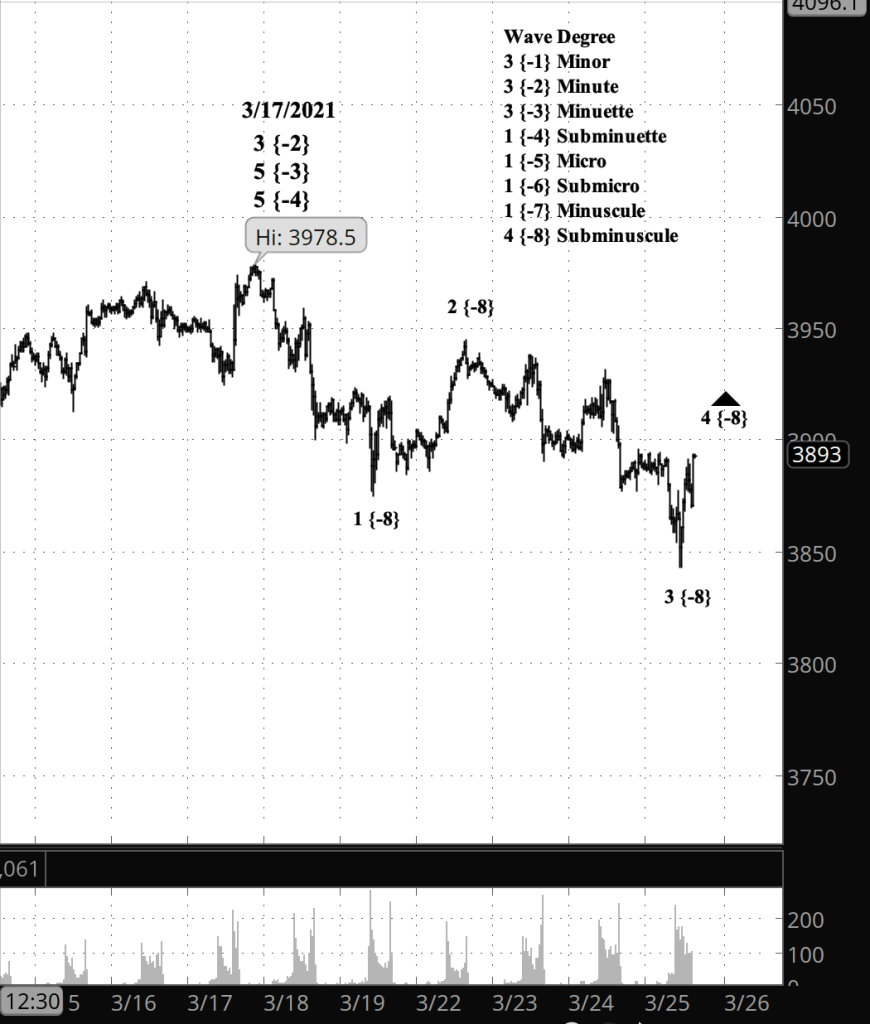
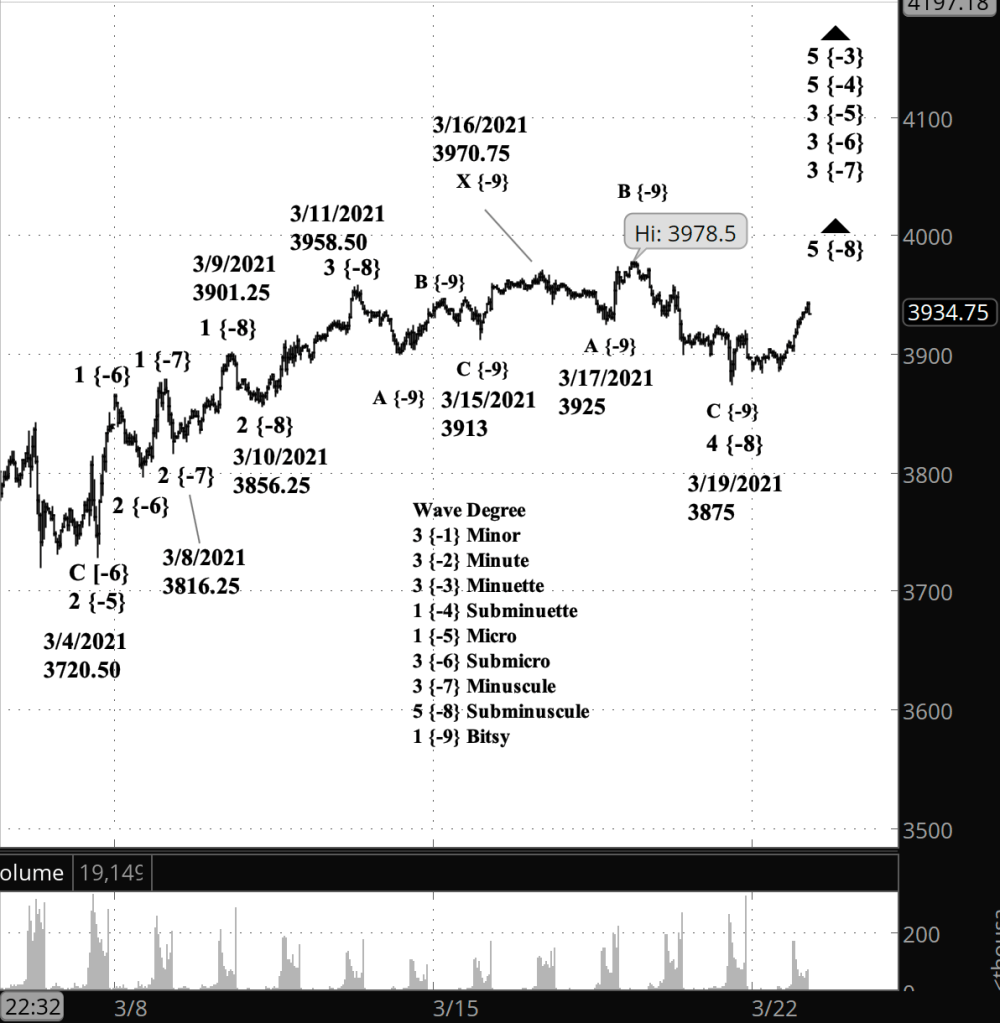
An hour before the closing bell. The S&P 500 continues the early downward movements of a 4h wave correction at the Minute degree. Here’s a chart of the E-mini futures showing details of the decline that began March 17 from 3978.50 (3983.87 on the index).
[S&P 500 E-mini futures at 3 p.m., 30-minute bars, with volume]
9:35 a.m. New York time
What’s happening now? The S&P 500 index, having peaked on March 17 at 3983.87 — the E-mini futures equivalent is 3978.50 — continues to work through the early phases of a decline.
What does it mean? The downward movement is a correction at higher levels, but to traders more interested in the shorter term — weeks or months — the decline will present itself as a downtrend. See the Elliott wave section for further discussion.
What is the alternative? It is possible that the final upward push of the trend that began February 20, 2020 is not yet complete, that 3983.87 is not the peak. If that proves to be the case, then there will be more net gain in the S&P 500’s near future.
[S&P 500 index at 9:35 a.m., daily bars]
What does Elliott wave theory say? The March 17 peak marks the end of wave 5 of Subminuette degree and its parent wave 5 of Minuette degree. In turn, the end of those 5th waves marks the end of wave 3 of Minute degree, one degree higher than Minuette.
So at the Minuette degree, the index has begun a 4th wave correction to the downside. But what does that look like?
The first wave within a correction is an A wave, and an A wave within wave 4 can have either three subwaves if it is the beginning of a Flat pattern or five subwaves if it is the start of a Zigzag.
At this higher degree, wave A is presently within its first subwave, wave 1 of Minuette degree, which will look like any 1st wave: Five subwaves, just like any movement in the direction of the main trend.
The bottom line is that the word “trend” in Elliott wave analysis is a complex concept. Each wave in the direction of a trend — 1, 3 or 5 — has within it at each smaller degree counter-trend corrections as well as trending movements. Whether “the market” is in an uptrend or a downtrend depends upon what degree we’re looking at.
To my thinking that fractal complexity gives Elliott wave analysis much of its power.
What does this mean for my trading? My options trades generally last a few weeks, and so I’ll be treating this market as downtrending, at the Minuette degree and smaller. Yesterday I exited my options position that expired April 16. The next monthly series expires April 21, which gives me an optimal entry date of April 6, within a window stretching from March 30 to April 13.
Half an hour before the closing bell. The S&P 500 continued its three-wave downward correction, having reached a low of 3898.25 on the futures so far today, and is presently in its final leg, wave C of Subbitsy degree within wave 2 of Bitsy degree. The correction is occurring within a rising wave, the 5th of Subminuscule degree. I’ve updated the chart below.
The completion of wave C will mark the beginning of wave 3 of Bitsy degree, which will carry the price into the 3940s and perhaps even higher.
10:30 a.m. New York time
Trade results. I’ve updated my NIO Trade post with results and an analysis of what went right.
9:45 a.m. New York time
My trade. I’ve exited my short iron condor options spread on NIO for 50% of maximum potential profit, which was my target price. I shall update the NIO Trade entry analysis shortly.
9:40 a.m. New York time
What’s happening now? The S&P 500 E-mini futures rose overnight in the second leg of a downward correction.
What does it mean? The correction is likely to reach completion quickly and will be followed by a rise to new highs.
What are the alternatives? My prior analysis had suggested, as an alternative, that the rise from March 19 might have been the prelude to a third corrective pattern, but I’m taking that off the table and have no alternative analysis at this point.
[S&P 500 E-mini futures at 3:30 p.m., 10-minute bars, with volume]
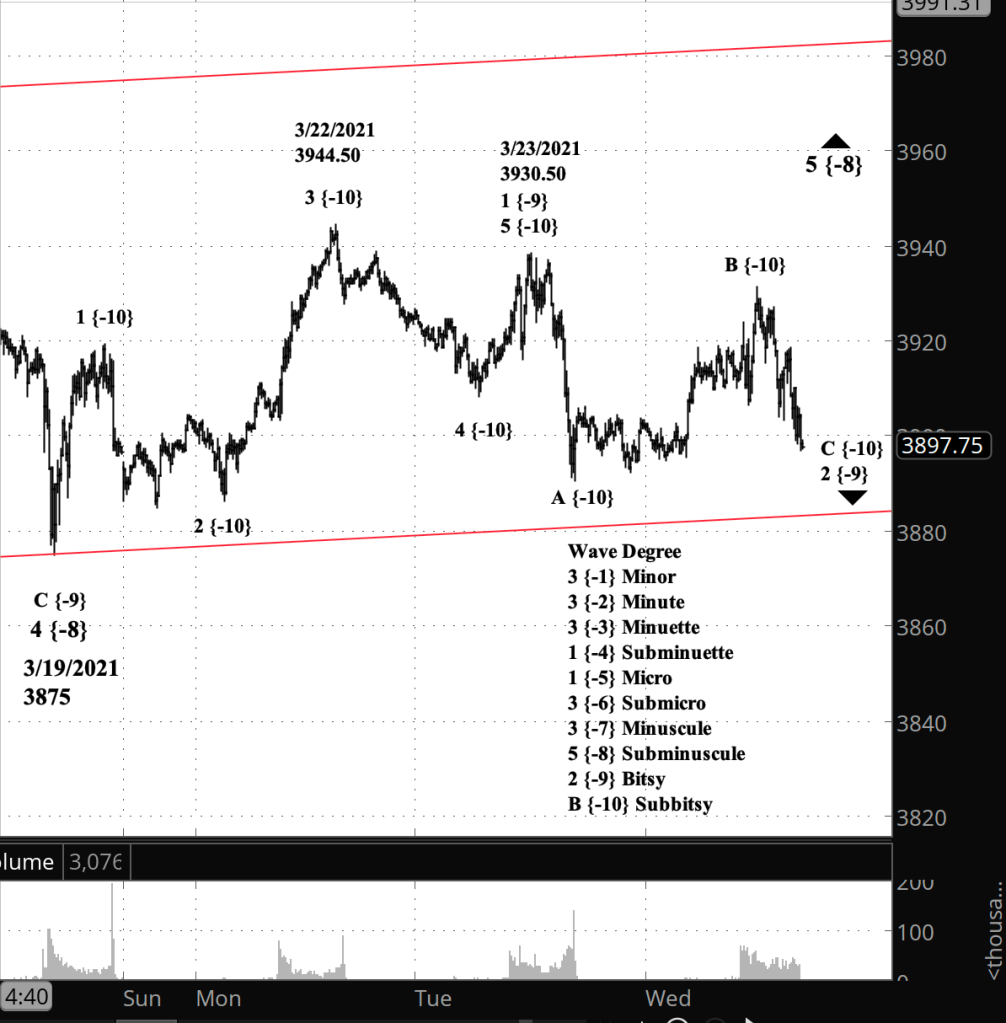
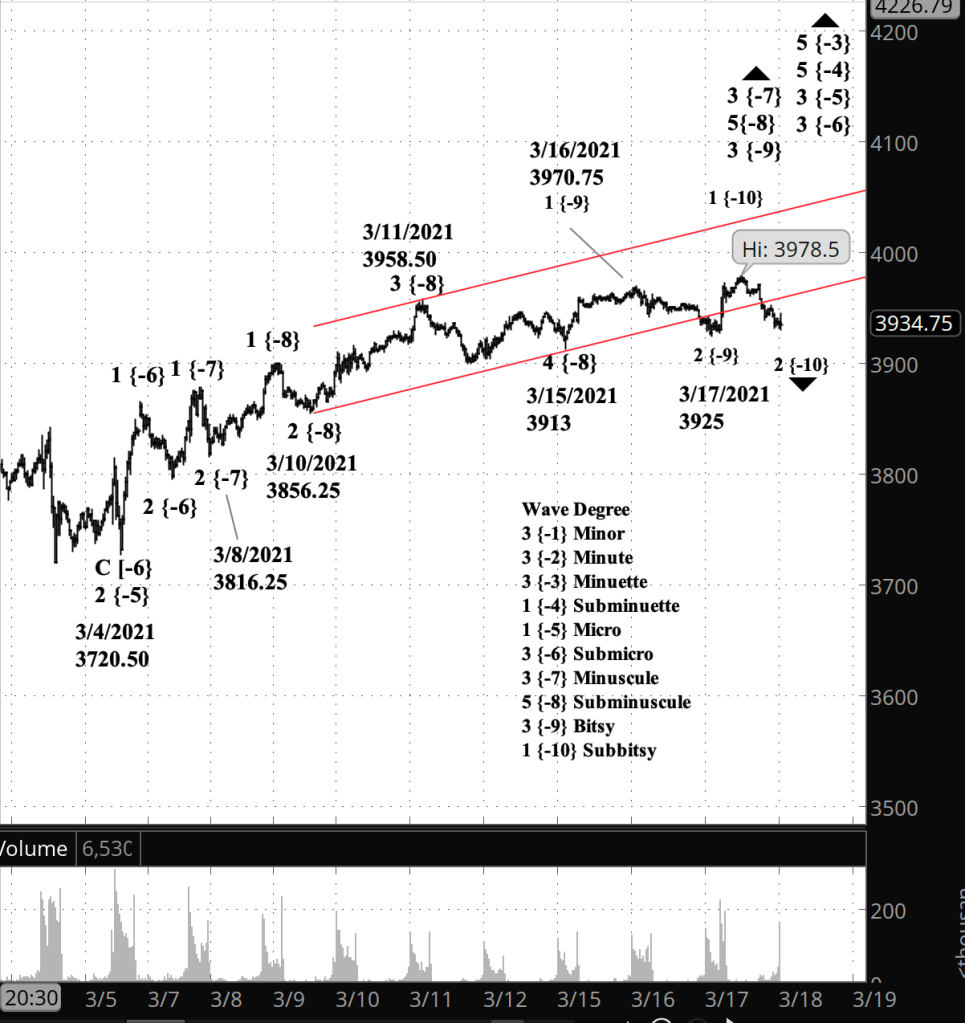
What does Elliott wave theory say? I’ve moved the chart in for a close-up so as to better track the subwaves of the rise from March 19. The price channel (red lines) is for Subminuscule degree, which began on March 9. (See yesterday’s post to view the full channel.)
So here’s where we are. Within uptrending wave 5 of Subminuscule degree, wave 1 of Bitsy degree ended yesterday, March 23, with a truncated 5th wave of Subbitsy degree at 3930.50, and Bitsy wave 2 began. Within wave 2 of Bitsy degree, downtrending wave A of Subbitsy degree fell sharply to completion yesterday, and subsequently the price rose in wave B of Subbitsy degree, which is still underway.
Second waves are generally simple Zigzags, dramatic in their scope and over quickly. Once Bitsy wave 2 is complete, wave 3 of Subminuscule degree will begin its rise. Third waves tend to be energetic, and I expect this 3rd wave to carry the price significantly closer to the price channel’s upper boundary.
Half an hour before the closing bell. The S&P 500 reversed to the downside in trading today after completing a 5-wave uptrend of a small degree — perhaps Bitsy degree, perhaps even smaller. The downside reversal would be correction, and I expect the upward trend to resume soon with another 5-wave pattern. I’ve updated the chart below.
10 a.m. New York time
What’s happening now? The S&P 500 E-mini futures continued the rise that began on March 19 and at the opening bell was undergoing a lower level correction within that rise.
What does it mean? Completion of the rise, at around the 4000 level, will trigger a correction.
What are the alternatives? The rise could be an upward movement separating two corrective patterns rather than an uptrend
[S&P 500 E-mini futures at 3:30 p.m., 40-minute bars, with volume]
What does Elliott wave theory say? The rise from March 19 is wave 5 of Subminuscule degree. A line connecting the beginning points of Subminuscule waves 3 and 5, with a parallel line passing through the end of wave 3 produces a rather shallow price channel for the Subminuscule degree. If the price were to touch the channel’s upper boundary in the next few days, it would be in the 3980s. Fifth waves have a habit of occasionally breaking through the channel and continuing to rise much higher in an extended wave. And sometimes, 5th waves fall short, failing to exceed the peak of wave 3. So there’s no way to place a definite target for the present 5th wave rise.
Completion of Subminuscule 5 will also be the end of the parent wave, Minuscule 3, and will be followed by a 4th wave correction. Fourth waves tend to be shallow, although not always.
The alternative analysis defines the present rise as an X wave of Bitsy degree, a wave that separates the previous corrective pattern from one that will begin from the peak of wave X. The new corrective pattern would be the third within wave 4 of Subminuscule degree. I haven’t seen three patterns within a corrective wave very often, so I’m treating this as a the less likely prospect.
My trades. On Friday my short iron condor position on NIO will reach 21 days before expiration. If it’s profitable, then I exit on Friday. If unprofitable, then I try to salvage the situation by modifying the untested leg of the iron condor. Presently the position stands at 23% of maximum potential profit.
Half an hour before the closing bell. The S&P 500 continued to rise during the trading session, reaching a high so far of 3944.50. The pattern is consist with both the principle analysis (5th wave of Subminuscule degree) and the alternate analysis (X wave of Bitsy degree). I’ve updated the chart below.
9:40 a.m. New York time
What’s happening now? The S&P 500 E-mini futures continues to tentatively work through the early stages of an uptrend from the March 19 low of 3875.
What does it mean? Under my principle analysis, the rising price will eventually reach above the present high of 3978.50.
What are the alternatives? It’s possible that the correction that began March 11 is still underway, with the present rise being a link with a new corrective pattern. If the alternative proves out, the price will continue to fluctuate within a narrow range.
[S&P 500 E-mini futures at 3:30 p.m., 38-minute bars, with volume]
What does Elliott wave theory say? Under the principle analysis, the rising price is wave 5 of Subminuscule degree. The completion of Subminuscule wave 5 will also mark the end of its parent wave, Minuscule wave 3 and will be followed by a shallow correction.
Under the alternative, it’s an X wave connector of Bitsy degree, which will be followed by a Flat, a ZigZag or a Triangle formation to complete the parent wave 4 of Subminuscle degree.
Practically speaking, the difference between the two analyses is the degree of upward potential now rather than later.
Half an hour before the closing bell. No change from the 2:10 p.m. analysis. I’ve updated the chart.
2:10 p.m. New York time
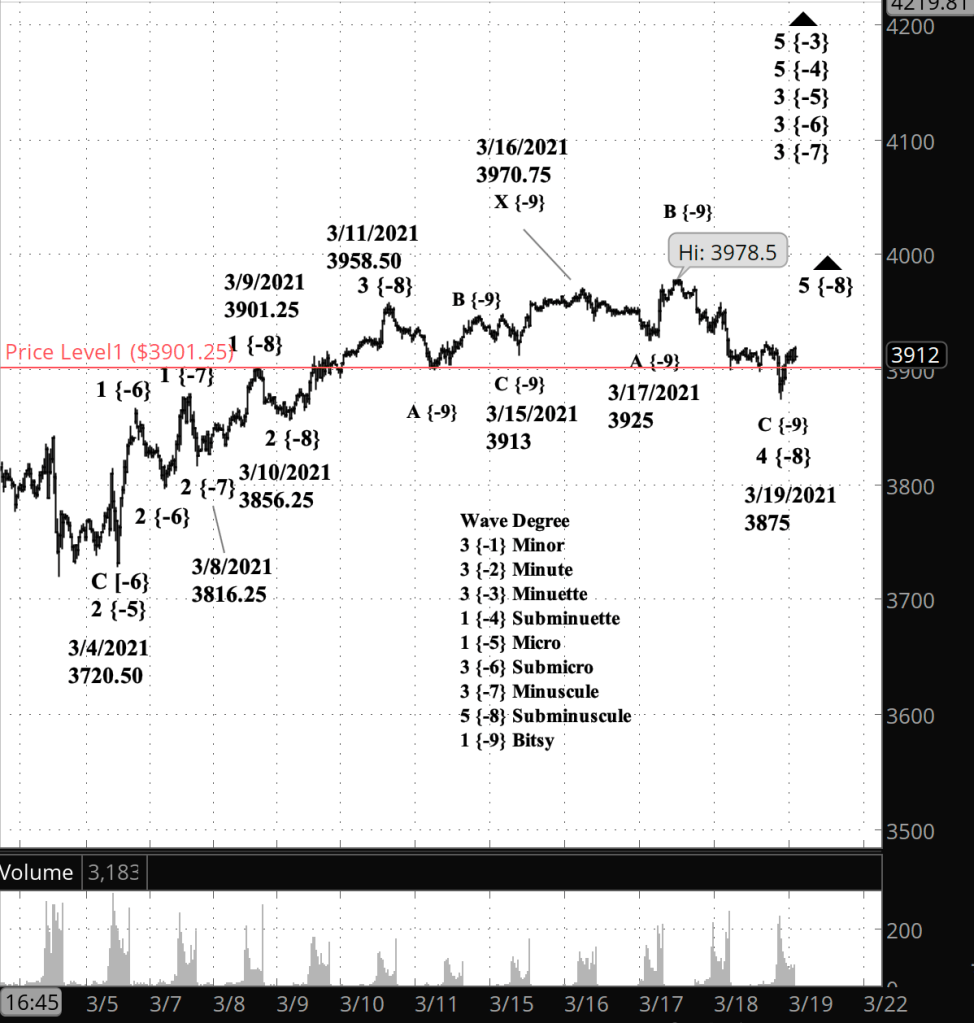
Two hours before the closing bell. The S&P 500 E-mini futures reversed at a low of 3875, which is 26.25 points below the end of wave 1 of Subminuscule degree, 3901.25, and moved back above that level. The S&P 500 index never fell below the end of Subminuscule 1. So this confirms my rounding-error theory for the futures, as discussed below the the Elliott wave theory section, and enables me to reanalyze the chart.
[S&P 500 E-mini futures at 3:30 p.m., 35-minute bars, with volume]
Under my principle analysis, wave 4 of Subminuscule degree ended today at 3875, and the reversal to the upside is wave 5 of Subminuscule degree. The rules of Elliott wave analysis impose no limits, beyond common sense, on the distance a 5th wave can travel. The end of Subminuscule 5 will also mark the end of the parent wave, 3 of Minuscule degree, which will trigger a correction of the rise from 3816.25, which began on March 8.
The alternate analysis designates the rise today as an additional separator, wave X of subminuscule degree, to be followed by another corrective pattern that will probably trend sideways. And a third possibility is that Wave C of Bitsy degree is still declining, although I consider this to be unlikely.
10:10 a.m. New York time
Update. The S&P 500 index 4th wave of Minuscule degree has not penetrated the end of the prior wave 1. The 1st wave ended at 3878.07 on the index, and the low so far of wave 4 is 3886.75. This lends weight to my rounding-error theory.
9:55 a.m. New York time
What’s happening now? The S&P 500 E-mini futures traded sideways overnight as the downward correction that began March 11 continues.
What does it mean? But there’s a potential problem with the count, one that I’m unable to resolve at present.
What’s the alternative? See the Elliott wave theory section below.
[S&P 500 E-mini futures at 9:54 a.m., 35-minute bars, with volume]
What does Elliott wave theory say? The problem is this. It’s a firm rule in Elliott wave analysis that a 4th wave cannot move beyond the end of the preceding 1st wave. I’ve counted the present decline as the 4th wave of Subminuscule degree. The 1st wave of Subminuscule degree ended at 3901.25 (the red horizontal line on the chart)_. The price has moved below that level in three 35-minute bars since yesterday, always briefly, as it quickly retreats to above the level. In the last hour as I write this the price has penetrated that level in two bars, the most recent reaching a low of 3877.25 (so far).
So what make of this? There are several possibilities, none of which I find especially compelling. The first is the granularity of futures pricing. The S&P 500 index is priced in cents, 1/100th of a dollar. The futures are priced in 25 cent increments, 1/4th of a dollar. The rule forbidding a 4th wave move beyond the end of wave 3 says “never”, but it was written for the index, before the futures had even been invented. So it could be that the moves below the line amount to a rounding error. After all, the largest push below that level has been 24 cents, and the rounding error will continue as low as 50 cents below the end of wave 1.
If we stick to “never means never”, then the alternative is the severely truncated 3rd wave model that I discussed in detail in yesterday’s analysis. In brief, I wrote that a short wave 3 ending at 3978.50 means that the future 5th wave must even shorter to avoid the 3rd wave being shorter than both waves 1 and 5. That’s another forbidden structure under the rules of Elliott wave analysis.
At this point I’m throwing up my hands and quietly sipping my Bancha green tea until the chart gains some clarity. As the Martian-raised Earthling Valentine Michael Smith put it in Robert Heinlein’s masterpiece Stranger in a Strange Land, “Waiting is.”
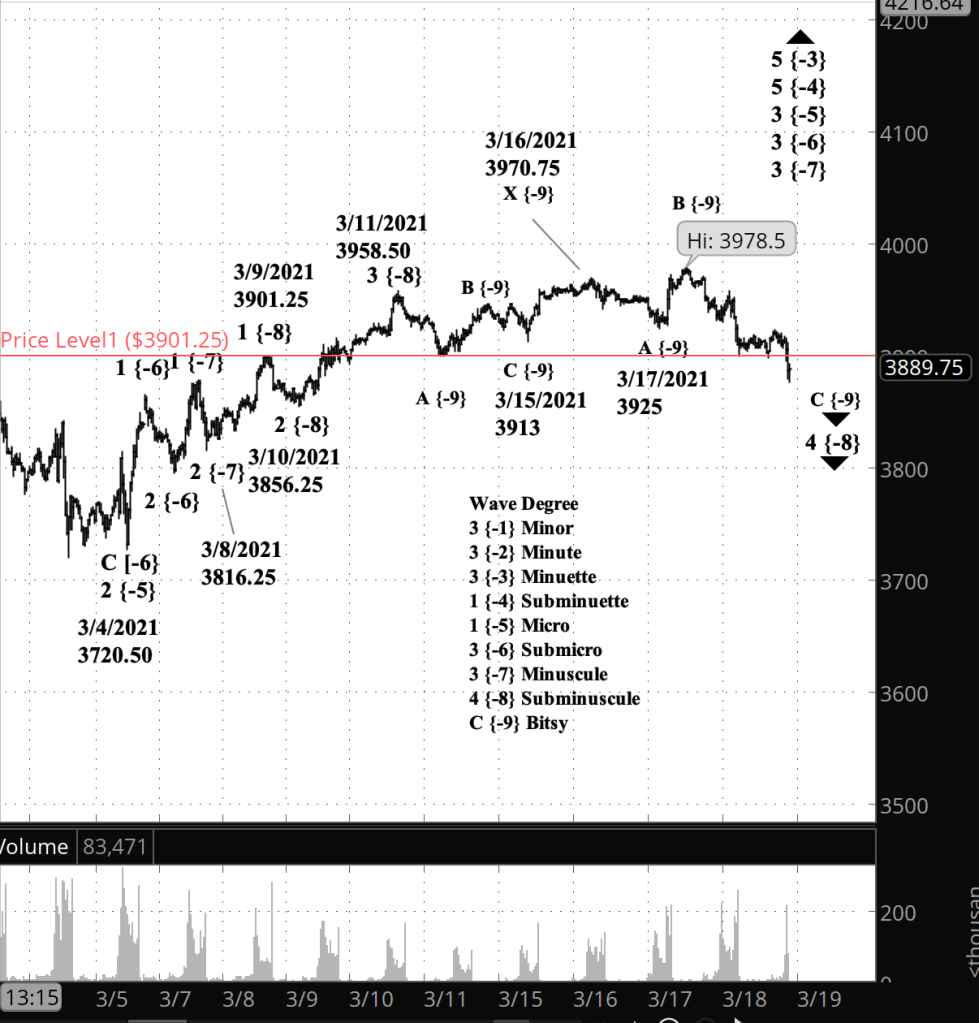
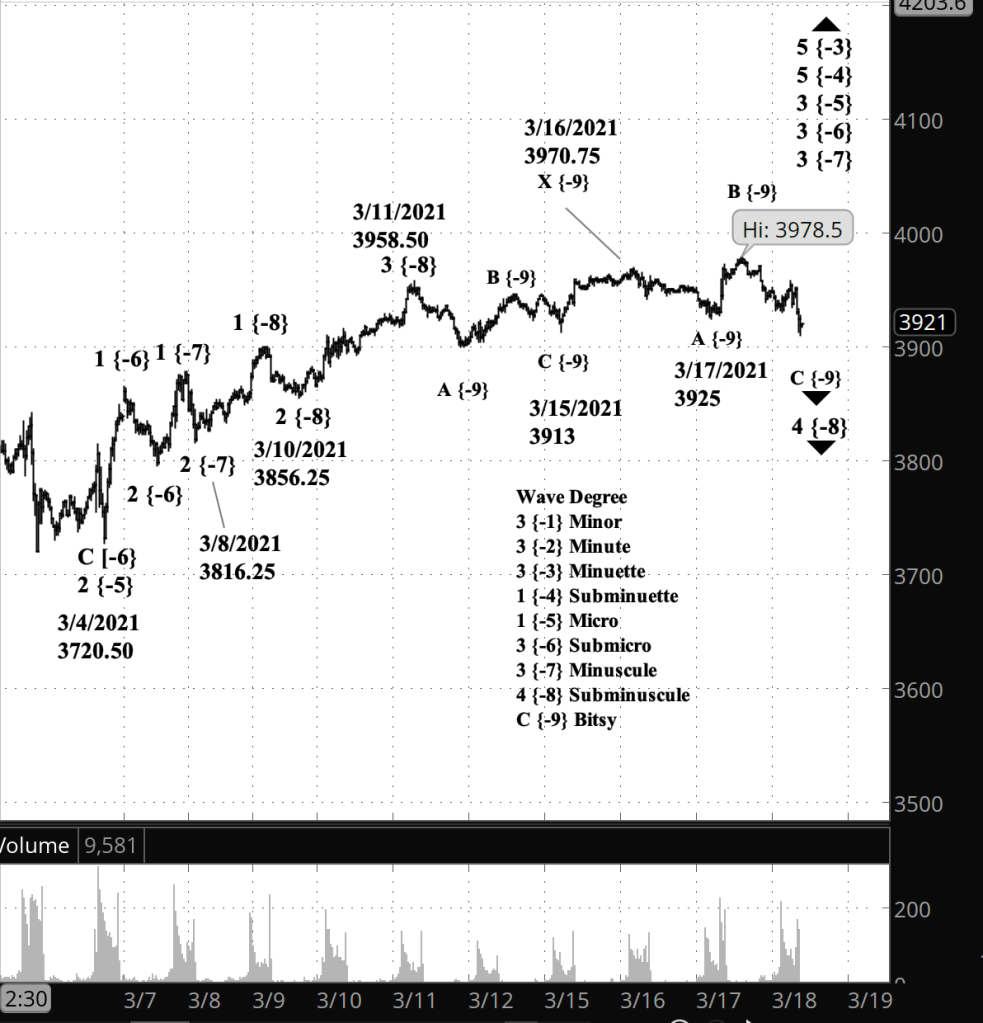
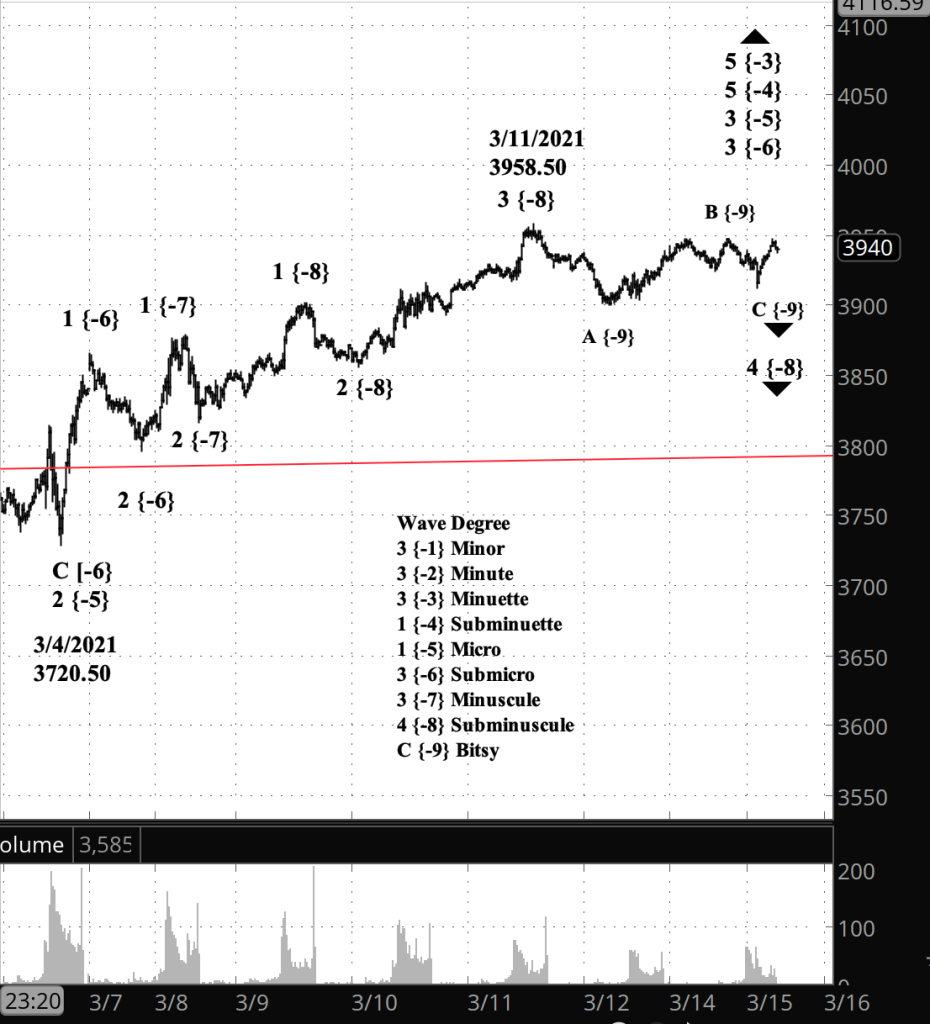
Half an hour before the closing bell. The S&P 500 fell below 3925, invaliding this morning’s count. My new principle analysis shows wave 4 of Subminuscule degree underway, having traced a compound pattern, the second of which, C of Bitsy degree, is still in progress. Here’s a chart of the new count, and I’ve left the chart of the old count from this morning for comparison, marking it as outdated.
[S&P 500 E-mini futures at 3:30 p.m., 30-minute bars, with volume]
9:55 a.m. New York time
What’s happening now? The S&P 500 E-mini futures fell to within seven points of yesterday’s low of 3925. A decline below 3925 would require a re-analysis of the rise that began on March 8.
What does it mean? By my principle analysis, yesterday’s rise is the beginning of the middle wave to the upside, often the most powerful wave in the direction of the trend.
What are the alternatives? It’s possible that correction beginning March 11 is still underway. It’s also possible that yesterday’s rise completed the middle wave to the upside. See a more detailed discussion in the Elliott wave section below.
[Outdated S&P 500 E-mini futures at 9:51 a.m., 30-minute bars, with volume]
What does Elliott wave theory say? By my principle analysis, yesterday’s rise, to a high of 3978.50, was wave 1 of Subbitsy degree, the initial leg of the parent wave 3 of Bitsy degree.
Yesterday’s rise can also be counted as the completion of wave 3 of the parent Bitsy degree. However, under this scenario, wave 3 is shorter than the preceding wave 1, and that would require that the future wave 5 be really short, since under Elliott’s rules wave 3 cannot be shorter than both wave 1 and wave 5. To my mind, that makes counting the rise as one degree lower, wave 1 of Subbitsy degree, a far more likely count.
The rise I called Subbitsy 1 could also be an X wave separating corrective patterns in an ongoing correction. Sometimes corrections extend by combining two or sometimes three corrective patterns, each pattern being separated from the one before by the X wave. If the rise from today’s decline remains below 3978.50, then the X-wave scenario becomes more likely.
Half an hour before the closing bell. The S&P 500 rose concurrently with today’s announcement by the Federal Open Market Committee. In Elliott wave terms, the rise was a 3rd wave internal to wave 5 of Minuscule degree. Third waves tend to be energetic and are often the longest wave in the direction of a trend. It will be followed by a 4th wave correction and then a 5th wave push to the upside which will compute the parent wave, Minuscule 5.I’ve updated the chart below.
10:15 a.m. New York time
What’s happening now? The S&P 500 E-mini futures continue to work through a very low level correction within the final upward push of a slightly higher level. So far yesterday’s high of 3970.75 stands.
What does it mean? There’s more upside ahead. The rise from March 15 will be followed by by a correction of the rise that began on March 8, from 3816.25.
What are the alternatives? A decline below 3816.25 would mean something beyond a simple correction is going on.
[S&P 500 E-mini futures at 3:30 p.m., 30-minute bars, with volume]
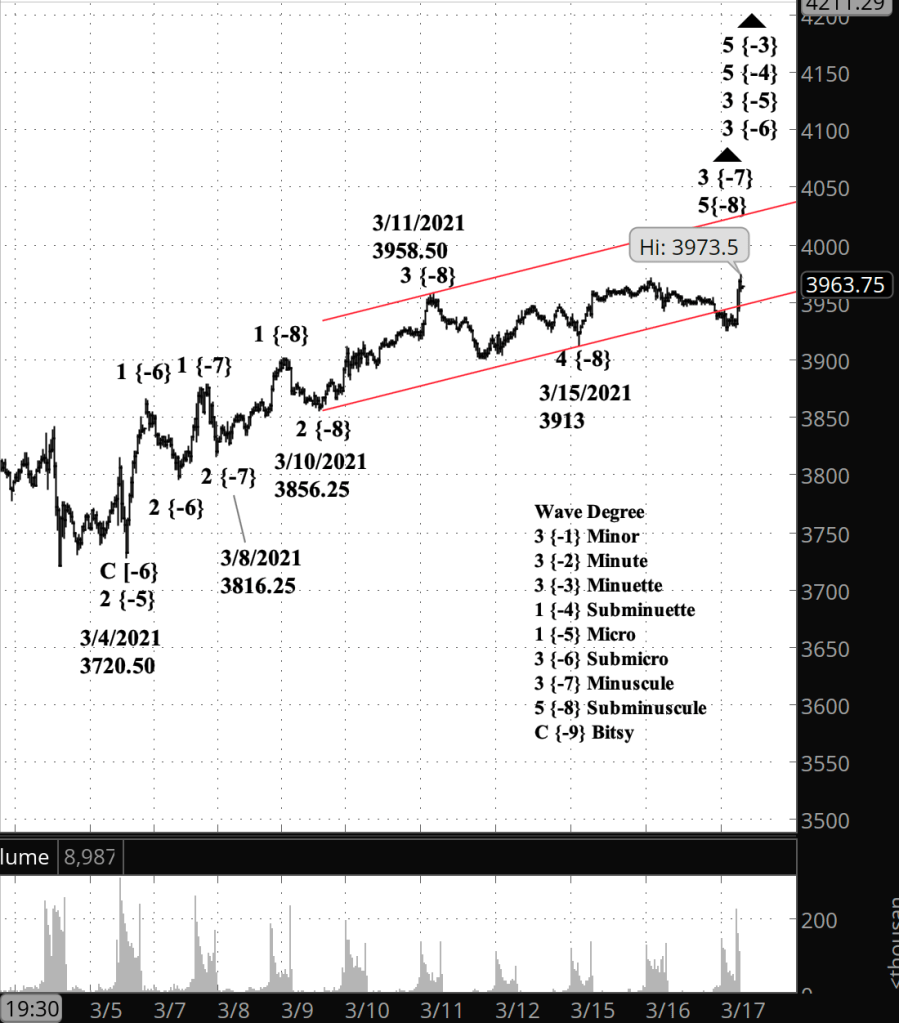
What does Elliott wave theory say? The rise from March 15 is wave 5 of Subminuscule degree, and the parent is wave 3 of Minuscule degree which began on March 8. A trend channel for Minuscule degree shows Subminuscule wave 5 has the potential to reach into 4030s or higher, perhaps significantly higher if it extends, or perhaps somewhat lower it truncates.
Half an hour before the closing bell. The S&P 500 rose to a high of 3970.75 on the futures, 3981.04 on the index, and then dropped off slightly as the price formed the internal structure of wave 5 of Subminuscule degree, which began yesterday. The end of Subminuscule 5 will mark the end of Minuscule 3, which will be followed by a shallow correction. I’ve updated the chart below.
9:40 a.m. New York time
What’s happening now? The S&P 500 E-mini futures reached 3966 in the uptrend that began March 10 from 3856.25.
What does it mean? Internally, the uptrend is in its final wave, which will be followed by a shallow correction. There’s no guidance on how far a final wave in a trend can go, so there’s no way of setting an upper price target.
I have no alternative analysis today.
[S&P 500 E-mini futures at 3:31 p.m., 25-minute bars, with volume]
What does Elliott wave theory say? The present rise is wave 5 of Subminuscule degree. Its completion will also mark the end of wave 3 of Minuscule degree, which began on March 10 from 3856.25. All of this is happening within wave 3 of Submicro degree, and up the ladder, wave 3 of Micro degree, wave 5 of Subminuette degree and wave 5 of Minuette degree. So at this point we’re tracking quite small degrees, where movements are a matter of days, not weeks, and certainly not the years and decades seen on a longer-term chart.
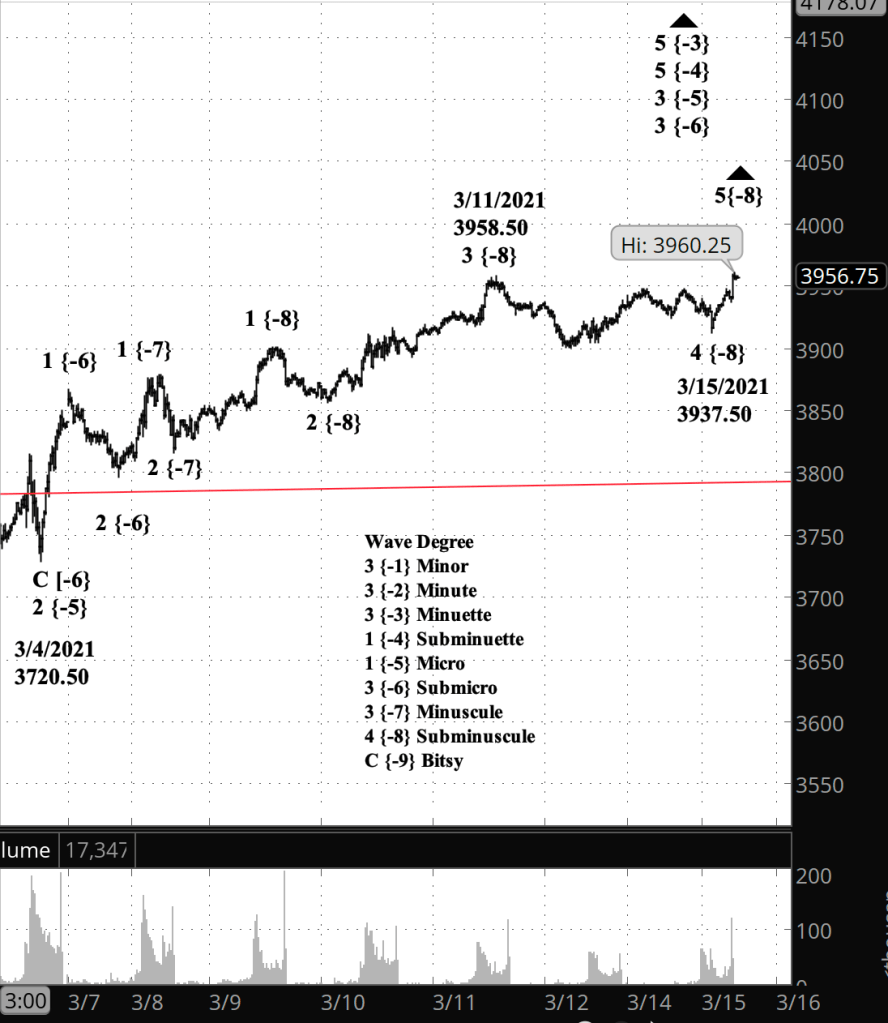
After the closing bell. The S&P 500 — index and futures — rose above the high of March 11, confirming my principle analysis that wave 5 of Subminuscule degree has begun. The 5th wave has so far reached 3960.25 on the futures and 3970.08 on the index. In the futures chart below I’ve updated the wave numbering to reflect the resumption of the upward trend post-correction.
[S&P 500 E-mini futures at 4:06 p.m., 20-minute bars, with volume]
3:30 p.m. New York time
Half an hour before the closing bell. The S&P 500’s shallow correction continues. Looking ahead, I expect another slight decline to wrap up wave C of Bitsy degree, and then, under the principle analysis, a rise above the March 11 high of 3958.50 (the end of Subminuscule wave 3), or under the alternative analysis, a separator X wave up into the 3940s, followed by another corrective pattern.I’ve updated the chart.
9:50 a.m. New York time
What’s happening now? The S&P 500 E-mini futures have continued their shallow downward correction since trading resumed Sunday evening and have entered the third leg of a three-wave pattern.
What does it mean? The end of the third wave often marks the end of the correction and the resumption of a rise to new highs.
What are the alternatives? Corrections sometimes have more than one three-wave corrective pattern, a compound structure. If that’s the case with this correction, expect the end of the final wave to be followed by a rising separator wave, followed by a second corrective pattern.
[S&P 500 E-mini futures at 3:30 p.m., 20-minute bars, with volume.]
What does Elliott wave theory say? The correction is wave 4 of Subminuscule degree within — several degrees higher — wave 3 of Micro degree. Within Subminuscule 4, the price has entered wave C of Bitsy degree. Under my principle analysis, the end of Bitsy wave C will also be the end of the Subminuscule 4 correction and will be followed by the rising wave 5 of Subminuscule degree. If the correction turns out to be a compound structure, the rising separator will be an X wave of Bitsy degree.

You must be logged in to post a comment.