Shares Trading Rules

I’ve added an updated shares section to the Trading Rules drop-down on the menu. Here’s what it says:

Lower Risk: Shares

Shares are considered to be lower risk than options because they can be traded without leverage and are generally have lower volatility.

On the other other hand, options positions can be positioned in a way that limits the possible loss if the price moves against the trader. Shares can drop to zero. I’ve had it happen.

The one tool that shares offer to mitigate that risk is the stop-loss; setting a price at which shares will be sold if the market price reaches that level.

I use a trailing-stop loss. For long shares, if I set a, say, 3% stop-loss, and the price of the shares rises, then the stop-loss will also rise, reamining 3% below the peak price.

I will use 3% occasionally as a very short-term insurance to limit loss, but my normal practice is to give shares room to maneuver. For that purpose, I use a 20% trailing stop. I’ve based based choice on three research papers:

Han, Yufeng and Zhou, Guofu and Zhu, Yingzi, Taming Momentum Crashes: A Simple Stop-Loss Strategy (September 24, 2016). Available at SSRN: https://ssrn.com/abstract=2407199 or http://dx.doi.org/10.2139/ssrn.2407199

Yusupov, Garib and Shorrason, Bergsveinn, Performance of Stop-Loss Rules vs. Buy-and-Hold Strategy (2009). Available at Lund University: https://www.lunduniversity.lu.se/lup/publication/1474565

Kaminski, Kathryn and Lo, Andrew W., When Do Stop-Loss Rules Stop Losses? (January 3, 2007). EFA 2007 Ljubljana Meetings Paper. Available at SSRN: https://ssrn.com/abstract=968338 or http://dx.doi.org/10.2139/ssrn.968338

By Tim Bovee, August 22, 2021, Portland, Oregon

Disclaimer

Tim Bovee, Private Trader tracks the analysis and trades of a private trader for his own accounts. Nothing in this blog constitutes a recommendation to buy or sell stocks, options or any other financial instrument. The only purpose of this blog is to provide education and entertainment.

No trader is ever 100 percent successful in his or her trades. Trading in the stock and option markets is risky and uncertain. Each trader must make trading decisions for his or her own account, and take responsibility for the consequences.

License
Creative Commons License

All content on Tim Bovee, Private Trader by Timothy K. Bovee is licensed under a Creative Commons Attribution-ShareAlike 4.0 International License.

Based on a work at www.timbovee.com.
SP500 Analysis

3:30 p.m. New York time

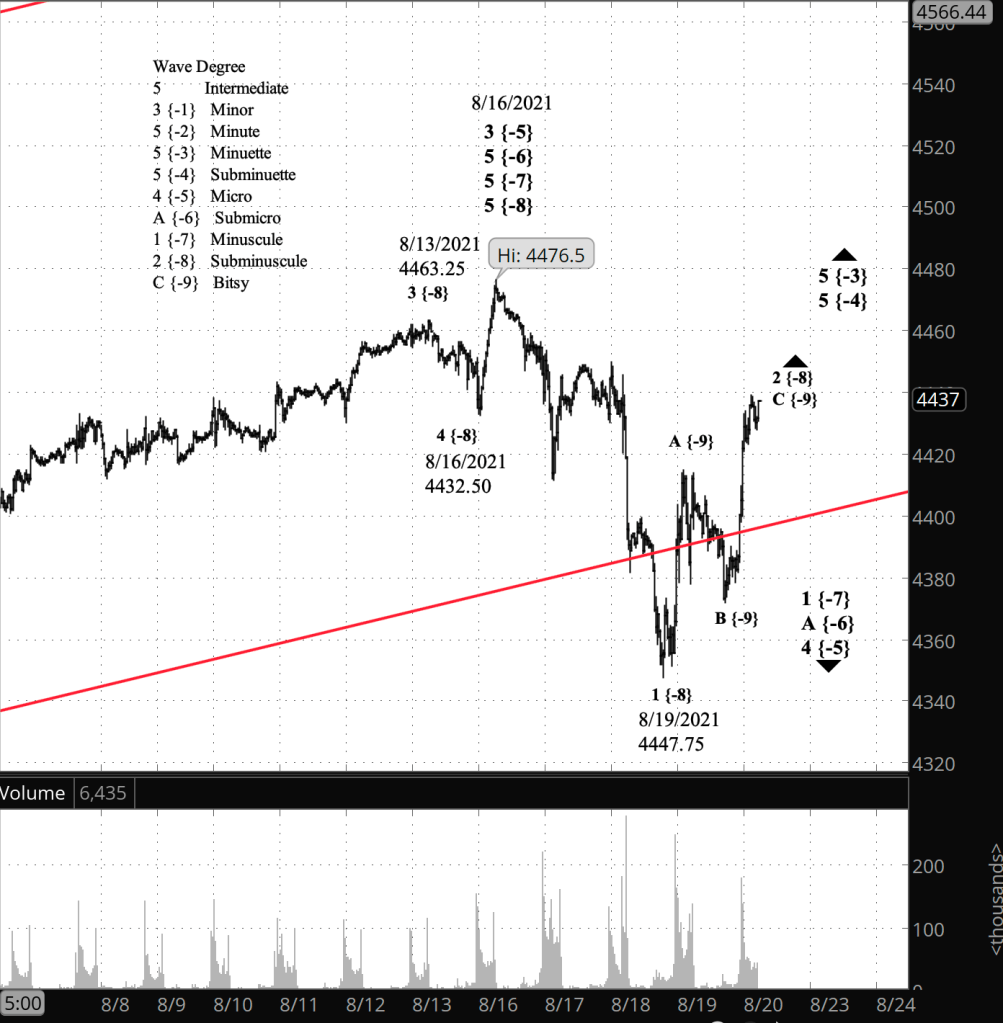
Half an hour before the closing bell. The S&P 500 continued its rise during the day. No change in the analysis. Chart updated.

9:40 a.m. New York time

What’s happening now? The S&P 500 E-mini futures rose overnight in the third leg of an upward correction within a larger downtrend.

What does it mean? Corrections of this sort tend to come with three legs, and so this low-level correction is nearing an end.

What is the alternative? Corrections sometimes take more complex patterns, and so although the third leg typically marks the final stage of a corrective pattern, this low-level correction could prove to be complex.

[S&P 500 E-mini futures at 3:30 p.m., 30-minute bars, with volume]

What does Elliott wave theory say? Under my principal analysis, the rise is wave C of Bitsy degree within wave 2 of Subminuscule degree within wave 1 of Minuscule degree wave within an 4th-wave downward correction of Submicro degree that began on July 19. That 4th wave will be followed by a Submicro wave 5 to the upside that will reach new heights. Closer in, the present wave 2 of Subminuscule degree will be followed by a powerful 3rd wave to the downside.

Although 2nd waves tend to take the simple three-wave form, there is nothing in the rules of Elliott wave analysis that prevents a 2nd wave from extending in more complex patterns. That applies to wave 2 the Subminuscule degree. The higher Submicro degree is a 4th wave, and such corrections often display complex patterns. So Submicro wave 4 potentially could take some time to reach completion.

Learning and other resources. Elliott wave analysis provides context, not prophecy. As the 20th century semanticist Alfred Korzybski put it in his book Science and Sanity (1933), “The map is not the territory … The only usefulness of a map depends on similarity of structure between the empirical world and the map.” And I would add, we can judge that similarity of structure only after the fact.

See the menu page Analytical Methods for a rundown on where to go for information on Elliott wave analysis.

By Tim Bovee, Portland, Oregon, August 20, 2021

Disclaimer

Tim Bovee, Private Trader tracks the analysis and trades of a private trader for his own accounts. Nothing in this blog constitutes a recommendation to buy or sell stocks, options or any other financial instrument. The only purpose of this blog is to provide education and entertainment.

No trader is ever 100 percent successful in his or her trades. Trading in the stock and option markets is risky and uncertain. Each trader must make trading decisions for his or her own account, and take responsibility for the consequences.

License
Creative Commons License

All content on Tim Bovee, Private Trader by Timothy K. Bovee is licensed under a Creative Commons Attribution-ShareAlike 4.0 International License.

Based on a work at www.timbovee.com.
SP500 Analysis

3:30 p.m. New York time

Half an hour before the closing bell. The S&P 500 completed a downward movement of five waves and began an upward movement that so far has completed one wave, and is presently in a counter-trend declining second wave. The structure is within wave 1 of Minuscule degree within wave A of Submicro degree within wave 4 of Micro degree. I’ve updated the top chart. No change to the analysis.

10:30 a.m. New York time

What’s happening now? In the last half hour of trading yesterday, the S&P 500 took a dive from 4445.50 on the E-mini futures, falling nearly 100 points before coming to rest early this morning at 4347.25, below the lower boundary of the price channel marking the rise from March 25.

What does it mean? The strength of the decline suggests the beginning of a reversal from a significant top, and I’ve redone my analysis from yesterday to fit that scenario.

What’s the alternative? However, although the price burst through the lower boundary of the price channel, it wasn’t so deep a fall as to break all norms, and it could well be a dramatic correction within a continuing uptrend. Also, from the larger point of the view of the rise that began in February of last year, this drop is barely a dent in the uptrend.

Charts. I’m doing two today, a near-term chart (top chart), showing the re-analysis of the rise from July 19, and a long-term chart (bottom chart) showing the decline from yesterday within the context of the Diagonal Triangle that began in December 2018.

[S&P 500 E-mini futures at 3:30 p.m., 70-minute bars, with volume]
[S&P 500 index at 10:26 a.m., 2-day bars]

What does Elliott wave theory say? For the principal analysis to work, the peak of August 16, at 4476.50 on the futures, 4480.26 on the index.

For the sharp from yesterday and overnight to work as the beginning of a significant downtrend, the August 16 peak must mark the end of a 5th wave, rather than the 3rd wave I had in yesterday’s analysis. I accomplished that by recounting the rise from July 19 to July 26, breaking it up into wave 1 through 3 of Minuscule degree, rather than a single wave 1. The waves are poorly defined in this energetic movement, but the recount can be made to work.

Under the principal scenario, in ascending order, the August 16 peak marked the end of wave 5 of Subminuscule degree within wave 5 of Minuscule degree within wave 5 of Submicro degree within wave 3 of Micro degree, which began on May 19 from 4055.50.

So the decline from the August 16 high is wave 4 of Micro degree, a correction within a series of ongoing uptrends, in ascending order: Wave 5 of Subminuette degree within wave 5 of Minuette degree within wave 5 of Minute degree within waver 3 of Minor degree within 5th waves of Intermediate, Primary and Cycle degrees within wave 5 of Supercycle degree, which began in 1932.

Under the principal analysis, wave 4 of Micro degree will be followed by a push to new highs as wave 5 of Micro degree and its parent waves, up to Minor degree. Within the Diagonal Triangle that began in December 2018, we are now on wave 3 of Minor degree. That 3rd wave began from the early pandemic low of 2191.86 on February 23, 2020. A Diagonal Triangle has five waves altogether, and Minor wave 3 is not yet complete. When it is, Minor wave 4 will work its way down to the lower boundary of the Diagonal Triangle, which is presently just above 2000 and declining.

Under the alternative analysis, the August 16 peak remains as the end of a low-degree 3rd wave.

Learning and other resources. Elliott wave analysis provides context, not prophecy. As the 20th century semanticist Alfred Korzybski put it in his book Science and Sanity (1933), “The map is not the territory … The only usefulness of a map depends on similarity of structure between the empirical world and the map.” And I would add, we can judge that similarity of structure only after the fact.

See the menu page Analytical Methods for a rundown on where to go for information on Elliott wave analysis.

By Tim Bovee, Portland, Oregon, August 19, 2021

Disclaimer

Tim Bovee, Private Trader tracks the analysis and trades of a private trader for his own accounts. Nothing in this blog constitutes a recommendation to buy or sell stocks, options or any other financial instrument. The only purpose of this blog is to provide education and entertainment.

No trader is ever 100 percent successful in his or her trades. Trading in the stock and option markets is risky and uncertain. Each trader must make trading decisions for his or her own account, and take responsibility for the consequences.

License
Creative Commons License

All content on Tim Bovee, Private Trader by Timothy K. Bovee is licensed under a Creative Commons Attribution-ShareAlike 4.0 International License.

Based on a work at www.timbovee.com.
SP500 Analysis

3:30 p.m. New York time

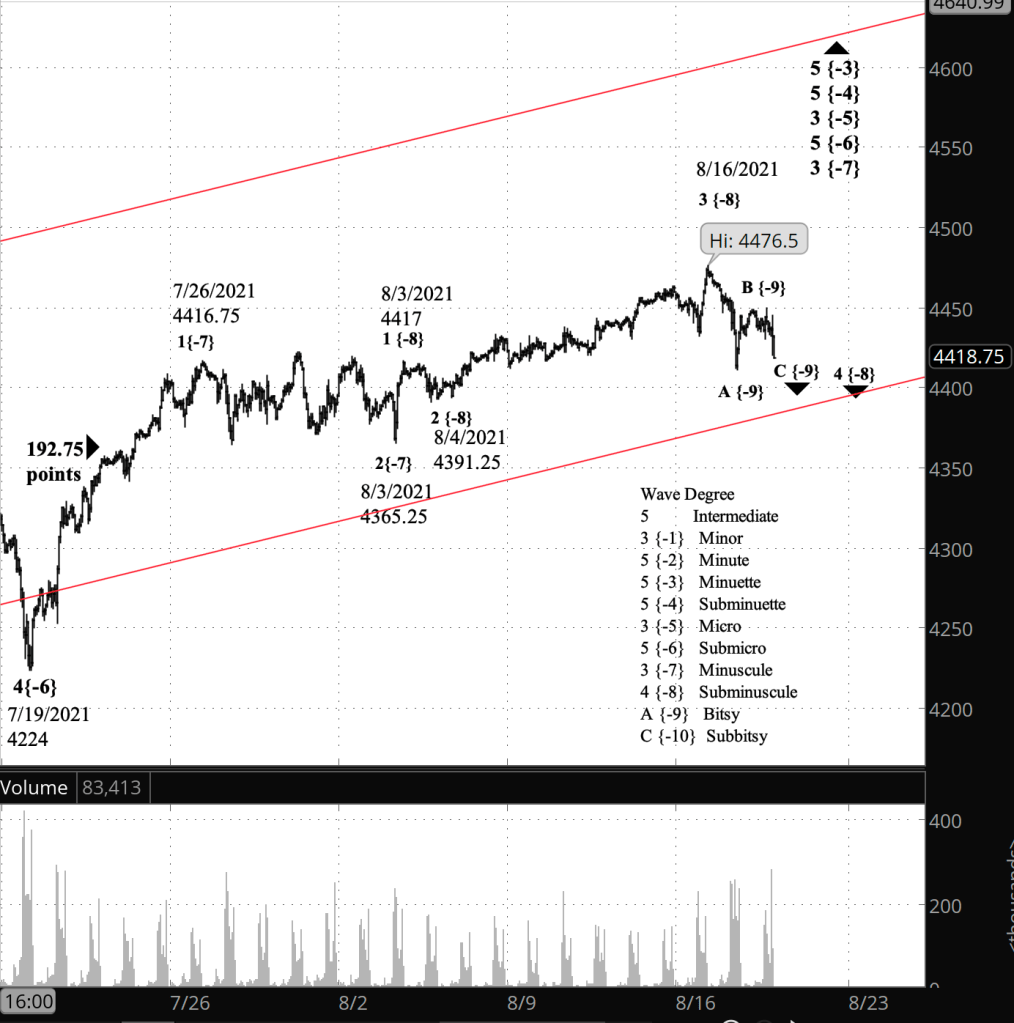
Half an hour before the closing bell. The S&P 500 fell slightly during the day, a movement that, under my principal analysis, is the 3rd leg of a low-level correction. No change to the analysis. Chart updated.

9:35 a.m. New York time

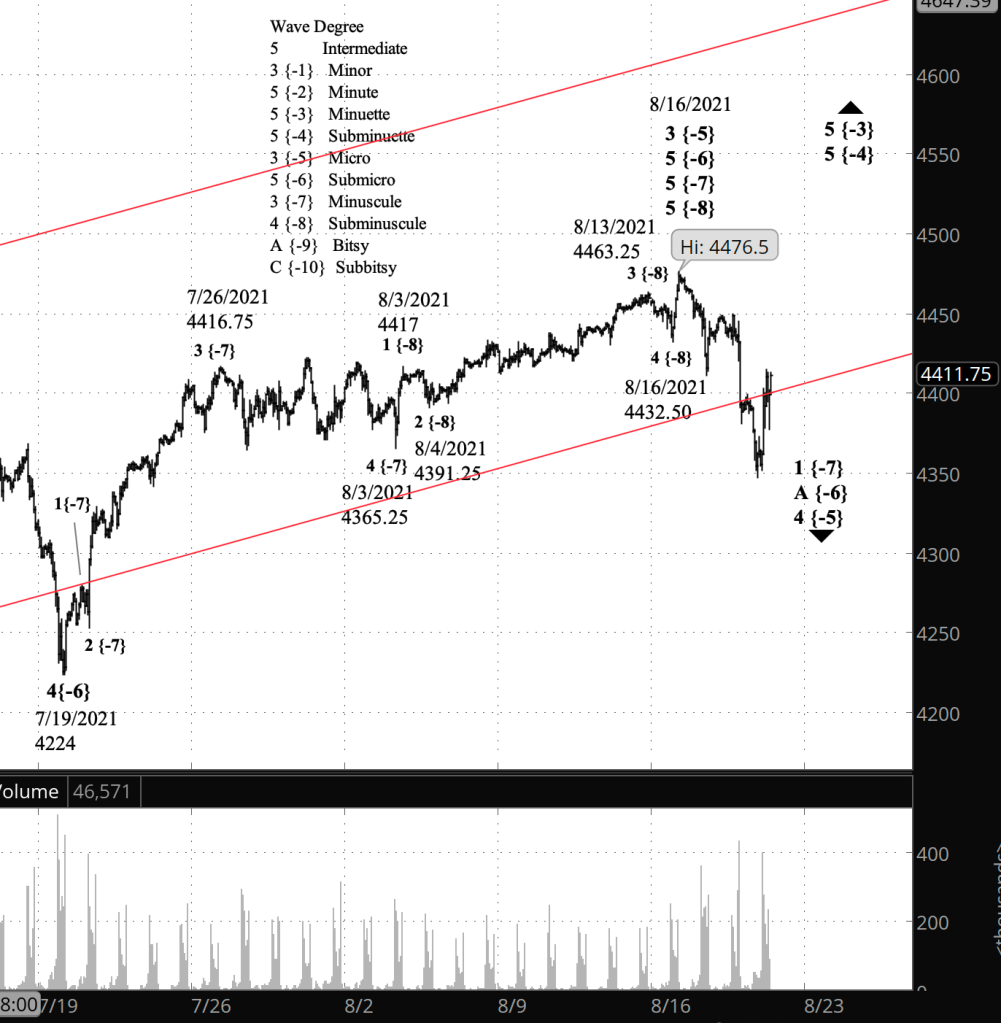
What’s happening now? The S&P 500 E-mini futures completed the first leg of a downward correction of the rise that began August 4, and the subsequent small rise completed the second leg, which moves opposite the trend of the correction.

What does it mean? The shallow correction will be followed by a renewal of the uptrend that began on July 19 that will bring the price to new highs.

What’s the alternative? The fall and reversal from the August 16 high may be a first leg within the first leg of the correction. I.e., it may be one level smaller than my principle analysis shows. This has no impact on the larger analysis of more upside ahead.

[S&P 500 E-mini futures at 3:30 p.m., hourly bars, with volume]

What does Elliott wave theory say? By my principal analysis, the high of August 16 ended wave 3 of Subminuscule degree and marked the start of Subminuscule wave 4. The first wave down, wave A of Bitsy degree, had three poorly delineated subwaves, indicating that the corrective pattern will be a Flat. The completion of Subminuscule wave 4 will be followed by a rising Subminuscule wave 5, which will carry the price to new heights.

My alternative analysis pushes wave A down one degree, to the Subbitsy level, making it internal to wave A of Bitsy degree. From the point of view of the aesthetics of the chart, it’s an attractive prospect, since it would provide a clear delineation within Bitsy wave A. I can easily envision promoting this count to the principal analysis.

Learning and other resources. Elliott wave analysis provides context, not prophecy. As the 20th century semanticist Alfred Korzybski put it in his book Science and Sanity (1933), “The map is not the territory … The only usefulness of a map depends on similarity of structure between the empirical world and the map.” And I would add, we can judge that similarity of structure only after the fact.

See the menu page Analytical Methods for a rundown on where to go for information on Elliott wave analysis.

By Tim Bovee, Portland, Oregon, August 18, 2021

Disclaimer

Tim Bovee, Private Trader tracks the analysis and trades of a private trader for his own accounts. Nothing in this blog constitutes a recommendation to buy or sell stocks, options or any other financial instrument. The only purpose of this blog is to provide education and entertainment.

No trader is ever 100 percent successful in his or her trades. Trading in the stock and option markets is risky and uncertain. Each trader must make trading decisions for his or her own account, and take responsibility for the consequences.

License
Creative Commons License

All content on Tim Bovee, Private Trader by Timothy K. Bovee is licensed under a Creative Commons Attribution-ShareAlike 4.0 International License.

Based on a work at www.timbovee.com.
SP500 Analysis

3:30 p.m. New York time

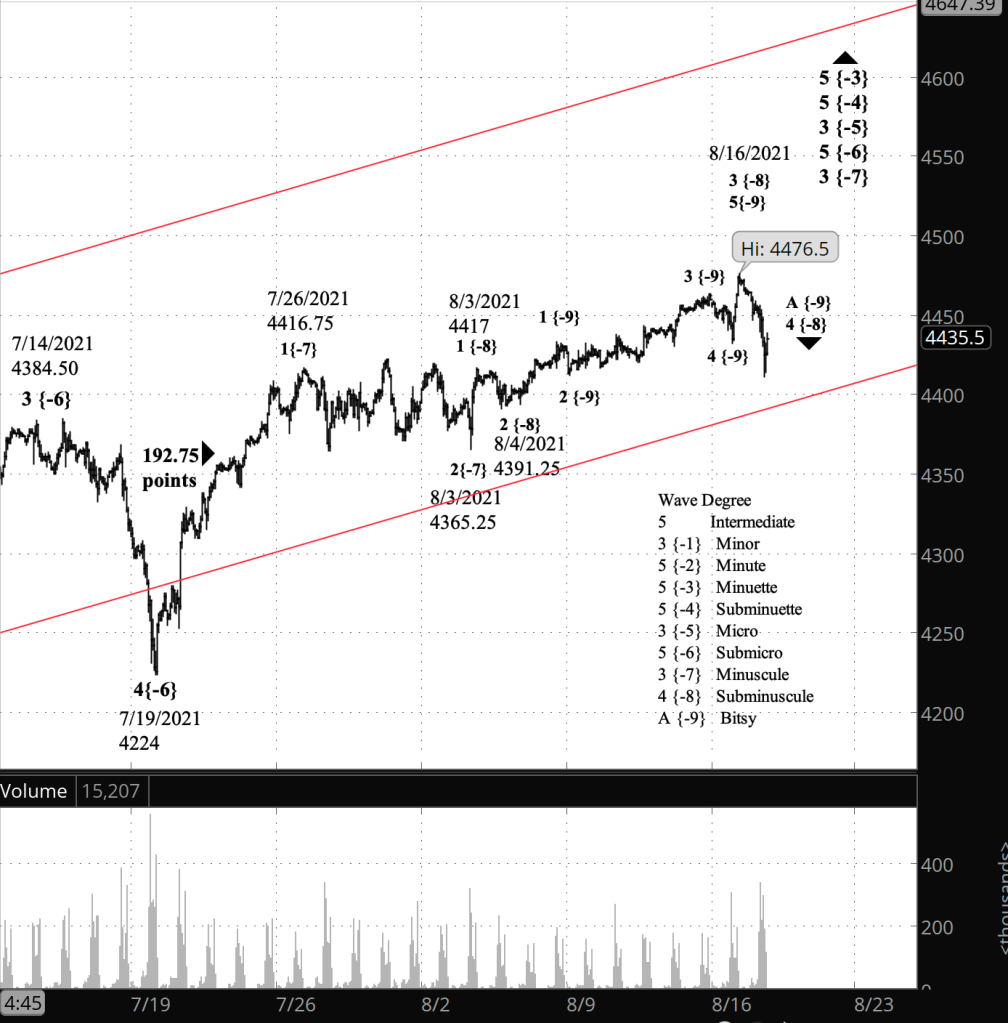
Half an hour before the closing bell. The S&P 500 continued a sharp from yesterday’s peak, as a downward correction took hold. The decline is wave A of Bitsy degree, the first wave of what will probably be a Flat correction, wave 4 of Subminuscule degree. I’ve updated the chart.

2:20 p.m. New York time

My Trades. I’ve exited my bear call options spread position on FXI for a 182% profit and have updated the analysis with results.

9:40 a.m. New York time

What’s happening now? The S&P 500 E-mini futures fell from yesterday’s peak of 4476.50

What does it mean? By my principal count the decline is the beginning of a correction of the rise that began August. 4 from 4391.25 that will most likely be a shallow one.

What’s the alternative? The decline may be a correction at a smaller level within an ongoing rise that began yeterday.

[S&P 500 E-mini futures at 3:30 p.m., 75-minute bars, with volume]

What does Elliott wave theory say? By my principal count, yesterday’s high marked the end of wave 5 of Bitsy degree and of its parent, wave 3 of Subminuscule degree. The subsequent correction, wave 4 of Subminuscule degree, will be a shallow, sideways movement, as is common with 4th waves.

By the alternative count, wave 5 of Bitsy degree is continuing its uptrend, and the decline is a correction of Subbitsy degree — one degree lower — within Bitsy wave 5.

All of this is happening within wave 3 of Minuscule degree, which began on August 3, within wave 5 of Submicro degree, which began on July 19 from 4224.

Completion of Minuscule wave 3 will mark the start of a 4th wave correction, most likely shallow but of greater significance than the recent pullbacks. The last Minuscule degree correction was wave 2, lasting from July 26 to August 3.

Learning and other resources. Elliott wave analysis provides context, not prophecy. As the 20th century semanticist Alfred Korzybski put it in his book Science and Sanity (1933), “The map is not the territory … The only usefulness of a map depends on similarity of structure between the empirical world and the map.” And I would add, we can judge that similarity of structure only after the fact.

See the menu page Analytical Methods for a rundown on where to go for information on Elliott wave analysis.

By Tim Bovee, Portland, Oregon, August 17, 2021

Disclaimer

Tim Bovee, Private Trader tracks the analysis and trades of a private trader for his own accounts. Nothing in this blog constitutes a recommendation to buy or sell stocks, options or any other financial instrument. The only purpose of this blog is to provide education and entertainment.

No trader is ever 100 percent successful in his or her trades. Trading in the stock and option markets is risky and uncertain. Each trader must make trading decisions for his or her own account, and take responsibility for the consequences.

License
Creative Commons License

All content on Tim Bovee, Private Trader by Timothy K. Bovee is licensed under a Creative Commons Attribution-ShareAlike 4.0 International License.

Based on a work at www.timbovee.com.
SP500 Analysis

3:30 p.m. New York time

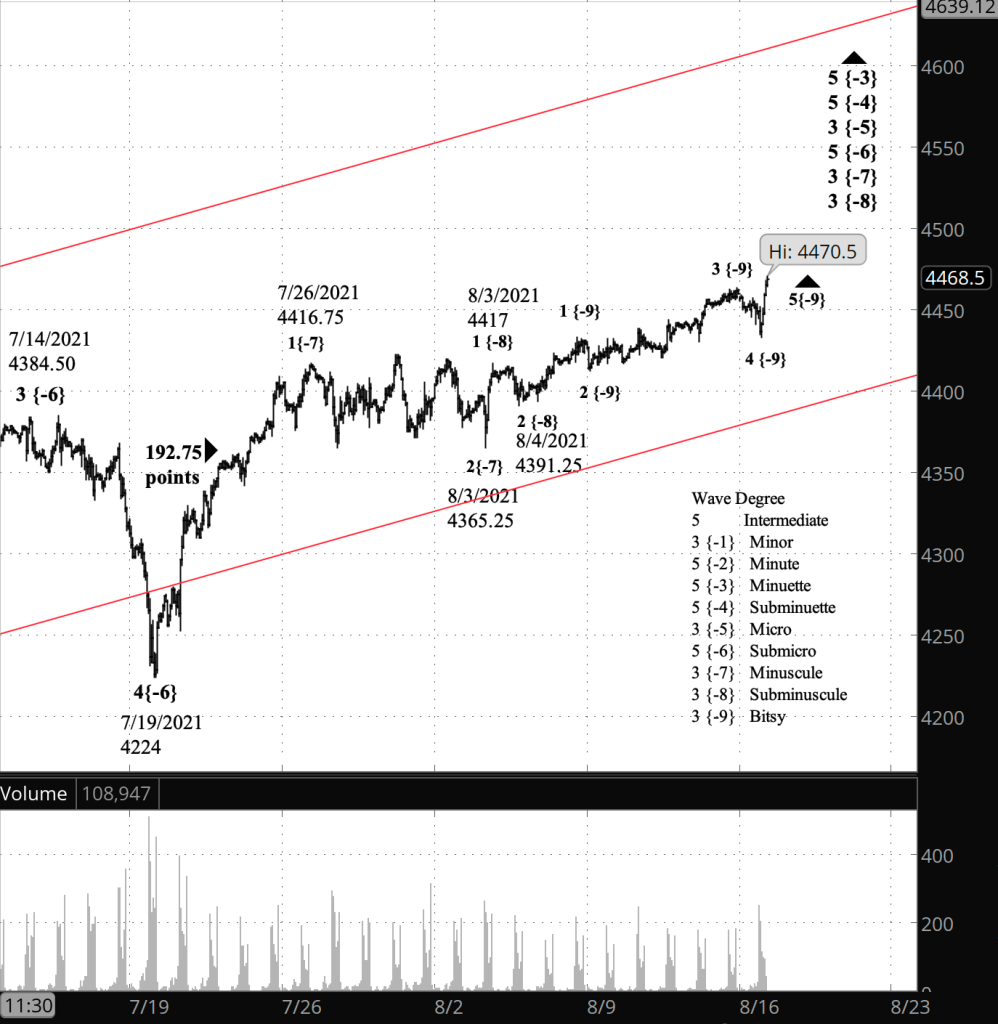
Half an hour before the closing bell. A low-level downward correction of the S&P 500 that began with Friday’s high was completed today. The correction of was 4 of Bitsy degree, and the subsequent Bitsy wave 5 has risen to new heights. Bitsy 5 is the last leg of uptrending wave 3 of Subminuscule degree. I’ve updated the chart.

9:55 a.m. New York time

What’s happening now? The S&P 500 E-mini futures pulled back slightly from Friday’s peak, 4463.25, in an uptrend that began August 4 from 4391.25

What does it mean? The pullback is a low level correction within a series of nested uptrends that began on July 19 from 4224 following a 160-point decline, within a series of nested uptrends of still larger degree.

What’s the alternative? None regarding the nature of the rise. There are low-level labeling issues, which I discuss in detail in the Elliott wave theory section, below.

[S&P 500 E-mini futures at 3:30 p.m., 70-minute bars, with volume]

What does Elliott wave theory say? In ascending order, the low-level correction is wave 4 of Bitsy degree — a very low level indeed — within wave 3 of Subminuscule degree degree, which began on August 4, within wave 3 of Minuscule degree, which began on August 3, within wave 5 of Submicro degree, which began on July 19 from 4224.

The whole structure from July 19 begins with an unnaturally long Minuscule wave 1 of 192.75 points that ends at 4416.75. From that point, there’s a sideways correction of Minuscule degree that looks more like a 4th wave than a 2nd wave — 2nd waves tend to be of the Zigzag pattern. The correction ended on August 3 and was followed by a Minuscule degree 3rd wave of unnatural shallowness — 3rd waves usually carry a lot of energy, and this 3rd can barely roll out of bed in the morning.

Within Minuscule wave 3, the waves are poorly differentiated, with no powerful 3rd waves in the required positions. Internals like this require the analyst to repeatedly subdivide larger waves into smaller waves. That’s natural in Elliott wave analysis, given the fractal nature of the market’s movements, but it’s not generally this visible.

So, bottom line: I have very little confidence in the internal labelling of waves within Submicro wave 5. What I’ve done is the best I’ve got, but the whole structure could be dismantled a day’s price movement. I’m finding the best way to see the chart is to focus less on the internals of Submicro wave 5 and more on the upper boundary of the Minuette degree price channel drawn in red on the chart, which is the ultimate target of the rise that began March 4 from from 4056.88.

One little gotcha to look out for: Under the rules of Elliott wave analysis, a 3rd wave can’t be the short of the three odd-numbered waves in a trend. Since Minuscule wave 1 is 192.75 points long, Minuscule 3 would to exceed 4558 to be longer than wave 1. My experience has been that the 3rd wave is almost always the longest of the three. If Minuscule 3 falls short of 4558, then the following 5th wave would have to be shorter than wave 3 in order to be in compliance with the rules. If the 5th wave is longer, then it would require a complete recount within Submicro wave 5.

Learning and other resources. Elliott wave analysis provides context, not prophecy. As the 20th century semanticist Alfred Korzybski put it in his book Science and Sanity (1933), “The map is not the territory … The only usefulness of a map depends on similarity of structure between the empirical world and the map.” And I would add, we can judge that similarity of structure only after the fact.

See the menu page Analytical Methods for a rundown on where to go for information on Elliott wave analysis.

By Tim Bovee, Portland, Oregon, August 16, 2021

Disclaimer

Tim Bovee, Private Trader tracks the analysis and trades of a private trader for his own accounts. Nothing in this blog constitutes a recommendation to buy or sell stocks, options or any other financial instrument. The only purpose of this blog is to provide education and entertainment.

No trader is ever 100 percent successful in his or her trades. Trading in the stock and option markets is risky and uncertain. Each trader must make trading decisions for his or her own account, and take responsibility for the consequences.

License
Creative Commons License

All content on Tim Bovee, Private Trader by Timothy K. Bovee is licensed under a Creative Commons Attribution-ShareAlike 4.0 International License.

Based on a work at www.timbovee.com.
SP500 Analysis

3:30 p.m. New York time

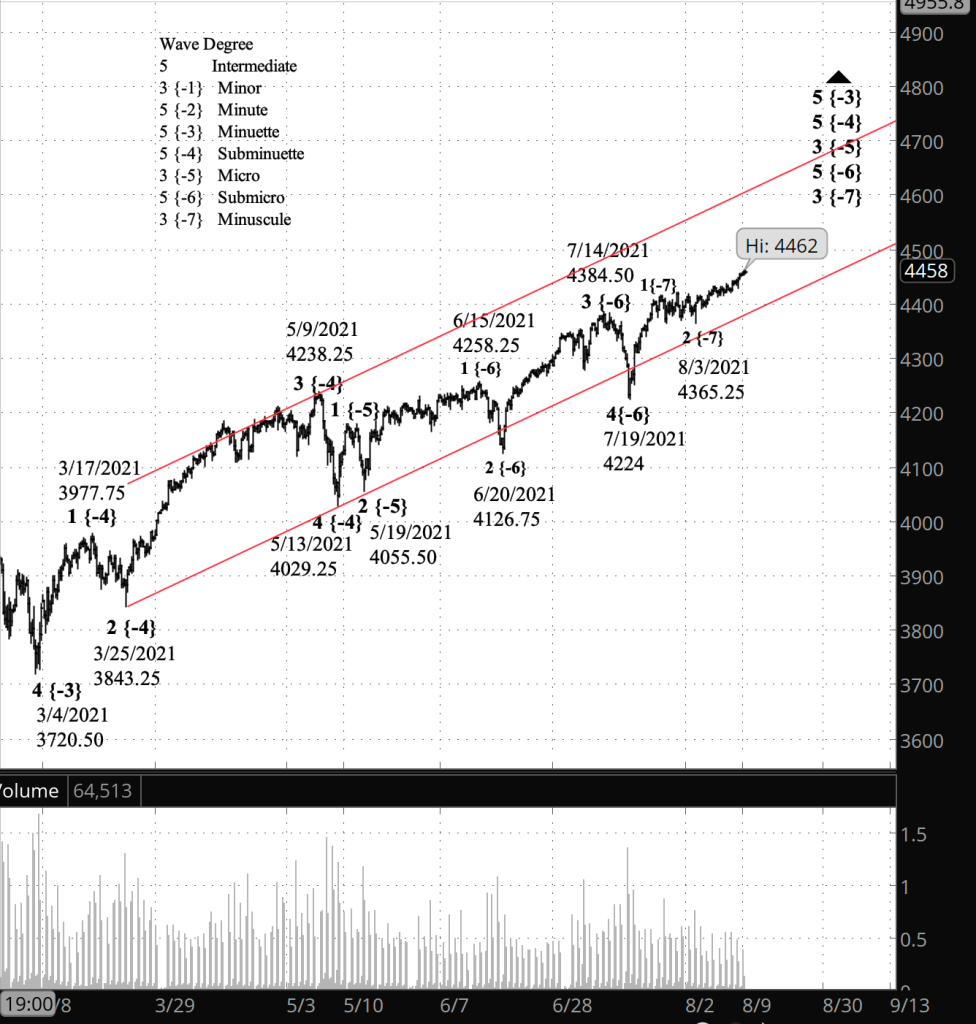
Half an hour before the closing bell. The S&P 500 continued its slow rise, climbing by only a few points during the day. No change in the analysis. I’ve updated the the top chart.

9:40 a.m. New York time

What’s happening now? The S&P 500 E-mini futures continued to rise in overnight trading, reaching a new high of 4460.50 in the minutes after the opening bell. The index also reached a new high, 4466.77, in early trading.

What does it mean? The upper boundary of a price channel that began on March 4 is about 200 points away from the current price, and since that boundary itself is rising, it will be above 4700 if it takes a month for the price to reach that boundary.

What’s the alternative? At this point I have no alternative. The big ambiguity is how long it will take the price rise from March 4 to reach completion. Haven’t a clue, but I discuss the question in the Elliott wave theory section.

[S&P 500 E-mini futures at 3:30 p.m., 6-hour bars, with volume]
[S&P 500 index at 9:36 a.m., 2-day bars]

What does Elliott wave theory say? Price channels, such as the Minuette degree channel on the upper chart, are drawn by connecting the starting points of subwaves. Initially, the Minuette degree channel connected the start of Subminuette waves 1 and 3. A stage two channel became possible when wave 5 began, and the present channel connects the the starting points of waves 3 and 5 as the lower boundary, with the upper drawn as a line at the same angle as the lower boundary, intersecting the end of wave 3.

I’ve found price channels to be good indicators of how high a trend is likely to go, although not a perfect indicator. Sometimes the price will shoot beyond a boundary, and sometimes it will come up short. So I think of a channel boundary as a good guess hedged in by possible extremes.

Today’s high so far is about a third of the way up the distance from the lower boundary to the upper. So Minuette wave 5, which began on May 13 from 4029.25, still has some distance to go. The uptrend that began on Aug. 3 from 4365.25 is wave 3 of Minuscule degree, four degrees down from the Minuette degree that forms the basis for channel. That difference in degree gives plenty of room for the price to rise at a normal pace — it doesn’t require an extraordinary burst of energy to reach the upper boundary. So I expect business as usual, if that phrase has any meaning when applied to the markets.

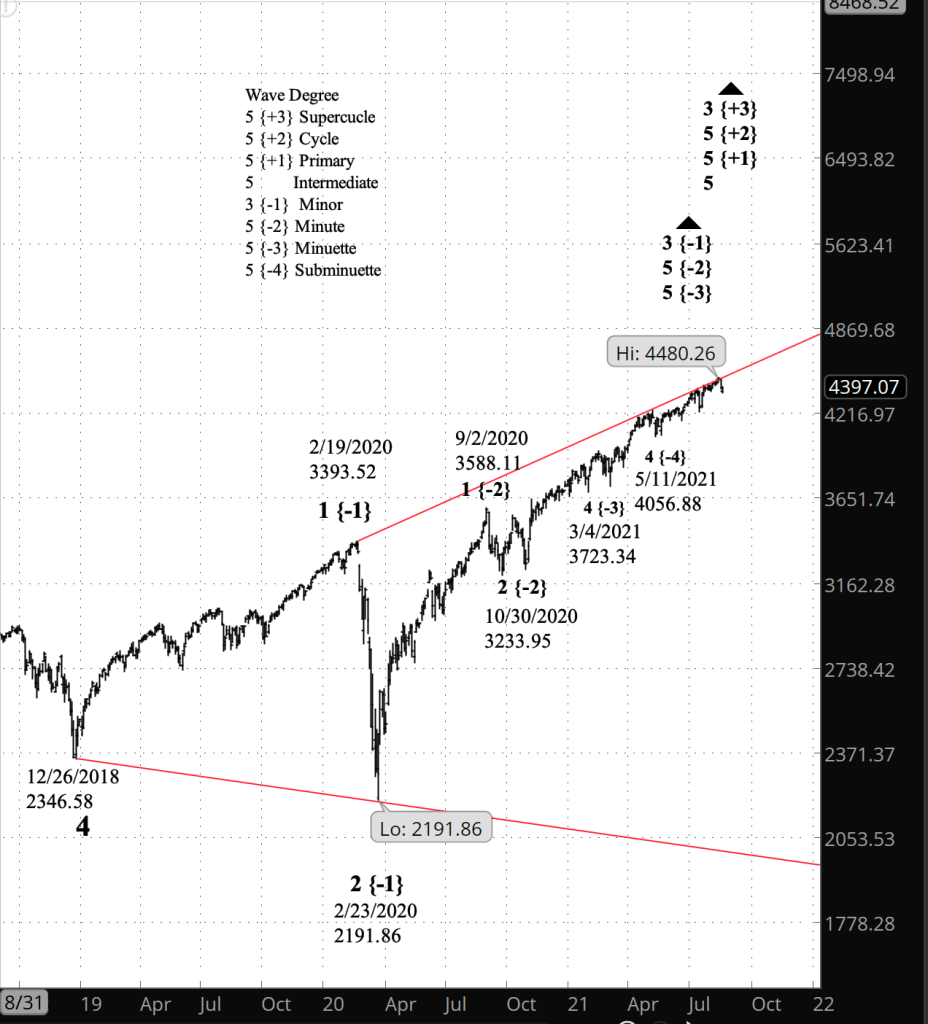
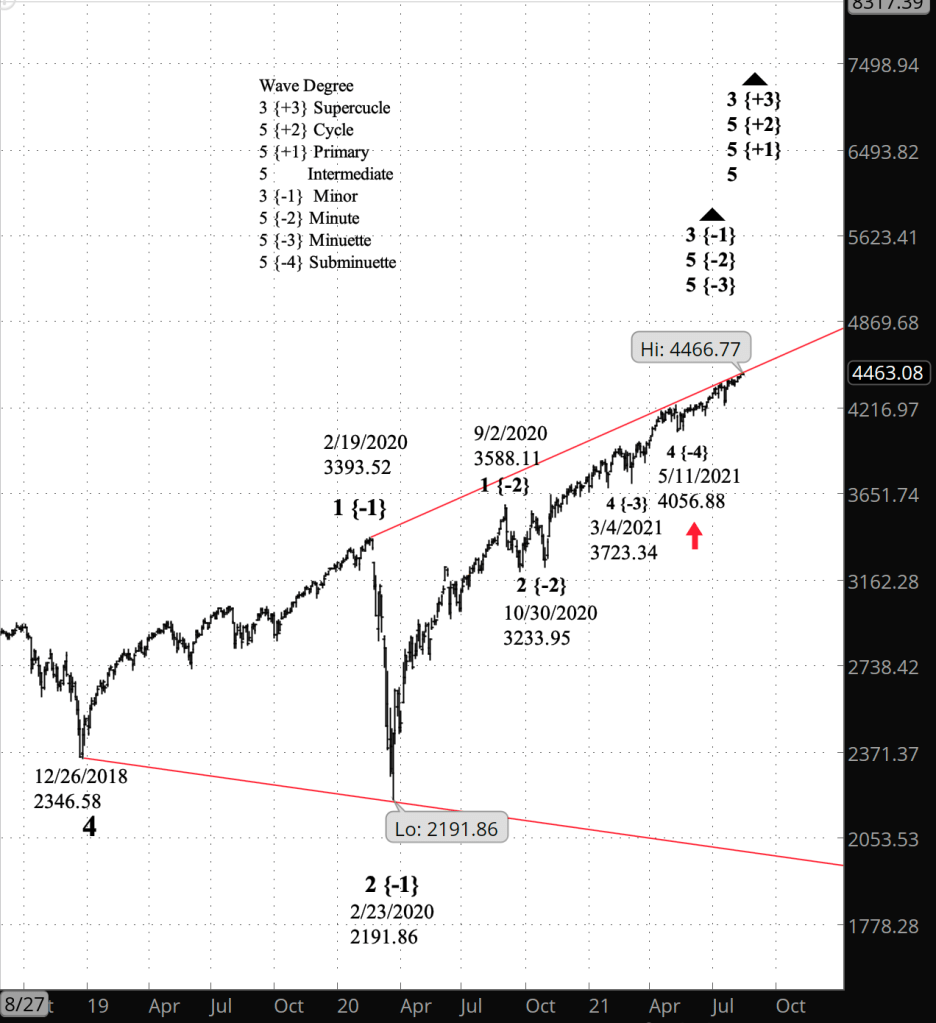
The lower chart shows that all of this is happening within a much larger structure, a Diagonal Triangle based on wave 5 of Intermediate degree that began on December 26, 2018 from 2346.58 on the S&P 500 index. Internally, Intermediate wave 5 is now in its 3rd of five waves — wave 3 of Minor degree. The upper boundary is being defined by the present series of new highs.

The upper chart’s Minuette degree price channel began on May 11, and I’ve marked that point on the lower chart with a red arrow to show the large difference in scale between the Minuette degree channel and the Intermediate degree triangle.

Learning and other resources. Elliott wave analysis provides context, not prophecy. As the 20th century semanticist Alfred Korzybski put it in his book Science and Sanity (1933), “The map is not the territory … The only usefulness of a map depends on similarity of structure between the empirical world and the map.” And I would add, we can judge that similarity of structure only after the fact.

See the menu page Analytical Methods for a rundown on where to go for information on Elliott wave analysis.

By Tim Bovee, Portland, Oregon, August 13, 2021

Disclaimer

Tim Bovee, Private Trader tracks the analysis and trades of a private trader for his own accounts. Nothing in this blog constitutes a recommendation to buy or sell stocks, options or any other financial instrument. The only purpose of this blog is to provide education and entertainment.

No trader is ever 100 percent successful in his or her trades. Trading in the stock and option markets is risky and uncertain. Each trader must make trading decisions for his or her own account, and take responsibility for the consequences.

License
Creative Commons License

All content on Tim Bovee, Private Trader by Timothy K. Bovee is licensed under a Creative Commons Attribution-ShareAlike 4.0 International License.

Based on a work at www.timbovee.com.
SP500 Analysis

3:30 p.m. New York time

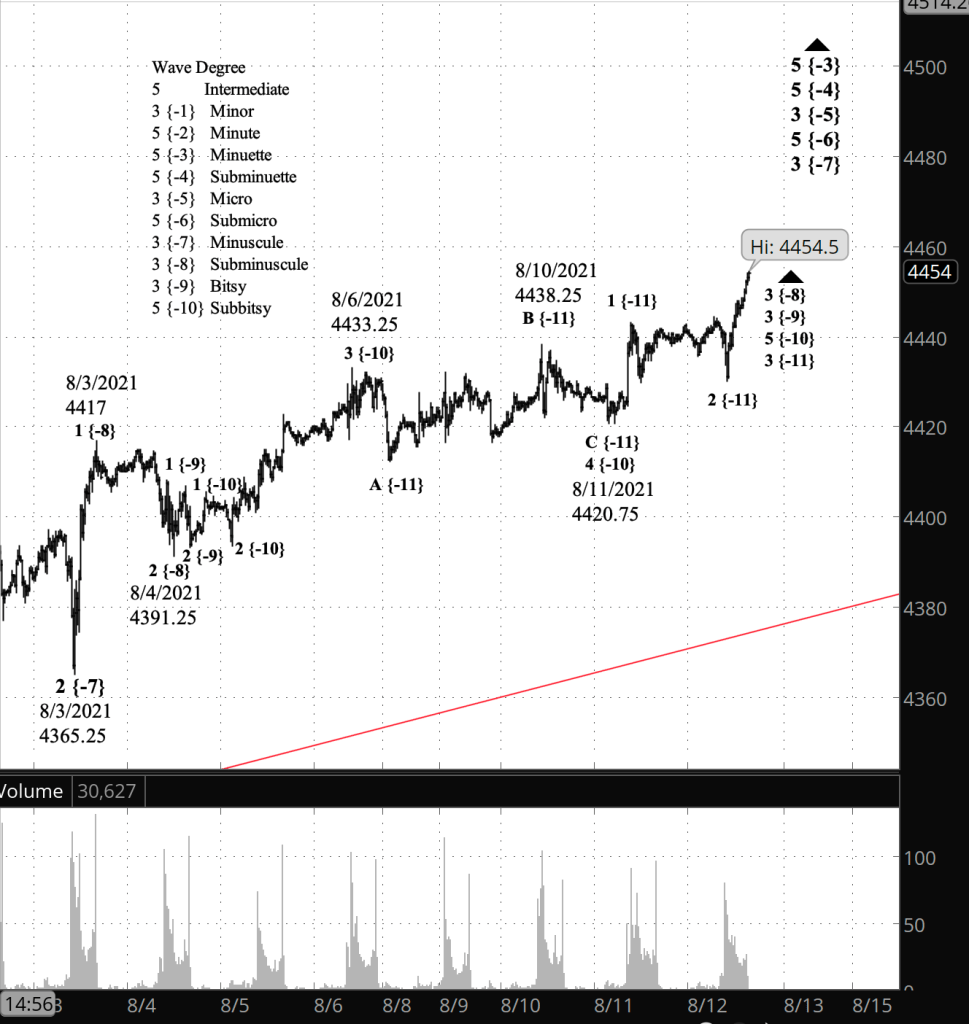
Half an hour before the closing bell. The S&P 500 rose to new heights in what is the middle leg of a low-degree uptrend that began with yesterday’s price reversal. The E-mini futures had reached 4454.50 so far, and the index, 4460.41.

In Elliott wave analysis nomenclature: The present low-degree uptrend is a 3rd wave within wave 5 of Subbitsy degree within wave 3 of Bitsy degree within wave 3 of Subminuscule degree. From this structure, we can next expect a shallow correction within within wave 5 of Subbitsy degree, and then an upward push to completion of the parent wave, Bitsy degree 3. At that higher level, what comes next is a shallow wave 4 correction of Bitsy degree, and then a push higher.

More succinctly. We’re going to have a series of climbs and corrections as the S&P 500 works its way up toward completion of 3rd and 5th waves of increasingly greater degree. This all neatly illustrates the fractal nature of market movements.

“WAIT A BIT, TYEK,” FARAD’N SAID. “THERE ARE WHEELS WITHIN WHEELS HERE.”
—CHILDREN OF DUNE BY FRANK HERBERT (1976)

9:35 a.m. New York time

What’s happening now? The S&P 500 E-mini futures reached a new high, 4444.25, before the opening bell and then dropped back by five points. The index didn’t set a new high at opening; the peak remains at yesterday’s high, 4449.44.

What does it mean? The rise that began August 4 from 4391.25 continues. It is a small part of the end game of a far larger move that began on February 23, 2020 from 2191.86.

What’s the alternative? The new high, like the last one, can be seen as a marker that ties together two corrective patterns within this month’s rise, in a compound structure. I consider this to be the less likely scenario.

[S&P 500 E-mini futures at 3:30 p.m., 20-minute bars, with volume]

What does Elliott wave theory say? A very close-in view on the chart.

Under my principle analysis, the rise from August 4 is wave 5 of Bitsy degree within wave 3 of Subminuscule degree within wave 3 of Minuscule degree, which began July 19 from 4224. The entire structure is set within wave 3 of Minor degree, five degrees higher, which is the third leg of an expanding Diagonal Triangle, wave 5 of Intermediate degree, that began December 26, 2018.

Under my alternative analysis,

Learning and other resources. Elliott wave analysis provides context, not prophecy. As the 20th century semanticist Alfred Korzybski put it in his book Science and Sanity (1933), “The map is not the territory … The only usefulness of a map depends on similarity of structure between the empirical world and the map.” And I would add, we can judge that similarity of structure only after the fact.

See the menu page Analytical Methods for a rundown on where to go for information on Elliott wave analysis.

By Tim Bovee, Portland, Oregon, August 12, 2021

Disclaimer

Tim Bovee, Private Trader tracks the analysis and trades of a private trader for his own accounts. Nothing in this blog constitutes a recommendation to buy or sell stocks, options or any other financial instrument. The only purpose of this blog is to provide education and entertainment.

No trader is ever 100 percent successful in his or her trades. Trading in the stock and option markets is risky and uncertain. Each trader must make trading decisions for his or her own account, and take responsibility for the consequences.

License
Creative Commons License

All content on Tim Bovee, Private Trader by Timothy K. Bovee is licensed under a Creative Commons Attribution-ShareAlike 4.0 International License.

Based on a work at www.timbovee.com.
Bitcoin Analysis

2:25 p.m. New York time

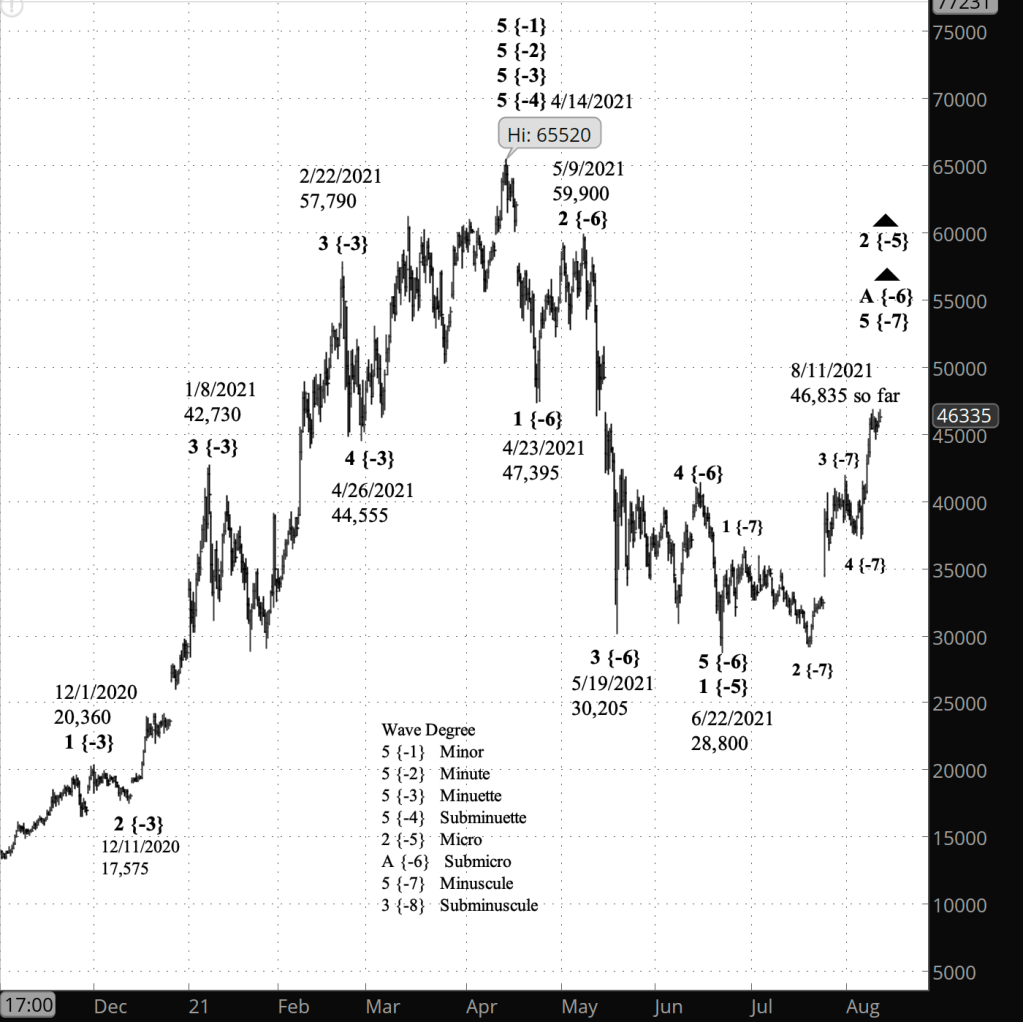
What’s happening now? Bitcoin futures have reached a high of 46,835 so far today, the highest since the present uptrend began on June 22 from 28,800.

What does it mean? The rise is an uptrending movement within a larger upward correction that in turn is part of a still larger downtrend. The completion of the present uptrend will be followed by a downward movement that will remain above 28,800, and then another upward movement that will complete the correction. That final upward movement will remain below the April 14 peak, 65,520.

What’s the alternative? The June 22 low can be counted as the end of the first leg in a downward correction, to be followed by an upward movement and then a movement still lower. The correction will be followed by a rise that will be above the April 14 peak of 65,520, perhaps significantly higher.

[Bitcoin futures at 2:22 p.m., 8-hour bars]

What does Elliott wave theory say? By my principle count, the June 22 low completed wave 1 of Micro degree, part of a major downtrend that began with the peak on April 14 with the end of wave 5 of Micro degree. Wave 2 of Micro degree is underway, and internally is nearing the end of wave A of Submicro degree, a five-wave rising structure within a Zigzag correction. Submicro A appears to be in Minuscule wave 5, the final wave of the structure, and will be followed by wave B of Submicro degree to the downside and then a Submicro wave C that will move beyond the A-wave’s peak. All of that will be followed by wave 3 of Micro degree, a significant decline to new lows.

By my alternative count, the April 14 peak ended wave 3 of Micro degree and the subsequent decline is wave A of Submicro degree within wave 4 of Micro degree, a downward correction that is most likely a Zigzag, since the A wave clearly has five subwaves. The rise that began June 22 is wave B of Submicro degree. Under this scenario, the completion of wave 4 of Micro degree will be followed by wave 5 of Micro degree, which will carry the price to new heights, perhaps significantly so.

At this point under the rules of Elliott wave analysis, there is no way to say which scenario the market will follow. Since Bitcoin allows for bull trades only, my plan is to trade the Micro degree. Using the principle analysis labelling, I’ll sit out the internal 5th wave of Micro wave A, and the decline of Micro wave B. From the B-wave low, I’ll re-enter my positions and ride Micro wave C to a new high. The same plan works for the alternative analysis, but with different labels.

Learning and other resources. Elliott wave analysis provides context, not prophecy. As the 20th century semanticist Alfred Korzybski put it in his book Science and Sanity (1933), “The map is not the territory … The only usefulness of a map depends on similarity of structure between the empirical world and the map.” And I would add, we can judge that similarity of structure only after the fact.

See the menu page Analytical Methods for a rundown on where to go for information on Elliott wave analysis.

By Tim Bovee, Portland, Oregon, August 11, 2021

Disclaimer

Tim Bovee, Private Trader tracks the analysis and trades of a private trader for his own accounts. Nothing in this blog constitutes a recommendation to buy or sell stocks, options or any other financial instrument. The only purpose of this blog is to provide education and entertainment.

No trader is ever 100 percent successful in his or her trades. Trading in the stock and option markets is risky and uncertain. Each trader must make trading decisions for his or her own account, and take responsibility for the consequences.

License
Creative Commons License

All content on Tim Bovee, Private Trader by Timothy K. Bovee is licensed under a Creative Commons Attribution-ShareAlike 4.0 International License.

Based on a work at www.timbovee.com.
SP500 Analysis

3:30 p.m. New York time

Half an hour before the closing bell. Having peaked 15 minutes before the opening bell, the S&P 500 traded slightly lower throughout the day. By my principle count wave 3 of Subminuscule degree is still underway. I’ve updated the chart.

9:35 a.m. New York time

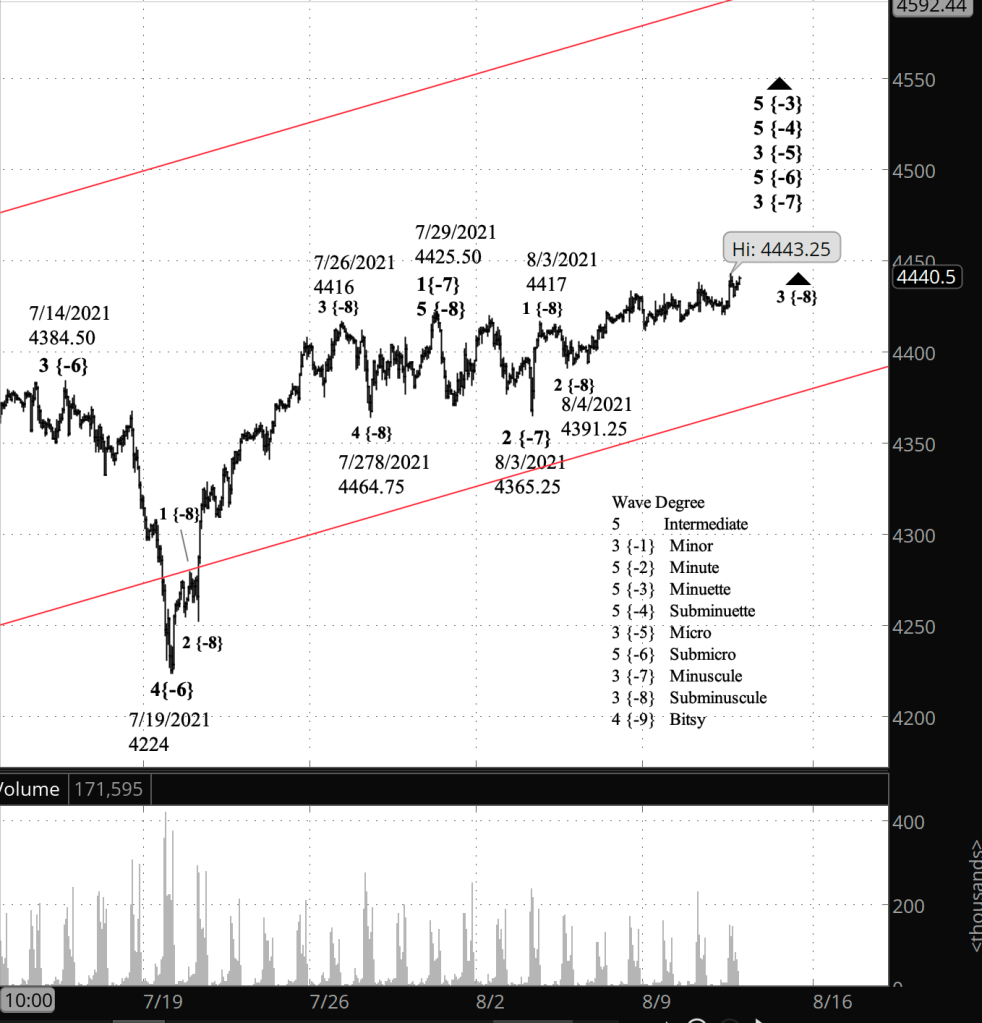
What’s happening now? The S&P 500 E-mini futures rose as the opening bell approached, reaching a high of 4443.25 so far today. The high on the index so far is 4449.32.

What does it mean? The low level correction within the uptrend that began August 4 is complete and a final push upward has begun.

What’s the alternative? The pushup could be a connector, bonding together two corrective patterns.

[S&P 500 E-mini futures at 3:30 p.m., hourly bars, with volume]

What does Elliott wave theory say? The rise from August 4 is wave 3 of Subminuscule degree, and the correction within that wave is wave 4 of Bitsy degree. By my principle analysis, the overnight rise is the beginning of wave 5 of Bitsy degree, the final wave within Subminuscule 3. By my alternative analysis, the rise is an X wave, connecting two corrective patterns in a compound wave 4 correction. The first pattern was a Flat, and the second pattern most likely will be another Flat or a Zigzag.

The completion of Bitsy wave 5 will also mark the end of Subminuscule wave 3, which will be followed by a deeper correction of the higher Subminuscule degree, although it most likely will be trending sideways.

Learning and other resources. Elliott wave analysis provides context, not prophecy. As the 20th century semanticist Alfred Korzybski put it in his book Science and Sanity (1933), “The map is not the territory … The only usefulness of a map depends on similarity of structure between the empirical world and the map.” And I would add, we can judge that similarity of structure only after the fact.

See the menu page Analytical Methods for a rundown on where to go for information on Elliott wave analysis.

By Tim Bovee, Portland, Oregon, August 11, 2021

Disclaimer

Tim Bovee, Private Trader tracks the analysis and trades of a private trader for his own accounts. Nothing in this blog constitutes a recommendation to buy or sell stocks, options or any other financial instrument. The only purpose of this blog is to provide education and entertainment.

No trader is ever 100 percent successful in his or her trades. Trading in the stock and option markets is risky and uncertain. Each trader must make trading decisions for his or her own account, and take responsibility for the consequences.

License
Creative Commons License

All content on Tim Bovee, Private Trader by Timothy K. Bovee is licensed under a Creative Commons Attribution-ShareAlike 4.0 International License.

Based on a work at www.timbovee.com.