SP500 Analysis

3:30 p.m. New York time

Half an hour before the closing bell. After nudging up to a new high, with little enthusiasm, the S&P 500 moved a bit lower. No change to the mid-day analysis. I’ve updated the chart.

12:35 p.m. New York time

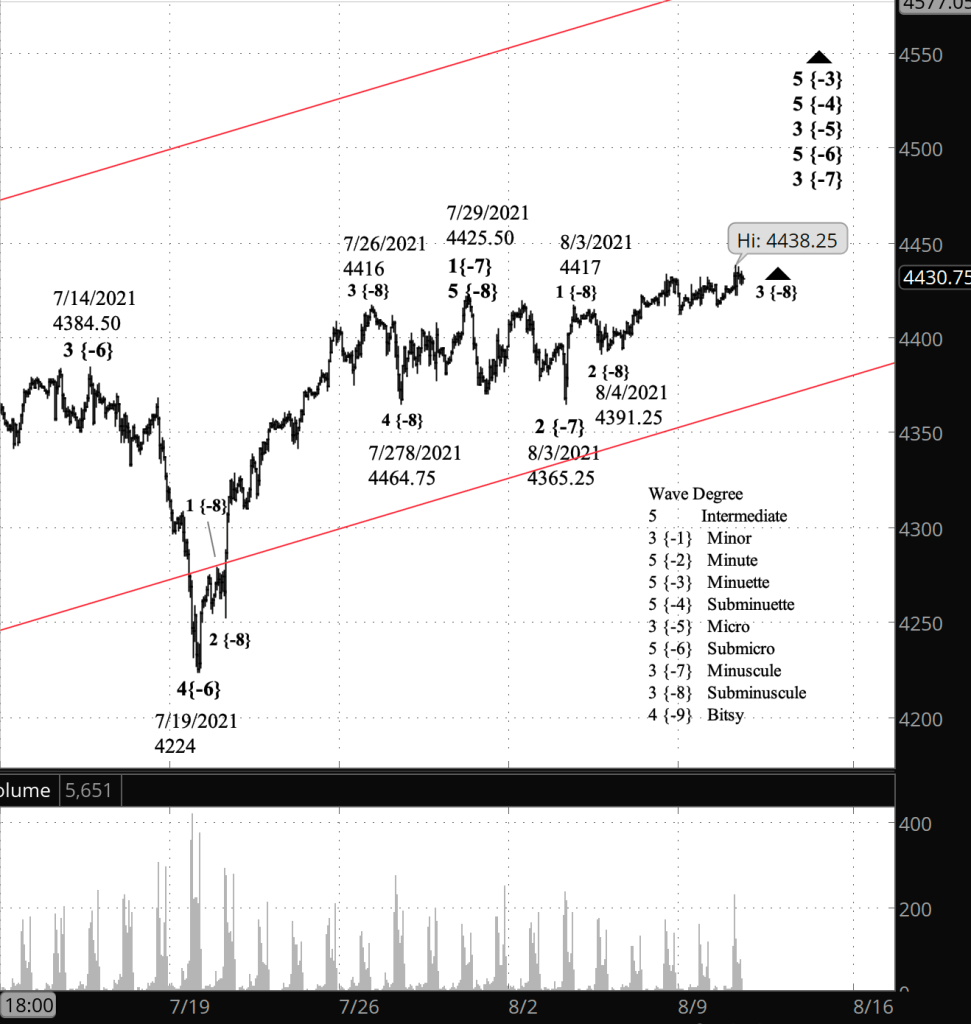
Midday update. The S&P 500 rose to new highs today, confirming my principle analysis. The 4th wave correction of Bitsy degree is over, and the parent, wave 3 of Subminuscule degree, has resumed its rise. The alternative analysis is no longer valid. I’ve updated the chart.

9:35 a.m. New York time

What’s happening now? The S&P 500 E-mini futures overnight continued their low-level sideways correction within a higher level uptrend.

What does it mean? The correction will be followed by a resumption of the higher level uptrend within a series of still larger uptrends dating back to May 19 at a price of 4055.50, which I expect to reach the upper boundary of the price channel marked in red on the chart. The channel is presently at around 4590 and will have risen further by the time the uptrend from May is complete.

What’s the alternative? It is possible that the August 6 high of 4433.25 marked the end of the rise that began August 3 from 4365.25. If that’s the case, then the higher level uptrend has moved into a correction. See yesterday’s post for a discussion.
[S&P 500 E-mini futures at 3:30 p.m., hourly bars, with volume]

What does Elliott wave theory say? Under my principle analysis, I count the present sideways correction as wave 4 of Bitsy degree within wave 3 of Subminuscule degree. The rise that began on May 19 is wave 3 of Micro degree, up three degrees from Subminuscule.

Under my alternative analysis, the August 6 high of 4433.25 was the end of wave 3 of Subminuscule degree and the present sideways correction is Subminuscule wave 4. Basically, the alternative scenario shifts the count up by one degree. I explained my reasons for considering this to be the less likely analysis in yesterday’s post.

Learning and other resources. Elliott wave analysis provides context, not prophecy. As the 20th century semanticist Alfred Korzybski put it in his book Science and Sanity (1933), “The map is not the territory … The only usefulness of a map depends on similarity of structure between the empirical world and the map.” And I would add, we can judge that similarity of structure only after the fact.

See the menu page Analytical Methods for a rundown on where to go for information on Elliott wave analysis

By Tim Bovee, Portland, Oregon, August 10, 2021

Disclaimer

Tim Bovee, Private Trader tracks the analysis and trades of a private trader for his own accounts. Nothing in this blog constitutes a recommendation to buy or sell stocks, options or any other financial instrument. The only purpose of this blog is to provide education and entertainment.

No trader is ever 100 percent successful in his or her trades. Trading in the stock and option markets is risky and uncertain. Each trader must make trading decisions for his or her own account, and take responsibility for the consequences.

License
Creative Commons License

All content on Tim Bovee, Private Trader by Timothy K. Bovee is licensed under a Creative Commons Attribution-ShareAlike 4.0 International License.

Based on a work at www.timbovee.com.
SP500 Analysis

3:30 p.m. New York time

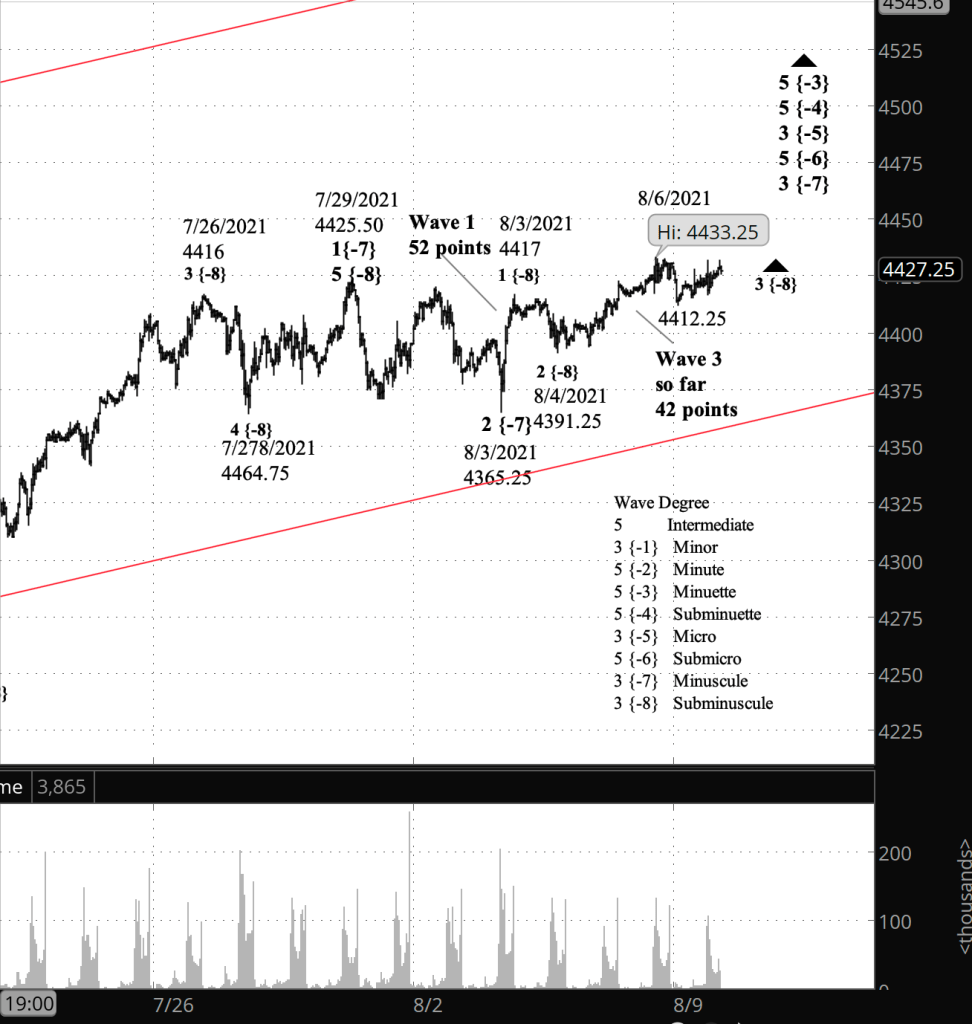
Half an hour before the closing bell. The S&P 500 spent the day trading within a barely visible extremely narrow range, working it way upward by a few points. I’ve updated the chart. No change in the analysis.

3:10 p.m. New York time

My trading. I’ve exited my short naked option position on GDX, after three days. The results may be found here, along with the reason why.

9:35 a.m. New York time

Posted over the weekend. Trading rules for diagonal options spreads.

What’s happening now? The S&P 500 E-mini futures fell in overnight trading to 20 points below Friday’s high of 4433.25.

What does it mean? By my principle analysis, the decline is a correction within the ongoing rise that began on August 4.

What’s the alternative? That Friday’s peak marked the end of that rise, and a downward correction — probably a shallow one — has begun.

[S&P 500 E-mini futures at 3:30 p.m., 40-minute bars, with volume]

What does Elliott wave theory say? The rise from August 4 is wave 3 of Subminuscule degree. My principle analysis has wave 3 still underway. The alternative says that wave 3 ended at Friday’s peak (August 6), and that Subminuscule wave 4 has begun.

My reasoning for the principle analysis is this: Most commonly in an uptrend, the 3rd wave is the largest of the three waves in the direction of the trend. Wave 1 of Subminuscule degree was 52 points long, and wave 3 of the same degree so far has covered only 42 points, making it shorter than wave 1. So the likelihood, I think, is that wave 3 still has more ground to cover.

However, Elliott wave theory says only that wave 3 can’t be the shortest wave in the direction of the trend. There’s no requirement that it be the longest. So my alternative analysis recognizes the possibility that wave 3 ended on August 6, with wave 3 being shorter than wave 1. If the alternative proves to be the case, then wave 5 can be no more than 42 points long, and could be less.

Learning and other resources. Elliott wave analysis provides context, not prophecy. As the 20th century semanticist Alfred Korzybski put it in his book Science and Sanity (1933), “The map is not the territory … The only usefulness of a map depends on similarity of structure between the empirical world and the map.” And I would add, we can judge that similarity of structure only after the fact.

See the menu page Analytical Methods for a rundown on where to go for information on Elliott wave analysis.

By Tim Bovee, Portland, Oregon, August 9, 2021

Disclaimer

Tim Bovee, Private Trader tracks the analysis and trades of a private trader for his own accounts. Nothing in this blog constitutes a recommendation to buy or sell stocks, options or any other financial instrument. The only purpose of this blog is to provide education and entertainment.

No trader is ever 100 percent successful in his or her trades. Trading in the stock and option markets is risky and uncertain. Each trader must make trading decisions for his or her own account, and take responsibility for the consequences.

License
Creative Commons License

All content on Tim Bovee, Private Trader by Timothy K. Bovee is licensed under a Creative Commons Attribution-ShareAlike 4.0 International License.

Based on a work at www.timbovee.com.
Trading Rules: Diagonal Spreads

Diagonal Spread Trading Rules

Unlike the short vertical spreads that have long been the bread-and-butter of my trading, diagonal spreads work well regardless of the implied volatility rank. They’re a good alternative to short vertical spreads in periods when IVR is low across the market.

A long diagonal spread is built from a short option closer in time and a long option with a different strike further out in time. If the options are calls, then the position is bullish. If puts, then bearish.

Here are the rules:

  • Buy a long option
    • 90 to 120 days before expiration
    • Delta around 80
  • Sell a short option
    • 30 to 60 days before expiration, with 45 days being optimal
    • Delta 30 to 50
    • Ensure that the premium of the short option is  equal to or greater than the extrinsic value of the long option. This becomes easier to obtain the deeper in the money the long options is placed.
  • Ensure that the net debit is around 50% of the spread and that it never exceeds 75% of the width.
  • Exit for a win if the stock price moves significantly in the direction of the trade,  rises (for calls) or falls (for puts).
  • Roll the short option to a lower strike (for calls) or higher strike (for puts) if the share price moves significantly against the direction of the trade. (“Significantly” is undefined; I look at the potential loss, the trend on the chart, and then follow my intuition.)

Although maximum profit cannot be determined precisely, it can be estimated by subtracting the net debit paid from the width of the strikes. 

The breakeven point can be calculated by subtracting the net debit paid from the long strike price.

By Tim Bovee, August 8, 2021, Portland, Oregon


Disclaimer

Tim Bovee, Private Trader tracks the analysis and trades of a private trader for his own accounts. Nothing in this blog constitutes a recommendation to buy or sell stocks, options or any other financial instrument. The only purpose of this blog is to provide education and entertainment.

No trader is ever 100 percent successful in his or her trades. Trading in the stock and option markets is risky and uncertain. Each trader must make trading decisions for his or her own account, and take responsibility for the consequences.

License

All content on Tim Bovee, Private Trader by Timothy K. Bovee is licensed under a Creative Commons Attribution-ShareAlike 4.0 International License.

Based on a work at www.timbovee.com.
Trading Rules: Short Naked Options

The subject is much less risqué than the title would suggest. A naked options position is one without at countervailing purchase to limit loss. The “short” means that the naked options are sold to begin with, and then bought at the end, one hopes at a lower price. My newly opened short naked call position on GDX is an example.

Positions: Short Naked Puts or Short Naked Calls

  • Set the strike price somewhere from delta 16 to 30. The higher the delta, the greater the risk and the smaller the odds of success.
  • Select an underlying stock whose Implied Volatility Rank (IVR) is 25% or greater. The higher the IVR, the greater the potential return. (This is similar to the IV Percentile found on many trading platforms.

Entry timing: As close as possible to 45 days prior to expiration, giving preference to monthly options. Generally, I won’t enter after 43 days prior to expiration.

Due diligence before entry:

  • Avoid earnings announcements
  • Avoid ex-dividend days
  • Ensure that the potential loss is within the trader’s guidelines for managing trading funds.

Exit rules:

  • Up to 21 days prior to the options expiration
    • Exit at 50% of maximum potential profit.
    • Exit at 50% of maximum potential loss.
  • If one these conditions occurs — a loss that is twice the credit received, a move beyond the short strike price, or 21 days prior to the options’ expiration — consider taking one of the following actions:
    • If profitable, exit the position
    • If unprofitable, do one of the following,
      • Exit the position.
      • Roll the position to the same strike price a month later, if doing so produces a net credit after the loss on the current condition is subtracted.
      • Buy options that will offset the short options, converting the position into a defined risk trade.

By Tim Bovee, August 6, 2021, Portland, Oregon

Read More »

GDX Trade

VanEck Vectors Gold Miners ETF  (GDX)

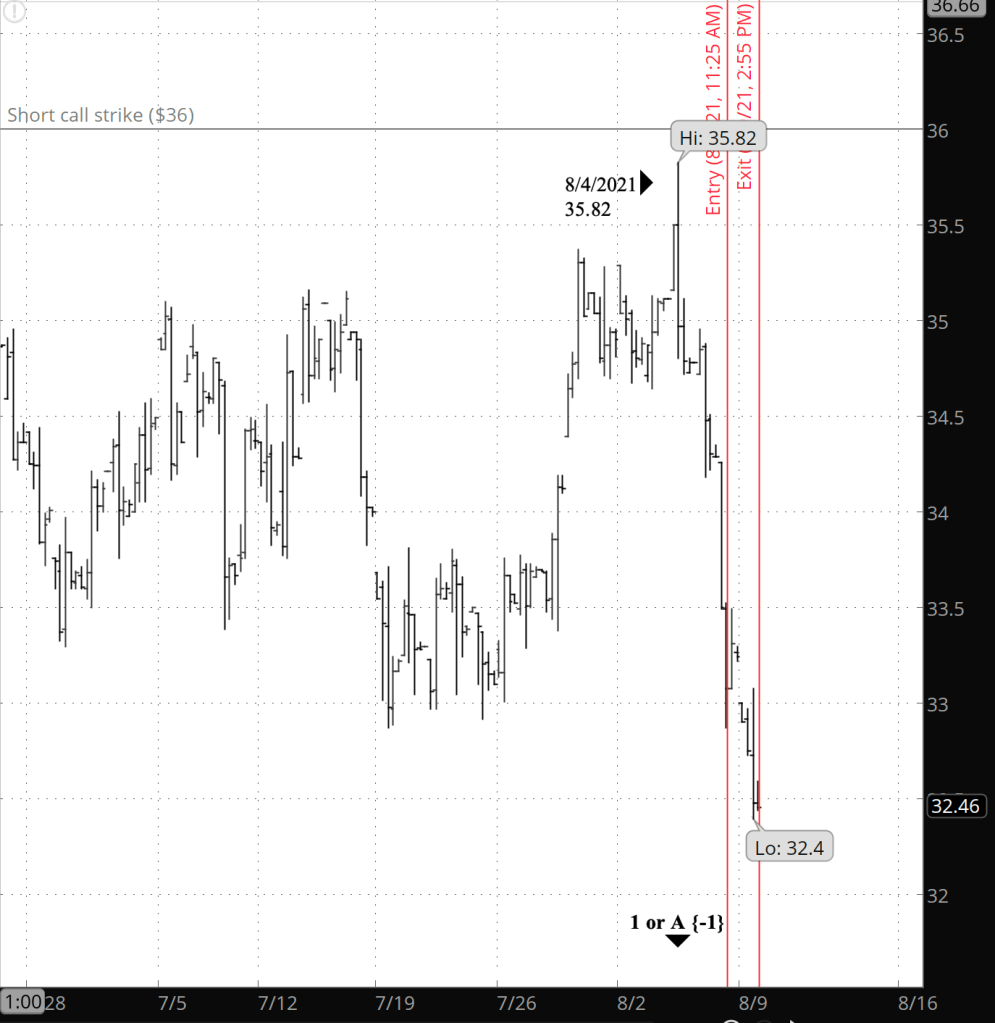
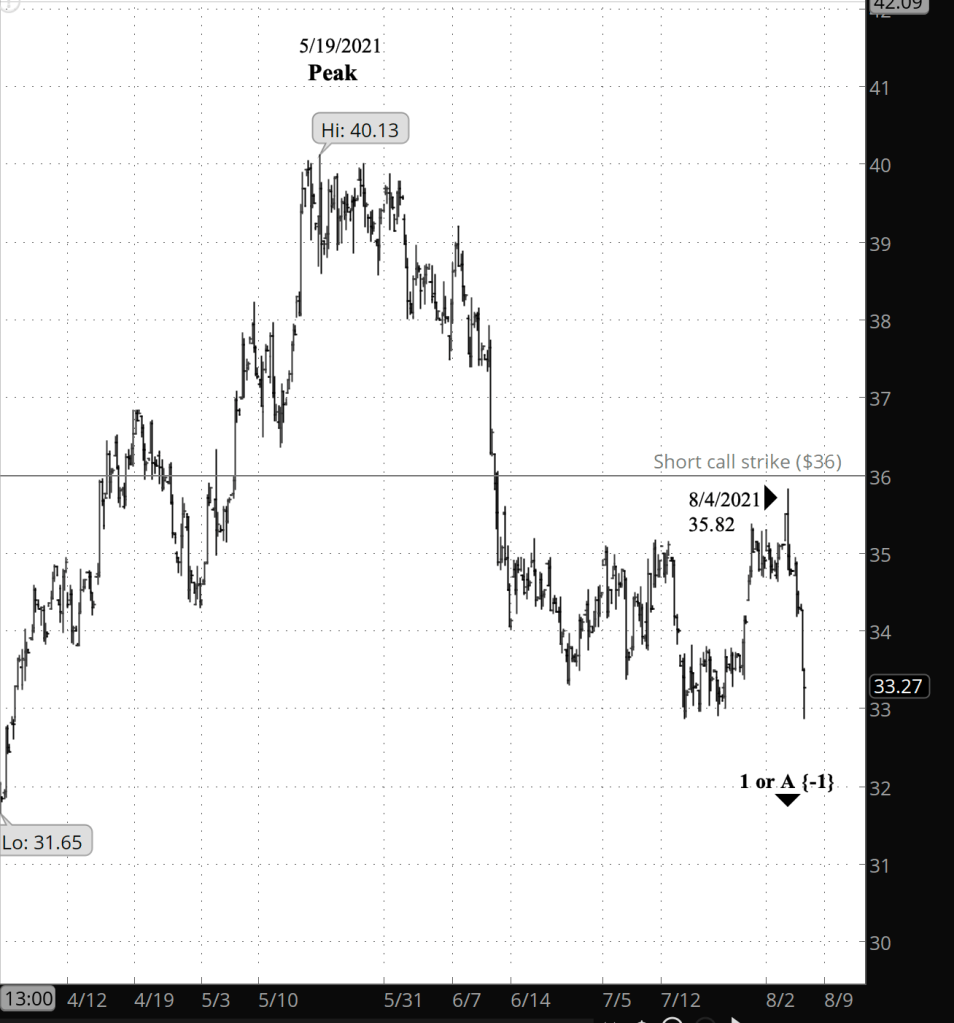
Update 8/9/2021: I exited my naked call option position on GDX three days into the trade, for a $0.25 debit per contract/share, a profit before fees of $0.14 per contract. Shares were trading at $32.51, down $0.53 from the entry level.

My decision to exit was based on the fact that I found being in a position with no downside limit to be nervous-making and not to my taste. It was an experiment, and I doubt that I’ll repeat it any time soon. 

The price of GDX decline precipitously during my short holding period. And despite my concerns, the position was wildly successful.

Shares declined by 1.6% over three days for a -195% annual rate. The options position produced a 58.3% return for a 7,097% annual rate.

[GDX at 3:02 p.m. 8/9/2021, 4-hour bars]

I have sold a call option on GDX, using an option that trades for the last time 42 days hence, on September 17. The premium is a $0.38 credit per contract share and the stock at the time of entry was priced at $33.04.

The implied volatility rank (IVR) stands at 27.7.

I have not done much trading in which I sell naked options, a term meaning that there is no offsetting purchase to limit the loss. The trader is responsible for keeping losses reasonable. So I think of this small trade as education.

Premium:$0.38Expire OTM 
GDX-nakedStrikeOddsDelta
Calls   
Short36.0082.0%22

The profit zone covers an 8.2% move to the upside.

The risk/reward ratio is 8.7:1, with cover risk of $332.24 and maximum reward of $38 per contract. The cover risk is based on the amount required by brokerage to cover the position. The maximum loss, if the stock goes to zero, is $3,600, the price of 100 shares.

I structured the trade using Elliott wave analysis. The degree labels are relative to one another and don’t refer to named degrees. GDX has fallen from its May 19 peak in a what is either a 1st wave within a downtrend, or an A wave within a correction. In either case, I’m anticipating that the price will remain below the $35.82 August 4 peak. If the price approaches that level, then I will consider rolling it further up to return the position to profitability. The ability to make such adjustments is one of the huge advantages afforded by naked options.


[GDX at 11:55 a.m. on 9/6/2021 with 4-hour bars]

By Tim Bovee, Portland, Oregon, August 6, 2021

Disclaimer

Tim Bovee, Private Trader tracks the analysis and trades of a private trader for his own accounts. Nothing in this blog constitutes a recommendation to buy or sell stocks, options or any other financial instrument. The only purpose of this blog is to provide education and entertainment.

No trader is ever 100 percent successful in his or her trades. Trading in the stock and option markets is risky and uncertain. Each trader must make trading decisions for his or her own account, and take responsibility for the consequences.

License

All content on Tim Bovee, Private Trader by Timothy K. Bovee is licensed under a Creative Commons Attribution-ShareAlike 4.0 International License.

Based on a work at www.timbovee.com.
SP500 Analysis

Half an hour before the closing bell. The S&P 500 traded below the morning high throughout the day. No change in the analysis. I’ve updated the close-up chart.

11:45 a.m. New York time

My trades. I’ve sold a put against GDX in one of my rare forays into trading naked options, without the benefit of an offsetting purchase to limit my loss. I’ve posted an analysis of the trade. Chart to come.

9:40 a.m. New York time

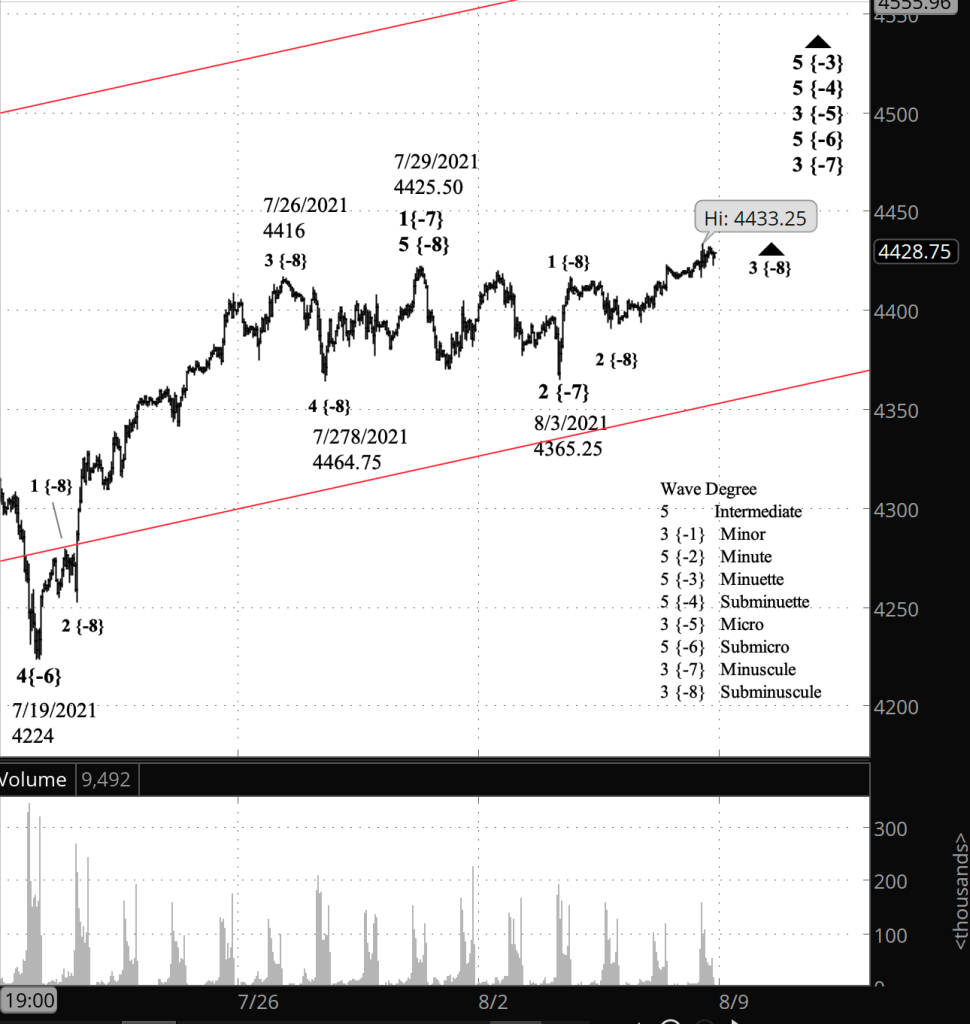
What’s happening now? The S&P 500 E-mini futures pushed higher in overnight trading, reaching 4433.25 shortly after the opening bell. The index shortly after the opening bell reached a new high of 4440.82, eliminating the divergence between the futures and the index described in yesterday’s post after the closing bell.

What does it mean? The uptrend that began on August 3 has resumed its rise after a correction, the first of two that will interrupt the trend.

What’s the alternative? None apparent at this point. The open question is how high the price will go before a significant correction. See the Elliott wave theory section for a discussion.

[Close-up: S&P 500 E-mini futures at 3:30 p.m., 45-minute bars, with volume]
[Big picture: S&P 500 index at 9:35 a.m., 2-day bars]

What does Elliott wave theory say? The present uptrend from August 3 is wave 3 of Minuscule degree. Internally, wave 3 of Subminuscule degree began on August 4. That structure in turn contained within wave 5 of Submicro degree within wave 3 of Micro degree within wave 5 of Subminuette degree, which began on May 13 from 4029.25. The price channel I’ve drawn encompasses the price movement one degree higher, wave 5 of Minuette degree, which began on April 3 from 3720.50.

In setting a target, I’m asking how high Subminuette 5 will travel. The end of its journey will also mark the end of Minuette 5 and its parent, wave 5 of Minute degree, and grandparent, wave 3 of Minor degree. Minor wave 3 began on February 23, 2020 from 2191.86.

The Minor degree brings us to another price channel, this one an expanding diagonal triangle, wave 5 of Intermediate degree, which began on December 26, 2018.

Subminuette 5 is really important. When finished, it will consist of five waves, each wave hitting a higher high or lower low than the prior wave in each direction. That’s the expanding part. The end of Minor wave 3 at the upper boundary will be the beginning of Minor wave 4, which will move down to the lower boundary of the triangle.

So, some targets. The upper boundary of the Minuette degree price channel is in the 4570s and rising. The longer it takes Subminuette 5 to reach the boundary, the higher the target high will be. Subminuette degree is three levels above Minuscule, so under the Elliott wave rule of proportionality, we have some time to go before that boundary is approached. On the diagonal triangle at Intermediate degree, the lower boundary is presently in the 2010s and will have sunk much lower by the time Minor wave 4 reaches it. So the long ride up we’ve experienced since the pandemic crash will be followed by a longer ride down, with the usual corrections in the opposite direction.

Learning and other resources. Elliott wave analysis provides context, not prophecy. As the 20th century semanticist Alfred Korzybski put it in his book Science and Sanity (1933), “The map is not the territory … The only usefulness of a map depends on similarity of structure between the empirical world and the map.” And I would add, we can judge that similarity of structure only after the fact.

See the menu page Analytical Methods for a rundown on where to go for information on Elliott wave analysis.

By Tim Bovee, Portland, Oregon, August 6, 2021

Disclaimer

Tim Bovee, Private Trader tracks the analysis and trades of a private trader for his own accounts. Nothing in this blog constitutes a recommendation to buy or sell stocks, options or any other financial instrument. The only purpose of this blog is to provide education and entertainment.

No trader is ever 100 percent successful in his or her trades. Trading in the stock and option markets is risky and uncertain. Each trader must make trading decisions for his or her own account, and take responsibility for the consequences.

License
Creative Commons License

All content on Tim Bovee, Private Trader by Timothy K. Bovee is licensed under a Creative Commons Attribution-ShareAlike 4.0 International License.

Based on a work at www.timbovee.com.
SP500 Analysis

4:15 p.m. New York time

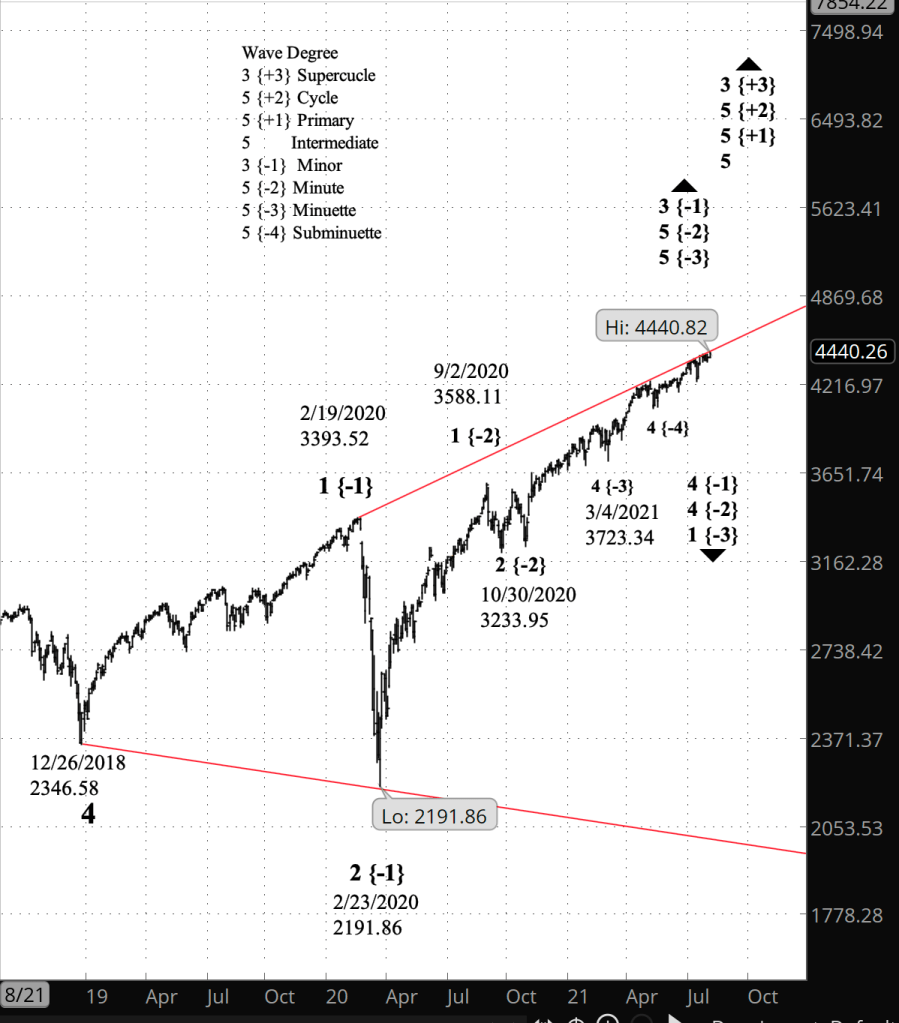
After the closing bell. In last 5 minutes of the trading session, the S&P 500 futures moved above the July 29 high of 4422.50 by a quarter point, to 4422.75. The index, however, stayed 29 points below its July 29 high of 4429.97.

Under the rules of Elliott wave analysis, this creates a divergence in the analyses. The futures, by reaching a higher high, confirmed the principle analysis that sees wave 3 of Minuscule degree on the rise. The index, by failing to reach a new high, gave no such confirmation.

The futures trade in 25-cent increments, so I’m fairly sure that the divergence is a rounding error on the futures side. If the index fails to reach a new high on Friday, then that will create an interesting question: Do I follow the futures and continue to analyze the rise as Minuscule 3? Or do I follow the more precise index and consider the principle analysis for both to not yet be confirmed.

I’ve updated the futures chart again.

3:30 p.m. New York time

Half an hour before the closing bell. The S&P 500 continued to trade within a narrow range, about 15 points on the index and similar on the futures. No change in the analysis. Chart updated.

9:45 a.m. New York time

What’s happening now? The S&P 500 E-mini futures traded sideways for the second night in a row.

What does it mean? The price has done nothing the resolve the question of which analysis is correct. The principle analysis from yesterday’s post: “The August 3 low marked the end of a shallow correction and the subsequent rise the first small step in what will eventually become a rise that could reach into the 4500s.”

What’s the alternative? The alternative analysis from yesterday: “The rise after August 3 could be a separator in a complex correction made up of two corrective patterns. Under the alternative, either the sideways movement will continue, or a more directional pattern will begin.”

[S&P 500 E-mini futures at 4:15 p.m., hourly bars, with volume]

What does Elliott wave theory say? Under my principle analysis, the S&P 500 is in a wave 2 downward correction of Subminuscule degree within a rising wave 3 of Minuscule degree within wave 5 of Submicro degree, which in turn is within wave 3 of Micro degree, which began on May 19.

Under the alternative analysis, the corretive wave 2 of Minuscule degree is still underway.

Learning and other resources. Elliott wave analysis provides context, not prophecy. As the 20th century semanticist Alfred Korzybski put it in his book Science and Sanity (1933), “The map is not the territory … The only usefulness of a map depends on similarity of structure between the empirical world and the map.” And I would add, we can judge that similarity of structure only after the fact.

See the menu page Analytical Methods for a rundown on where to go for information on Elliott wave analysis.

By Tim Bovee, Portland, Oregon, August 5, 2021

Disclaimer

Tim Bovee, Private Trader tracks the analysis and trades of a private trader for his own accounts. Nothing in this blog constitutes a recommendation to buy or sell stocks, options or any other financial instrument. The only purpose of this blog is to provide education and entertainment.

No trader is ever 100 percent successful in his or her trades. Trading in the stock and option markets is risky and uncertain. Each trader must make trading decisions for his or her own account, and take responsibility for the consequences.

License
Creative Commons License

All content on Tim Bovee, Private Trader by Timothy K. Bovee is licensed under a Creative Commons Attribution-ShareAlike 4.0 International License.

Based on a work at www.timbovee.com.
SP500 Analysis

3:30 p.m. New York time

Half an hour before the closing bell. The S&P 500 has barely budged today. No change in the analysis. Chart updated.

My analyses. I analyzed BABA and LVS as potential vertical options spread plays today, but found them lacking for technical reasons. BABA had a greater risk/reward ratio than I’m comfortable with, and LVS has strike prices $5 apart, which made it impossible to fine-tune the trade structure to my liking. I passed on both.

10:10 a.m. New York time

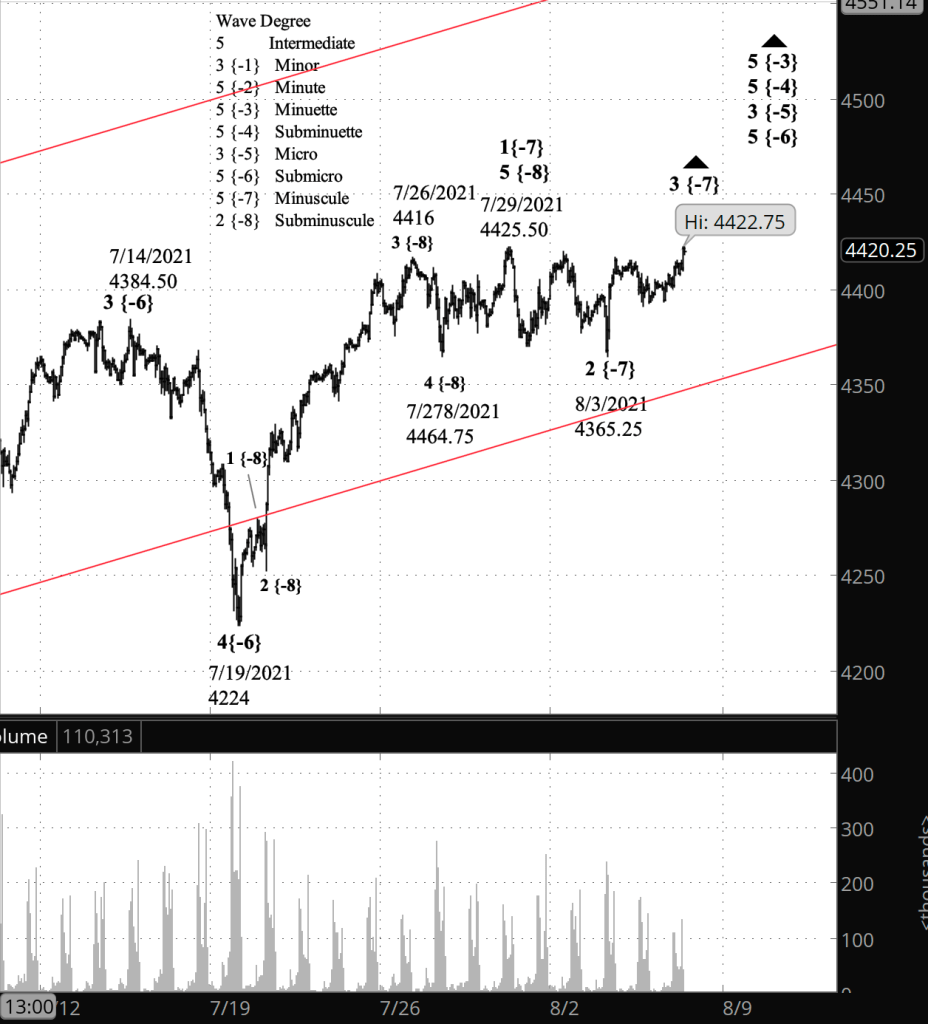
What’s happening now? Overnight, the S&P 500 E-mini futures continued to trade in a narrow range, remaining within the July 29 high of 4422.50 and the August 3 low of 4365.25.

What does it mean? The August 3 low marked the end of a shallow correction and the subsequent rise the first small step in what will eventually become a rise that could reach into the 4500s.

What’s the alternative? The rise after August 3 could be a separator in a complex correction made up of two corrective patterns. Under the alternative, either the sideways movement will continue, or a more directional pattern will begin.

[S&P 500 E-mini futures at 3:30 p.m., hourly bars, with volume]

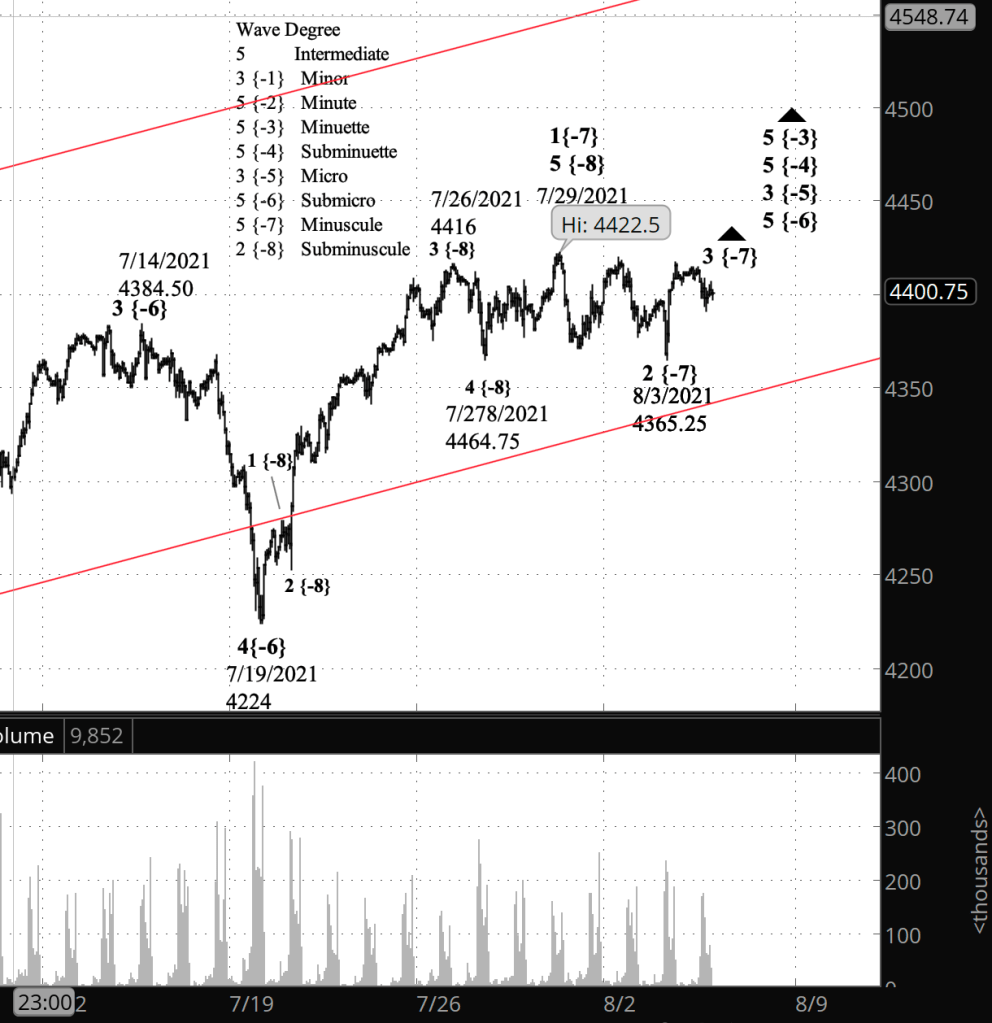
What does Elliott wave theory say? On the chart I’ve made an attempt at labeling the subwaves of wave 5 of Submicro degree, which began on July 19 from 4224. I don’t have a lot confidence in the analysis at Minuscule and Subminuscule degrees. My confidence at the Submicro degree and larger is high.

In detail. The rise from July 19 to July 26 is clear, although it is difficult to make a count that respects the rules of proportionality. The count I’ve done on the chart is in line with the rules of Elliott wave analysis. The subsequent 4th wave of Subminuscule degree is quite clear. The Subminuscule 5th wave that follows has the scribbly quality common in indecisive markets that makes any analysis below Subminuscule problematic.

The July 29 high marking the end of wave 1 of Minuscule degree is clear, although it’s a very short 5th wave at the Subminuscule degree. Under the rules, I couldn’t count the July 29 high as part of a 4th wave correction because it moved above the end of the preceding 3rd wave.

Afterward, wave 2 of Minuscule degree is clearly delineated, but wait: It’s a very unusual wave. Second waves are almost always of the Zigzag pattern and retrace a large proportion of the preceding 1st wave. That’s not what’s happening here. The pattern is a Flat, of the sort typical of 4th waves. It has retraced very little of the 1st wave rise.

As second waves go, this one is very strange.

Under my principle analysis, I’ve counted the August 3 low as the end of wave 2 of Minuscule degree and the subsequent rise as the start of wave 3 of Minuscule degree. However, under the alternative analysis, it’s possible that the low marks the end of the first pattern within a compound wave 2 and the subsequent rise as an X wave separating the first pattern from a second pattern. The second pattern can be another Flat, a Zigzag that will carry the price down further, or a Triangle of some sort.

Time, as always, will tell.

Remember this. Elliott wave analysis provides context, not prophecy. As the 20th century semanticist Alfred Korzybski put it in his book Science and Sanity (1933), “The map is not the territory … The only usefulness of a map depends on similarity of structure between the empirical world and the map.” And I would add, we can judge that similarity of structure only after the fact.

Learning and other resources. See the menu page Analytical Methods for a rundown on where to go for information on Elliott wave analysis

By Tim Bovee, Portland, Oregon, August 4, 2021

Disclaimer

Tim Bovee, Private Trader tracks the analysis and trades of a private trader for his own accounts. Nothing in this blog constitutes a recommendation to buy or sell stocks, options or any other financial instrument. The only purpose of this blog is to provide education and entertainment.

No trader is ever 100 percent successful in his or her trades. Trading in the stock and option markets is risky and uncertain. Each trader must make trading decisions for his or her own account, and take responsibility for the consequences.

License
Creative Commons License

All content on Tim Bovee, Private Trader by Timothy K. Bovee is licensed under a Creative Commons Attribution-ShareAlike 4.0 International License.

Based on a work at www.timbovee.com.
FXI Trade

iShares China Large-Cap ETF (FXI)

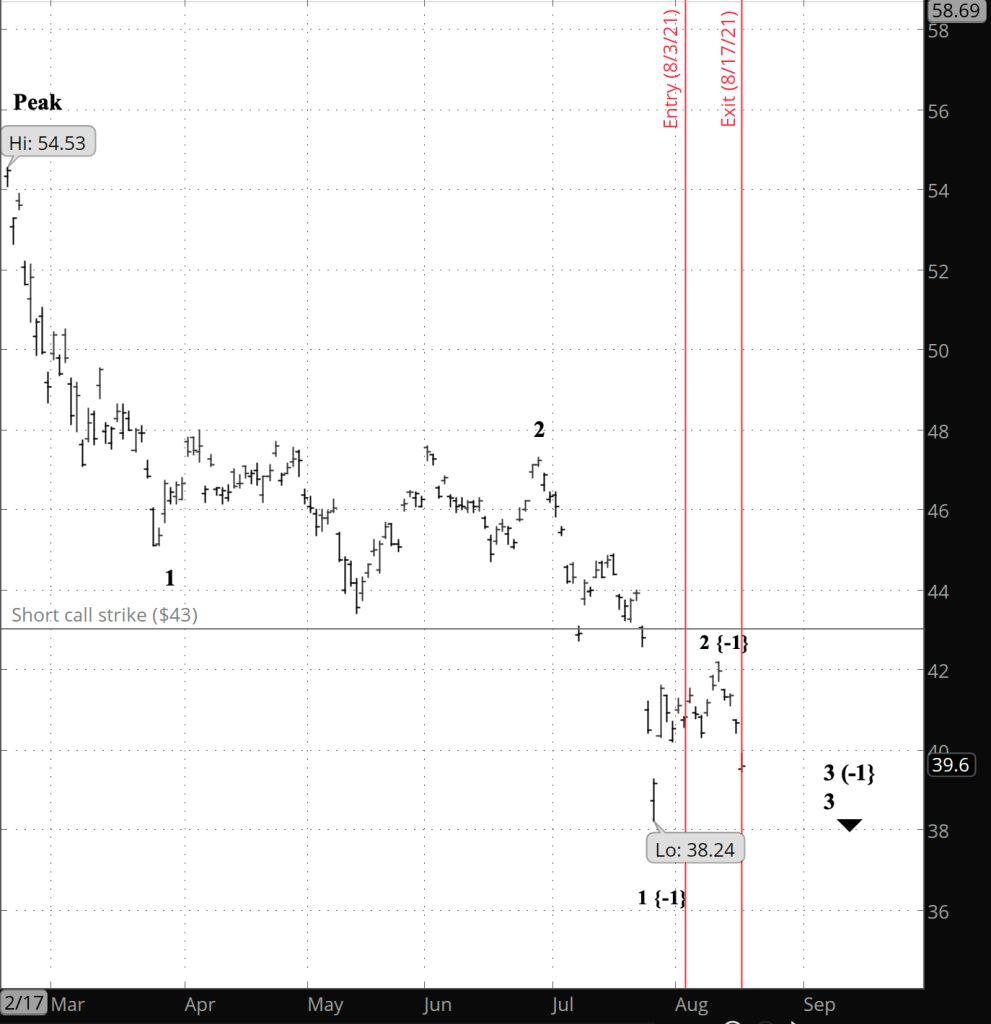
Update 8/17/2021: I exited my bear call spread position on FXI 31 days before expiration, for a $0.17 debit per contract/share, a profit before fees of $0.62 per contract. Shares were trading at $39.89, down $0.87 from the entry level. The Implied Volatility Rank at exit was 37.4%, down 12 points from the entry level.

My decision to exit was based on the profit exceeding 50% of its maximum potential.

Shares declined by 2.1% over 14 days for a -56% annual rate. The options position produced a 182.4% return for a 4,754% annual rate.


I have entered a short bear call spread on FXI, using options that trade for the last time 45 days hence, on September 17. The premium is a $0.48 credit per contract share and the stock at the time of entry was priced at $40.76.

The implied volatility rank (IVR) stands at 49.4%.

Premium:$0.48Expire OTM 
FXI-bear call spreadStrikeOddsDelta
Calls   
Long47.0097.0%4
Break-even42.5287.0%2
Short43.0077.0%0.27

The premium is 24% of the width of the position’s wing.
The profit zone covers a 4.4% move to the upside.

The risk/reward ratio is 7.3:1, with maximum risk of $352 and maximum reward of $48 per contract.

In constructing the position, I relied on Elliott wave analysis, using wave labels that are relative to each other and that don’t refer to named degrees. The short strike is placed just above the end of wave 1 {-1}. The present wave is 3 {-1}, and any subsequent 4th wave correction at the same degree will likely remain below that strike level.

[FXI at 2:18 p.m. 8/17/2021, daily bars]

By Tim Bovee, Portland, Oregon, August 3, 2021

Disclaimer

Tim Bovee, Private Trader tracks the analysis and trades of a private trader for his own accounts. Nothing in this blog constitutes a recommendation to buy or sell stocks, options or any other financial instrument. The only purpose of this blog is to provide education and entertainment.

No trader is ever 100 percent successful in his or her trades. Trading in the stock and option markets is risky and uncertain. Each trader must make trading decisions for his or her own account, and take responsibility for the consequences.

License

All content on Tim Bovee, Private Trader by Timothy K. Bovee is licensed under a Creative Commons Attribution-ShareAlike 4.0 International License.

Based on a work at www.timbovee.com.
AMD Trade

Advanced Micro Devices Inc. (AMD)


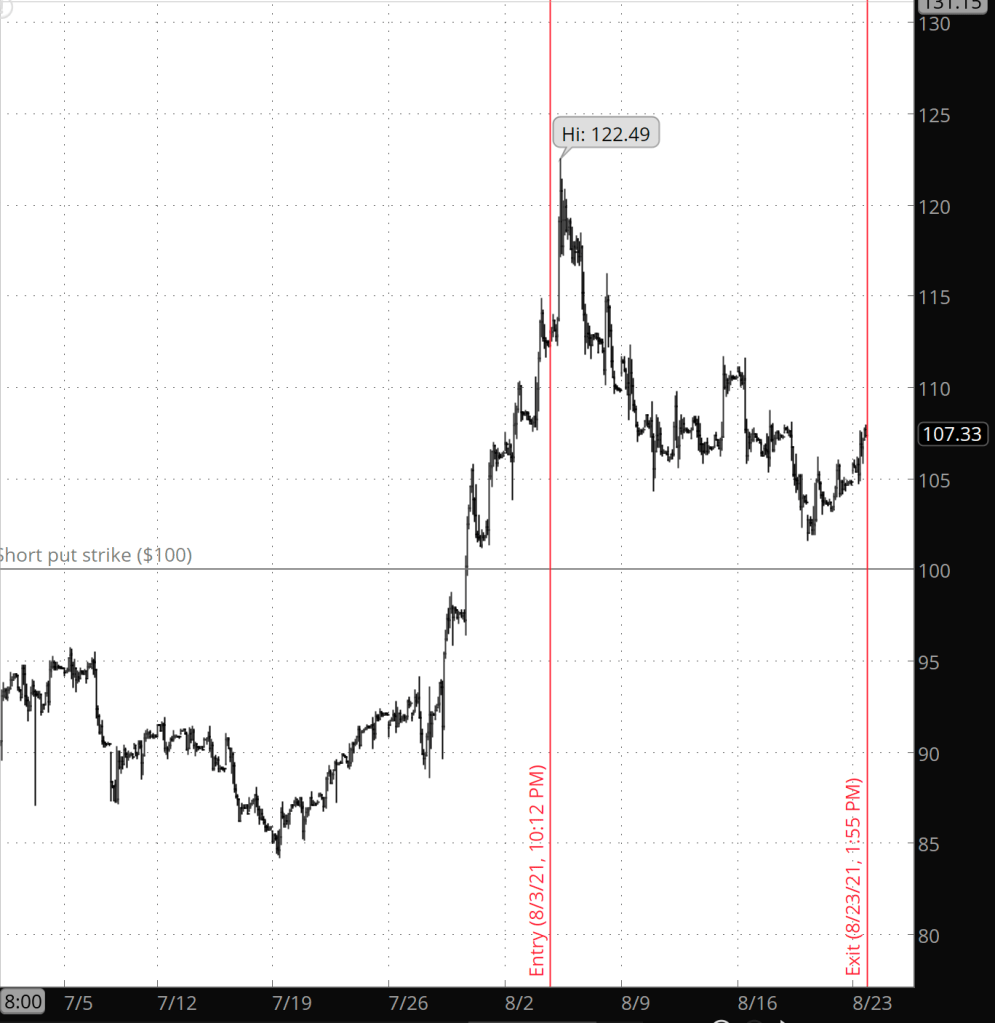
Update 8/23/2021: I exited my bull put spread position on AMD 25 days before expiration, for a $1.12 debit per contract/share, the same before fees of my entry credit.. Shares were trading at $107.55, down $5.59 from the entry level.

My decision to exit was based on a reading of the chart. The price had reached a resistance point that had been touched twice before declining. With only four days to go before the day I manage positions — 21 days before expiration — I judged it best to get out of the position a touch early rather than risk another retreat from resistance. Exiting ensures the funds will be available for trading on August 31, the beginning of the next entry period, for the October monthlies.

Shares declined by 4.9% over 13 days for a -139% annual rate. The options position produced neither a return nor a loss — it was a wash, except for a few dollars in fees.

I’ve updated the chart, below.


I have entered a short bull put spread on AMD, using options that trade for the last time 45 days hence, on September 17. The premium is a $1.12 credit per contract share and the stock at the time of entry was priced at $113.14.

The implied volatility rank (IVR) stands at 40.5.

Premium: $1.12 Expire OTM  
AMD-bull put spread Strike Odds Delta
Puts      
Long 92.50 88.0% 10
Break-even 98.88 82.5% 15
Short 100.00 77.0% 19

The premium is 29.9% of the width of the position’s wing.
The profit zone covers a 12.6% move to the downside.

The risk/reward ratio is 5.7:1, with maximum risk of $638 and maximum reward of $112 per contract.

I chose to entered a bull play based on an Elliott wave analysis of the chart. Using relative wave levels (rather than named degrees), the strike price of $100 is about 15 points above the start of wave 3 and about 15 points below the present high in that 3rd wave. The strike price, above which it’s all profit, is shown on the chart as a horizontal grey line.

[AMD at 1:35 p.m. 8/23/2021, hourly bars]

By Tim Bovee, Portland, Oregon, August 3, 2021

Disclaimer

Tim Bovee, Private Trader tracks the analysis and trades of a private trader for his own accounts. Nothing in this blog constitutes a recommendation to buy or sell stocks, options or any other financial instrument. The only purpose of this blog is to provide education and entertainment.

No trader is ever 100 percent successful in his or her trades. Trading in the stock and option markets is risky and uncertain. Each trader must make trading decisions for his or her own account, and take responsibility for the consequences.

License

All content on Tim Bovee, Private Trader by Timothy K. Bovee is licensed under a Creative Commons Attribution-ShareAlike 4.0 International License.

Based on a work at www.timbovee.com.