SP500 Analysis

3:30 p.m. New York time

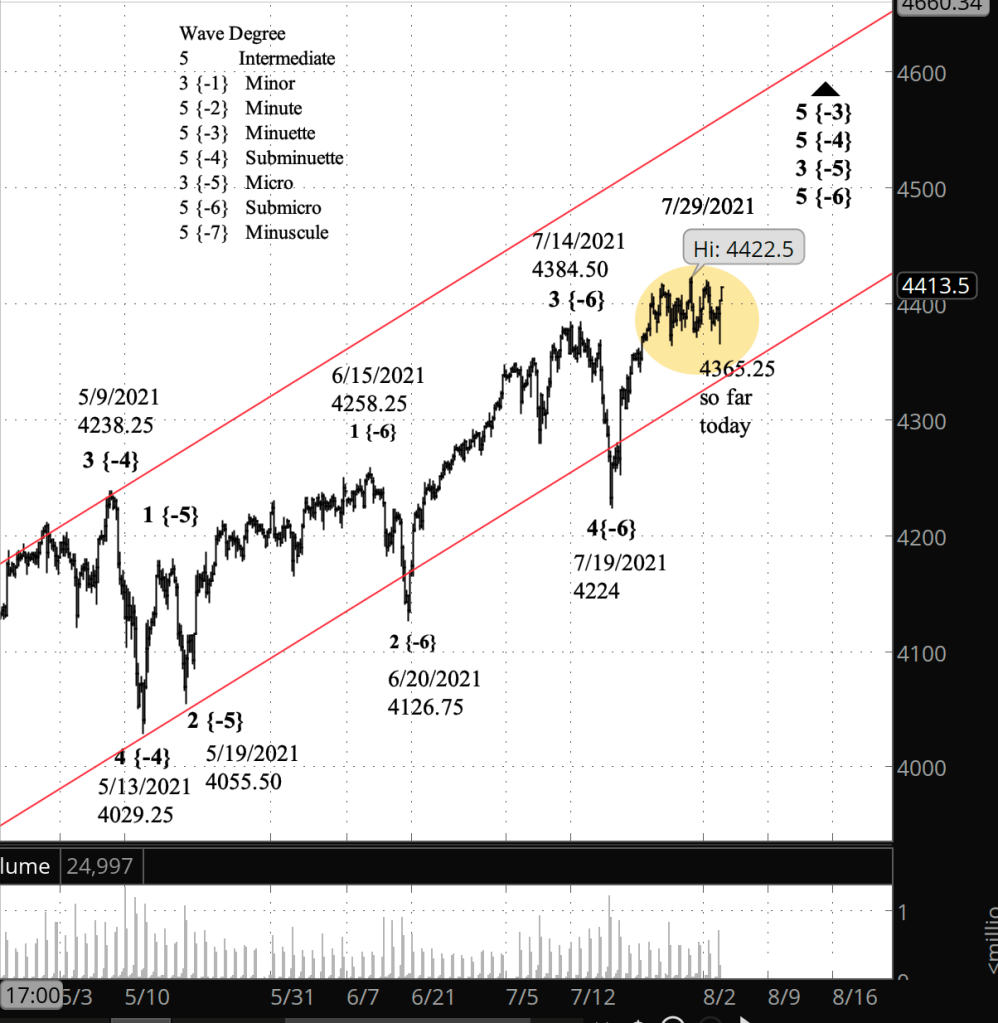
Half an hour before the closing bell. The S&P 500 E-mini futures continued to trade within a narrow range, staying above this morning’s low of 4365.25 and above the July 298 high of 4422.50.

My Trades. I entered two options positions today, expiring on September 17. They are on AMD and FXI.

Also, yesterday, I entered share positions on VB, ZBRA and ZM.

10:30 a.m. New York time

What’s happening now? The S&P 500 E-mini futures continued to draw back in overnight trading, reaching a low of 4367.25 today.

What does it mean? The rise that began on July 19 continues and since July 29 has been in an internal correction, after which the price will reach new highs.

What’s the alternative? The high of July 29 marked the end of the uptrend and a downtrend of a larger proportion has begun.
[S&P 500 E-mini futurues at 3:30 p.m., 4-hour bars, with volume]

What does Elliott wave theory say? The rise from July 19 is wave 5 of Submicro degree within wave 3 of Micro degree. The end of Submicro 5 will mark the beginning of wave 4 of Micro degree, likely a sideways correction.

The July 29 peak came in the midst of a sideways movement that began a few days earlier (marked on the chart with a yellow oval). Normally, a 5th wave ends with a distinctively directional push in the direction of the trend. This high was a shrug and a muttered, “Meh”. Because of that, I’ve relegated the 5th wave peak theory to my alternative count.

Another problem. The form of the sideways structure that includes the peak is that of a 4th wave, which generally are Flat structures or a series of Flats that are the very picture of indecisiveness. And yet, this is the first significant correction since the uptrend began on July 29 and so should be a 2nd wave internal to the uptrend. It doesn’t break any rules of Elliott wave analysis to have a Flat 2nd wave, but I haven’t seen it very often.

Look as hard as might at the rise from July 19 to July 29, I can’t find a correction of similar proportion. So I’m left with a huge ambiguity that makes it impossible for me to judge the progress within wave 5 of Submicro degree.

Judging from the position of the price within the channel for wave 5 of Minuette degree, the sideways correction must surely be a 2nd wave, because the rise typically will end close to the upper boundary of the channel, about 200 points high as of this moment. So the count within Submicro 5 after the correction should, if it’s typical, have a long 3rd wave, a Zigzag 4th wave correction (under the rule of alternation), and then a 5th wave up to the vicinity of the upper boundary of the channel.

I’ve often said that Elliott wave analysis provides context, not prophecy. Today’s chart is a good illustration of that maxim.

Learning and other resources. See the menu page Analytical Methods for a rundown on where to go for information on Elliott wave analysis.

By Tim Bovee, Portland, Oregon, August 3, 2021

Disclaimer

Tim Bovee, Private Trader tracks the analysis and trades of a private trader for his own accounts. Nothing in this blog constitutes a recommendation to buy or sell stocks, options or any other financial instrument. The only purpose of this blog is to provide education and entertainment.

No trader is ever 100 percent successful in his or her trades. Trading in the stock and option markets is risky and uncertain. Each trader must make trading decisions for his or her own account, and take responsibility for the consequences.

License
Creative Commons License

All content on Tim Bovee, Private Trader by Timothy K. Bovee is licensed under a Creative Commons Attribution-ShareAlike 4.0 International License.

Based on a work at www.timbovee.com.
SP500 Analysis

3:30 p.m. New York time

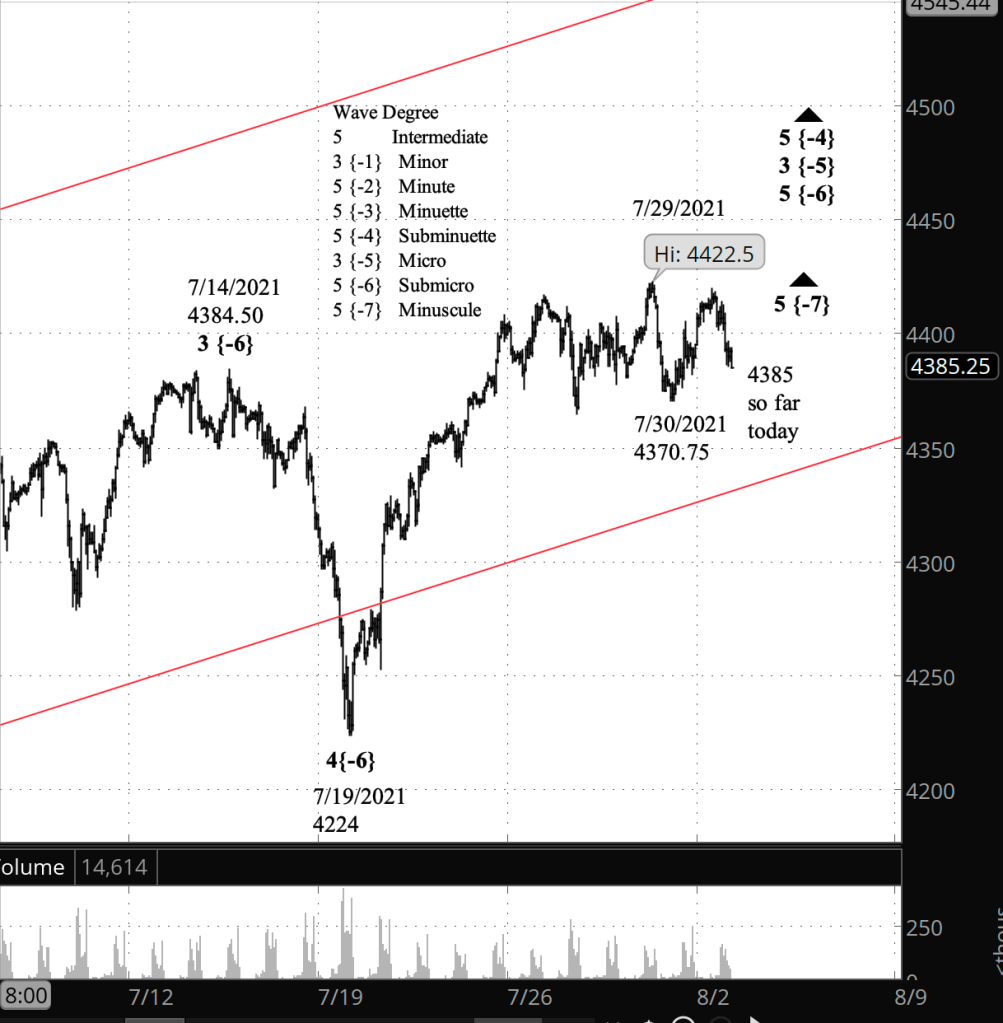
Half an hour before the closing bell. The S&P 500 continued to fall during the day, reaching a low so far of 4385 on the futures and 4392.83 on the index. No change in the analysis. Chart updated.

9:40 a.m. New York time

What’s happening now? The S&P 500 E-mini futures rose slightly in overnight trading and then fell back by a bit, at the remaining about five points below the 4422.50 high of July 29.

What does it mean? The uptrend that began on July 19 from 4224 continues.

What’s the alternative? The July 29 peak can be seen as the end of the uptrend and subsequent decline the beginning of a larger-scale correction.

[S&P 500 E-mini futures at 3:30 p.m., hourly bars, with volume]

What does Elliott wave theory say? Under my principle analysis,. the present rise is wave 5 of Minuscule degree within wave 5 of Submicro degree within wave 3 of Micro degree, which began on May 13 from lower boundary of the Subminuette degree price channel, which was at 4029.25 at the time and has since risen higher.

The price in the present uptrend remains below the upper boundary of the channel, now at around 4960, and that is one reason why I think the uptrend is still underway.

Under the alternative analysis, the June 29 high marks the end of Micro wave 3, and the subsequent decline is the beginning movements of wave A of Submicro degree within wave 4 of Micro degree.

Learning and other resources. See the menu page Analytical Methods for a rundown on where to go for information on Elliott wave analysis.

By Tim Bovee, Portland, Oregon, August 2, 2021

Disclaimer

Tim Bovee, Private Trader tracks the analysis and trades of a private trader for his own accounts. Nothing in this blog constitutes a recommendation to buy or sell stocks, options or any other financial instrument. The only purpose of this blog is to provide education and entertainment.

No trader is ever 100 percent successful in his or her trades. Trading in the stock and option markets is risky and uncertain. Each trader must make trading decisions for his or her own account, and take responsibility for the consequences.

License
Creative Commons License

All content on Tim Bovee, Private Trader by Timothy K. Bovee is licensed under a Creative Commons Attribution-ShareAlike 4.0 International License.

Based on a work at www.timbovee.com.

SP500 Analysis

4:35 p.m. New York time

After the closing bell. The S&P 500 traded in a narrow range during the day, staying with 23 points on the futures and 14 points on the index. No change in the analysis. I’ve updated the chart.

10:10 a.m. New York time

What’s happening now? The S&P 500 E-mini futures fell overnight to 4370.75 in a small correction within the final leg of an uptrend that began on July 19.

What does it mean? The uptrend, typically, will end close to the boundary of the price channel that began in March, presently in the 4360s and rising.

What’s the alternative? Uptrends sometimes fall short of the boundary by a large measure, a condition called “truncation” in Elliott wave theory. So it’s possible that yesterday’s high, 4422.50, was the end of the uptrend, and the overnight decline was a first step in a significant downtrend.

[S&P 500 E-mini futures at 4:35 p.m., 6-hour bars, with volume]

What does Elliott wave theory say? By my principle count, the overnight decline was a correction within rising wave 5 of Minuscule degree within wave 5 of Submicro degree. The simultaneous completion of those waves, near the upper boundary of the price channel, will mark the end of wave 3 of Micro degree within wave 5 of Subminuette degree. Micro 3 will be followed by a 4th wave correction — probably a sideways-trending Flat pattern — and then a 5th wave push to new highs.

Under my alternative count, wave 5 of Minuscule degree up to wave 3 of Micro degree ended well short of the channel boundary, at yesterday’s high of 4422.50. Under this scenario, the overnight decline was a first step in wave A of Submicro degree within wave 4 of Micro degree.

Learning and other resources. See the menu page Analytical Methods for a rundown on where to go for information on Elliott wave analysis.

By Tim Bovee, Portland, Oregon, July 30, 2021

Disclaimer

Tim Bovee, Private Trader tracks the analysis and trades of a private trader for his own accounts. Nothing in this blog constitutes a recommendation to buy or sell stocks, options or any other financial instrument. The only purpose of this blog is to provide education and entertainment.

No trader is ever 100 percent successful in his or her trades. Trading in the stock and option markets is risky and uncertain. Each trader must make trading decisions for his or her own account, and take responsibility for the consequences.

License
Creative Commons License

All content on Tim Bovee, Private Trader by Timothy K. Bovee is licensed under a Creative Commons Attribution-ShareAlike 4.0 International License.

Based on a work at www.timbovee.com.

SP500 Analysis

3:30 p.m.

Half an hour before the closing bell. The highs so far in the resumed uptrend are 4422.50 on the futures, 4429.97 on the index. I’ve updated the chart, indicating which labels have changed from this morning’s analysis.

11:30 a.m.

New high. So much for intuition. The S&P 500 moved above last Friday’s high, to 4421.75 on the futures, 4429.27 on the index. So my the alternative analysis proves to be the right one. The July 27 low is the end of wave 4 of Minuscule degree, and the subsequent price movement is wave 5 of Minuscule degree. More to come in my afternoon wrap.

9:35 a.m. New York time

What’s happening now? The S&P 500 E-mini futures rose slightly in overnight trading, remaining below the July 26 high.

What does it mean? The lack of directional enthusiasm suggests to me that the correction that began on July 26 is still underway. This was yesterday’s alternative analysis, and I’ve promoted it to the principle analysis today.

What’s the alternative? Under this count, the correction ended at yesterday’s low, 4364.75, and the subsequent rise is a resumption of the uptrend and will soon produce new highs.

[S&P 500 E-mini futures at 3:31 p.m., 30-minute bars, with volume]

What does Elliott wave theory say? Under the principle analysis, yesterday’s low, 4364.75, marked the end of wave A of Subminuscule degree within wave 4 of Minuscule degree within wave 5 of Submicro degree, which began on July 19 from 4224.

Under the alternative analysis, yesterday’s low marked the end of wave 4 of Minuscule degree.

Elliott wave analysis has an intuitive aspect, a right “look and feel”. The resumption of an uptrend looks very directional, like a line on the chart. The rise from Friday is very different, like a scribble by a bored child, with no clear sense of direction. That intuitive reasoning is why I’ve concluded that the 4th wave correction is still underway.

A move above the July 26 high, 4416.75, will confirm the alternative count as correct. While the price remains below that level, the principle analysis appears to be the most likely.

Learning and other resources. See the menu page Analytical Methods for a rundown on where to go for information on Elliott wave analysis.

By Tim Bovee, Portland, Oregon, July 29, 2021

Disclaimer

Tim Bovee, Private Trader tracks the analysis and trades of a private trader for his own accounts. Nothing in this blog constitutes a recommendation to buy or sell stocks, options or any other financial instrument. The only purpose of this blog is to provide education and entertainment.

No trader is ever 100 percent successful in his or her trades. Trading in the stock and option markets is risky and uncertain. Each trader must make trading decisions for his or her own account, and take responsibility for the consequences.

License
Creative Commons License

All content on Tim Bovee, Private Trader by Timothy K. Bovee is licensed under a Creative Commons Attribution-ShareAlike 4.0 International License.

Based on a work at www.timbovee.com.

SP500 Analysis

3:30 p.m. New York time

Half an hour before the closing bell. The S&P 500 rose during the trading day, reaching 4407.75 on the futures, 4415.47 on the index, in the early stages of a Minuscule degree 5th wave rise to new heights, or, in the alternative analysis, a B-wave rise within a Minuscule 4th wave correction to the downside. There was nothing in today’s trading to resolve the choice. I’ve updated the chart.

9:35 a.m. New York time

What’s happening now? The S&P 500 rose in overnight trading from Thursday’s low of 4364.75, reaching 4404.50 as the opening bell approached.

What does it mean? In my principle analysis, the decline from the high of 4416.75 on July 26 was a correction within the uptrend that began on July 19, and the subsequent rise suggests that the final leg of the uptrend is underway.

What’s the alternative? It’s possible to view the decline and rise a two stages within the correction, with a decline following this morning’s rise. If the price moves above 4416.75, then the principle analysis is correct. If the price returns to a decline without rising above that level, then the alternative count is correct.

[S&P 500 E-mini futures at 3:30 p.m., hourly bars, with volume]

What does Elliott wave theory say? The rise that began July 19 is wave 5 of Submicro degree. Internally, it is nearing completion of its 5th and final wave, of Minuscule degree. The end of Submicro 5 will also be the end of wave 3 of Micro degree, which began on May 19. The price in the 4th wave Micro degree correction that will follow must remain above the end of the preceding 1st wave, at 4179.50, in order to satisfy a rule of Elliott wave analysis.

Learning and other resources. See the menu page Analytical Methods for a rundown on where to go for information on Elliott wave analysis.

By Tim Bovee, Portland, Oregon, July 28, 2021

Disclaimer

Tim Bovee, Private Trader tracks the analysis and trades of a private trader for his own accounts. Nothing in this blog constitutes a recommendation to buy or sell stocks, options or any other financial instrument. The only purpose of this blog is to provide education and entertainment.

No trader is ever 100 percent successful in his or her trades. Trading in the stock and option markets is risky and uncertain. Each trader must make trading decisions for his or her own account, and take responsibility for the consequences.

License
Creative Commons License

All content on Tim Bovee, Private Trader by Timothy K. Bovee is licensed under a Creative Commons Attribution-ShareAlike 4.0 International License.

Based on a work at www.timbovee.com.

My Trades

2:20 p.m. New York time

Update. I’ve updated with results my entry analysis of my short bear call options spreads on XBI.

9:15 a.m. New York time

Options. I’ve exited short bear call options spreads on XBI for 54.8% of maximum potential profit. Under my rules, 50% of max profit or better triggers a sale. The position on Friday would have reached 21 days before expiration and so would have been exited if profitable to any degree. The next entry window, for the options expiring September 17, begins today and runs through August 10, with August 3, which is 45 days before expiration, being the midpoint.

I shall update my entry analysis with results later today.

Shares. I added to my NFLX and TSLA stock positions on Monday, and also opened positions on MDB, NVDA, TDOC and ZM. Positions added earlier, in addition to NFLX and TSLA, are AAPL, GLD and Bitcoin.

Methodology. For shares at this point I’m using traditional methods — glance at the fundamentals and the news, and buy on the drops. These holdings are meant for the long-term.

By Tim Bovee, Portland, Oregon, July 27, 2021

Disclaimer

Tim Bovee, Private Trader tracks the analysis and trades of a private trader for his own accounts. Nothing in this blog constitutes a recommendation to buy or sell stocks, options or any other financial instrument. The only purpose of this blog is to provide education and entertainment.

No trader is ever 100 percent successful in his or her trades. Trading in the stock and option markets is risky and uncertain. Each trader must make trading decisions for his or her own account, and take responsibility for the consequences.

License
Creative Commons License

All content on Tim Bovee, Private Trader by Timothy K. Bovee is licensed under a Creative Commons Attribution-ShareAlike 4.0 International License.

Based on a work at www.timbovee.com.

SP500 Analysis

3:30 p.m. New York time

Half an hour before the closing bell. The S&P 500 continued to work its way lower in a downward correction within uptrending wave 5 of Minuscule degree. The price so far has fallen to 4364.75 on the futures, 4372.51 on the index. I’ve updated the chart below.

9:45 a.m. New York time

What’s happening now? The S&P 500 E-mini futures in overnight trading stayed below Monday’s high of 4416.25.

What does it mean? The final wave of the rise that began July 19 is still underway. It will be followed by a correction.

What’s the alternative? It’s possible that Monday’s high marks the end of the rise from July 19. I consider this to be less likely, in part because the price is well below the upper boundary of the price channel that began on March 4.

[S&P 500 E-mini futures at 3:30 p.m., 6-hour bars, with volume]

What does Elliott wave theory say? By my principle count, the rise that began on July 19 is wave 5 of Minuscule degree within wave 5 of Submicro degree within wave 3 of Micro degree, which began on May 19. Micro 3 will be followed by a 4th wave correction that will stay above 4178.75, which is the end of wave 1 of Micro degree.

Under the alternative count, Monday’s high is the end of wave 3 of Micro degree and the 4th wave correction is underway.

Learning and other resources. See the menu page Analytical Methods for a rundown on where to go for information on Elliott wave analysis.

By Tim Bovee, Portland, Oregon, July 27, 2021

Disclaimer

Tim Bovee, Private Trader tracks the analysis and trades of a private trader for his own accounts. Nothing in this blog constitutes a recommendation to buy or sell stocks, options or any other financial instrument. The only purpose of this blog is to provide education and entertainment.

No trader is ever 100 percent successful in his or her trades. Trading in the stock and option markets is risky and uncertain. Each trader must make trading decisions for his or her own account, and take responsibility for the consequences.

License
Creative Commons License

All content on Tim Bovee, Private Trader by Timothy K. Bovee is licensed under a Creative Commons Attribution-ShareAlike 4.0 International License.

Based on a work at www.timbovee.com.

SP500 Analysis

3:30 p.m. New York time

Half an hour before the closing bell. The S&P 500 continued to rise during the day, to a high so far of 4413.25, surpassing last Friday’s high of 4408.25. Wave 4 of Minuscule degree continues its upward track.

9:40 a.m. New York time

What’s happening now? The S&P 500 E-mini futures declined when trading resumed over the weekend, reaching a low of 4375.50, nearly 33 points below Friday’s high of 4408.25. At the opening bell it resumed its rise.

What does it mean? My count views the Friday peak as the end of the middle leg within the uptrend that began July 21. The decline over the weekend was a correction, to be followed by a rise to new heights in the final leg of the uptrend.

What’s the alternative? It’s possible to view the Friday peak as the end of the final leg of the rise from July 21. If that’s the case, then it will be the end of the rise from July 19 and will be followed by a correction of the rise that began May 19.

[S&P 500 E-mini futures at 3:30 p.m., hourly bars, with volume]

What does Elliott wave theory say? Under my principle count, Friday’s peak ends wave 3 of Subminuscule degree within wave 5 of Minuscule degree, which began on July 21. Subminuscule wave 4 is now underway and will be followed by a rising wave 5 of Subminuscule degree. The completion of Subminuscule 5 will also mark the end of parent 5th of of Minuscule and Submicro degrees, and up one degree higher, the end of wave 3 of Micro degree, which began on May 19.

Under the alternative count, Friday’s peak ends wave 5 of Subminuscule degree and the parent degrees described above. The correction of the rise that began on May 19 under this scenario is now underway.

If the pride rises above 4408.25, then the principle analysis is correct.

See the chart in Friday’s post for a broader view, back to last March.

Learning and other resources. See the menu page Analytical Methods for a rundown on where to go for information on Elliott wave analysis.

By Tim Bovee, Portland, Oregon, July 26, 2021

Disclaimer

Tim Bovee, Private Trader tracks the analysis and trades of a private trader for his own accounts. Nothing in this blog constitutes a recommendation to buy or sell stocks, options or any other financial instrument. The only purpose of this blog is to provide education and entertainment.

No trader is ever 100 percent successful in his or her trades. Trading in the stock and option markets is risky and uncertain. Each trader must make trading decisions for his or her own account, and take responsibility for the consequences.

License
Creative Commons License

All content on Tim Bovee, Private Trader by Timothy K. Bovee is licensed under a Creative Commons Attribution-ShareAlike 4.0 International License.

Based on a work at www.timbovee.com.

SP500 Analysis

3:30 p.m. New York time

Half an hour before the closing bell. The S&P 500 pushed past the June 14 peak to new highs, 4405.50 on the futures and 4412.81 on the index. The rise that began on February 23, 2020 — wave 5 of Minor degree — is still underway. At a smaller degree, the wave I’m tracking is wave 5 of Submicro degree. No change to the analysis. I’ve updated the chart.

9:50 a.m. New York time

What’s happening now? The S&P 500 E-mini futures continued to rise overnight, reaching a high of 4383 so far today. The price is a point and a half below the July 14 high.

What does it mean? The continuing rise shows that the uptrend that began on February 23, 2020 is still underway.

What’s the alternative? The primary uncertainty at this point is how high the price will go. A reasonable target is the upper boundary of the price channel tracking the rise that began March 4, presently in the 4530s. But a higher high of any amount will be sufficient to satisfy the requirements of Elliott wave theory.

[S&P 500 E-mini futures at 3:30 p.m., 6-hour bars, with volume]

What does Elliott wave theory say? The rise that began on July 19 from 4224 is wave 5 of Submicro degree. It’s completion will cascade up the degrees, marking an end of 5th waves of Micro, Subminuette, Minuette and Minor degrees, and up one more, the end of wave 3 Minor degree.

Learning and other resources. See the menu page Analytical Methods for a rundown on where to go for information on Elliott wave analysis.

By Tim Bovee, Portland, Oregon, July 23, 2021

Disclaimer

Tim Bovee, Private Trader tracks the analysis and trades of a private trader for his own accounts. Nothing in this blog constitutes a recommendation to buy or sell stocks, options or any other financial instrument. The only purpose of this blog is to provide education and entertainment.

No trader is ever 100 percent successful in his or her trades. Trading in the stock and option markets is risky and uncertain. Each trader must make trading decisions for his or her own account, and take responsibility for the consequences.

License
Creative Commons License

All content on Tim Bovee, Private Trader by Timothy K. Bovee is licensed under a Creative Commons Attribution-ShareAlike 4.0 International License.

Based on a work at www.timbovee.com.

SP500 Analysis

3:30 p.m. New York time

Half an hour before the closing bell. The S&P 500 barely budged during the day as the closing bell approached. The high on the futures so far has been 4361.25, and on the index, 4369.87. No change in the analysis. I’ve updated the chart.

9:35 a.m. New York time

What’s happening now? The S&P 500 E-mini futures continued to rise in overnight trading, reaching a high of 4361.25, within 25 points of the July 14 high, 4384.50.

What does it mean? The price on Wednesday violated a rule of Elliott wave analysis, requiring a re-analysis of the chart. The principle analysis had considered the July 14 peak to be the end of a major uptrend and the beginning of a downtrend. The new principle analysis (formerly the alternative) counts the uptrend as still underway.

Under the new analysis, I expect the price to move above 4384.50 and to eventually come close to the upper boundary of the price channel that began on March 17, which would bring it to the 4500s or higher.

What’s the alternative? The price could fail to reach the upper boundary of the price channel, which appeared to be the case before yesterday, ending the uptrend and beginning a major downtrend.

[S&P 500 E-mini futures at 3:30 p.m., 6-hour bars, with volume]

What does Elliott wave theory say? Under the old principle analysis, the July 14 peak was counted as the end of wave 5 of Submicro degree, ending an uptrend that had begun on July 20 and a larger-degree uptrend that had begun on February 23, 2020.

The new analysis labels the July 14 high as the end of wave 3 of Submicro degree, the subsequent decline as Submicro wave 4, and the rise that began July 19 and is still underway as Submicro wave 5.

The end of Submicro 5 will also be the end of the wave 3 of Micro degree and of the parent wave, Subminuette wave 5. Above that level, in ascending degrees, the end of Subminuette wave 5 will also mark the end of Minuette 5, Minute 5 and Minor 3.

The price channel on the chart tracks the Subminuette degree. The end of Subminuette wave 5, in an ideal form, would approach or throw itself over the upper boundary of the channel. But that’s an ideal, not a requirement. It could very well fall significantly short of that boundary. That scenario is my alternative analysis.

Learning and other resources. See the menu page Analytical Methods for a rundown on where to go for information on Elliott wave analysis.

By Tim Bovee, Portland, Oregon, July 22, 2021

Disclaimer

Tim Bovee, Private Trader tracks the analysis and trades of a private trader for his own accounts. Nothing in this blog constitutes a recommendation to buy or sell stocks, options or any other financial instrument. The only purpose of this blog is to provide education and entertainment.

No trader is ever 100 percent successful in his or her trades. Trading in the stock and option markets is risky and uncertain. Each trader must make trading decisions for his or her own account, and take responsibility for the consequences.

License
Creative Commons License

All content on Tim Bovee, Private Trader by Timothy K. Bovee is licensed under a Creative Commons Attribution-ShareAlike 4.0 International License.

Based on a work at www.timbovee.com.