SP500 Analysis

3:30 p.m. New York time

Half an hour before the closing bell. The S&P 500 has continued to rise during the day, but only slightly, reaching 4348.75 on the futures and 4356.94 on the index. So far it has retraced 78% of the decline from July 14. More importantly, this rise, labeled a 4th wave has moved beyond the end of the 1st wave, violating a firm rule of Elliott wave analysis.

I’ve updated the chart but left the labelling as it was this morning — time constraints — and will post a revised labeling on Thursday morning. At this point I’m not all sure what’s going on.

9:45 a.m. New York time

What’s happening now? The S&P 500 E-mini futures paused overnight, rising only slightly above its level at yesterday’s closing bell and peaking 46 points below the July 14 high.

What does it mean? The slowing of the rise suggests that the correction of the decline that ended on July 18 is nearing an end, or possibly that the first leg of that correction is ending.

What’s the alternative? If the price resumes its rise today, exceeding the July 14 high of 4384.50, then the subsequent decline has been a correction within the continuing rise that began on July 20, and at a larger scale, began in Februrary 2020.

[S&P 500 E-mini futures at 3:30 p.m., 45-minute bars, with volume]

What does Elliott wave theory say? I’ve counted the low of 4224 on July 19 as the end of wave 3 of Minuscule degree within wave 1 of Submicro degree, the first steps of a downtrend that will eventually reach below 2000. (See yesterday’s analysis for a big picture discussion of the chart.) The subsequent rise, up to a high of 4338.50 at today’s opening bell, is wave 2 of Minuscule degree, and 2nd wave correction. It is possible that the rise is the first wave, the A wave of Subminuscule degree, within Minuscule wave 2.

Were the price to exceed the July 14 peak of 4384.50, then wave 5 of Submicro degree, which began on June 20, would still be underway. The subsequent decline would be a correction within that 5th wave.

Learning and other resources. See the menu page Analytical Methods for a rundown on where to go for information on Elliott wave analysis.

By Tim Bovee, Portland, Oregon, July 21, 2021

Disclaimer

Tim Bovee, Private Trader tracks the analysis and trades of a private trader for his own accounts. Nothing in this blog constitutes a recommendation to buy or sell stocks, options or any other financial instrument. The only purpose of this blog is to provide education and entertainment.

No trader is ever 100 percent successful in his or her trades. Trading in the stock and option markets is risky and uncertain. Each trader must make trading decisions for his or her own account, and take responsibility for the consequences.

License
Creative Commons License

All content on Tim Bovee, Private Trader by Timothy K. Bovee is licensed under a Creative Commons Attribution-ShareAlike 4.0 International License.

Based on a work at www.timbovee.com.

SP500 Analysis

3:30 p.m. New York time

Half an hour before the closing bell. The S&P 500 rose during the day, reaching 4329 on the futures, 4336.84 on the index, remaining about 50 points or a little less below the July 14 peak of 4384.50. No change to the analysis. I’ve updated the chart.

9:45 a.m. New York time

What’s happening now? In overnight trading, the S&P 500 E-mini futures reversed from Monday’s low, 4224, in a small-degree correction within the downtrend that began July 14 from 4384.50.

What does it mean? The decline that began on July 14 is a first small step in a downtrend that will eventually fall by 2000 points and more. The July 14 high marks the end of an uptrend that began February 23, 2020.

What’s the alternative? If the price reversal continues to rise and exceeds the high of July 14 — 4384.50 on the futures, 4393.68 on the index — then the uptrend that began in February 2020 is still underway, and the entire decline since July 14 has been a correction within that uptrend.

[S&P 500 E-mini futures at 3:30 p.m., 250-minute bars, with volume]

What does Elliott wave theory say? Under the principle analysis, the July 14 peak ended wave 3 of Minor degree, the 3rd leg of an expanding Diagonal Triangle that began on December 26, 2018 as wave 5 of Intermediate degree. Prices in diagonal triangles bounce between the boundaries of a price channel that grows wider every day. The channel low today is about 2030, and in the time it takes the price reach that level, the boundary will have moved further down. So it’s a chase, of sorts. At the lower boundary the price can be expected to to reverse and begin a trip back up to the upper boundary as wave 4 of Minor degree, and after that, wave 5 will chase back down to the lower boundary, bringing the Diagonal Triangle to an end.

Nearer term, the decline from the July 14 peak will take the form of sets of five waves, three in the direction of the trend, separated by two corrections. The waves in the direction of the trend will in turn contain five waves internally, and those contrary to the trend will have three internal waves. That’s ignoring for now the complexities that can make Elliott wave analysis a challenge. Presently, I count the decline as being in wave 4 of Minuscule degree within wave 1 of Submicro degree — the first baby steps of what will be a long process.

In the alternative analysis, if the price rises above the end of wave 3 of Minor degree, 4384.50 on the futures, then Minor wave 3 is still underway and the decline that began on July 14 is a correction within Minor 3.

Learning and other resources. See the menu page Analytical Methods for a rundown on where to go for information on Elliott wave analysis.

By Tim Bovee, Portland, Oregon, July 20, 2021

Disclaimer

Tim Bovee, Private Trader tracks the analysis and trades of a private trader for his own accounts. Nothing in this blog constitutes a recommendation to buy or sell stocks, options or any other financial instrument. The only purpose of this blog is to provide education and entertainment.

No trader is ever 100 percent successful in his or her trades. Trading in the stock and option markets is risky and uncertain. Each trader must make trading decisions for his or her own account, and take responsibility for the consequences.

License
Creative Commons License

All content on Tim Bovee, Private Trader by Timothy K. Bovee is licensed under a Creative Commons Attribution-ShareAlike 4.0 International License.

Based on a work at www.timbovee.com.
SP500 Analysis

3:30 p.m. New York time

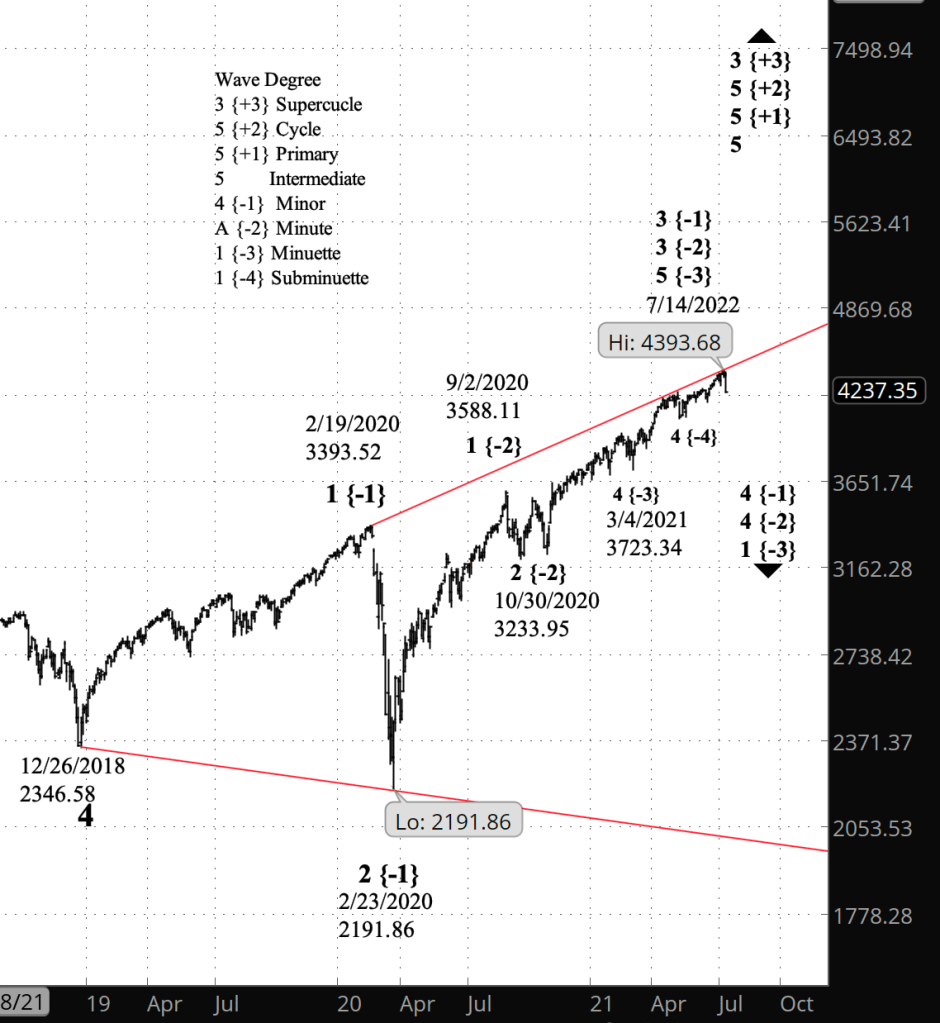
Half an hour before the closing bell. The S&P 500 continued to decline during the day, the futures reaching 4224 and the index, 4233.13. I’ve updated the near-term chart from this morning, and have added a long-term chart showing the expanding triangle that began in 2018 and is continuing.

[S&P 500 index at 3:37 p.m., 2-day bars]

9:50 a.m. New York time

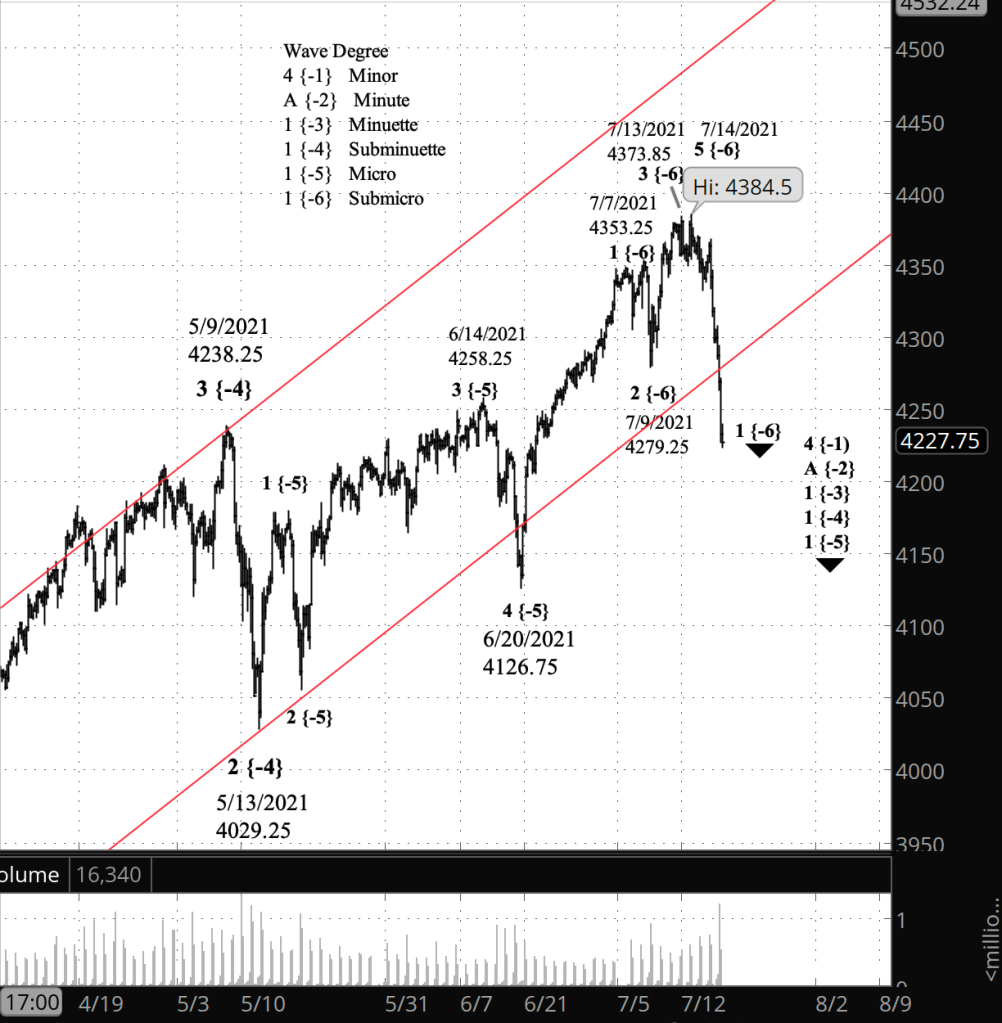
What’s happening now? The S&P 500 E-mini futures fell sharply overnight, reaching below the lower boundary of the price channel that began in March, to a low of 4262.50 at the opening bell.

What does it mean? The power of the decline requires a re-analysis of the rise from June 20. Under my new principle count, the July 14 peak of 4384.50 marks the end of the uptrend that began on February 23, and the beginning of a significant downtrend.

What’s the alternative? If the price rises above 4384.50 then something else is going on, perhaps an expanding Diagonal Triangle.

[S&P 500 E-mini futures at 3:30 p.m., 4-hour bars, with volume]

What does Elliott wave theory say? In re-analyzing the rise from June 20, I’ve made the following changes to the labelling on the chart:

  1. I’ve moved the end of wave 3 of Submicro degree to the July 13 high of 4373.85.
  2. I’ve labelled the peak of July 14 at 4384.5 as the end of wave 5 of Submicro degree.
  3. I’ve retained the unnaturally long wave 1 of Submicro degree, keeping its endpoint at 4353.25 on July 7.

See the prior labeling in the upper chart of Friday’s SP500 post. As I noted on Friday, the length of wave 1 is troubling because under the rules of Elliott wave analysis, the 3rd wave cannot be shorter than both wave 1 and wave 5. A long wave 1 suggests that there’s trouble down the road in finding a count that satisfies that rule.

The sharp decline suggests that the July 14 peak was the end of wave 5 of Submicro degree. That being the case, the best count that satisfies the Elliott wave rule on length is to end wave 1 on July 7, as with the earlier count. And to accept an unnaturally short wave 3 by ending it on July 13. And then to accept a very short 5th wave ending on July 14. That makes the 5th wave shorter than wave 3, satisfying the rule. Truncated 5th waves aren’t uncommon.

The end of wave 5 of Submicro degree cascades up the degrees, also marking the end of 5th waves of Micro, Minuette, Subminuette and Minute degrees, and also ending wave 3 of Minor degree, which began on February 23, 2020, the end of the early pandemic crash.

So the present decline, from July 14, becomes wave A of Minute degree within wave 4 of Minor degree, the beginning of a downtrend that will eventually reach an impressive scale. This 4th wave is part of an expanding Diagonal Triangle, and its target is the triangle’s lower boundary, now at 2038 and moving lower each day. (See the lower chart in Friday’s SP500 post.)

If the alternative analysis proves to be correct, then what we’re seeing is a smaller expanding Diagonal Triangle, at the Subminuette degree, beginning on July 20.

Learning and other resources. See the menu page Analytical Methods for a rundown on where to go for information on Elliott wave analysis.

By Tim Bovee, Portland, Oregon, July 19, 2021

Disclaimer

Tim Bovee, Private Trader tracks the analysis and trades of a private trader for his own accounts. Nothing in this blog constitutes a recommendation to buy or sell stocks, options or any other financial instrument. The only purpose of this blog is to provide education and entertainment.

No trader is ever 100 percent successful in his or her trades. Trading in the stock and option markets is risky and uncertain. Each trader must make trading decisions for his or her own account, and take responsibility for the consequences.

License
Creative Commons License

All content on Tim Bovee, Private Trader by Timothy K. Bovee is licensed under a Creative Commons Attribution-ShareAlike 4.0 International License.

Based on a work at www.timbovee.com.
SP500 Analysis

3:30 p.m. New York time

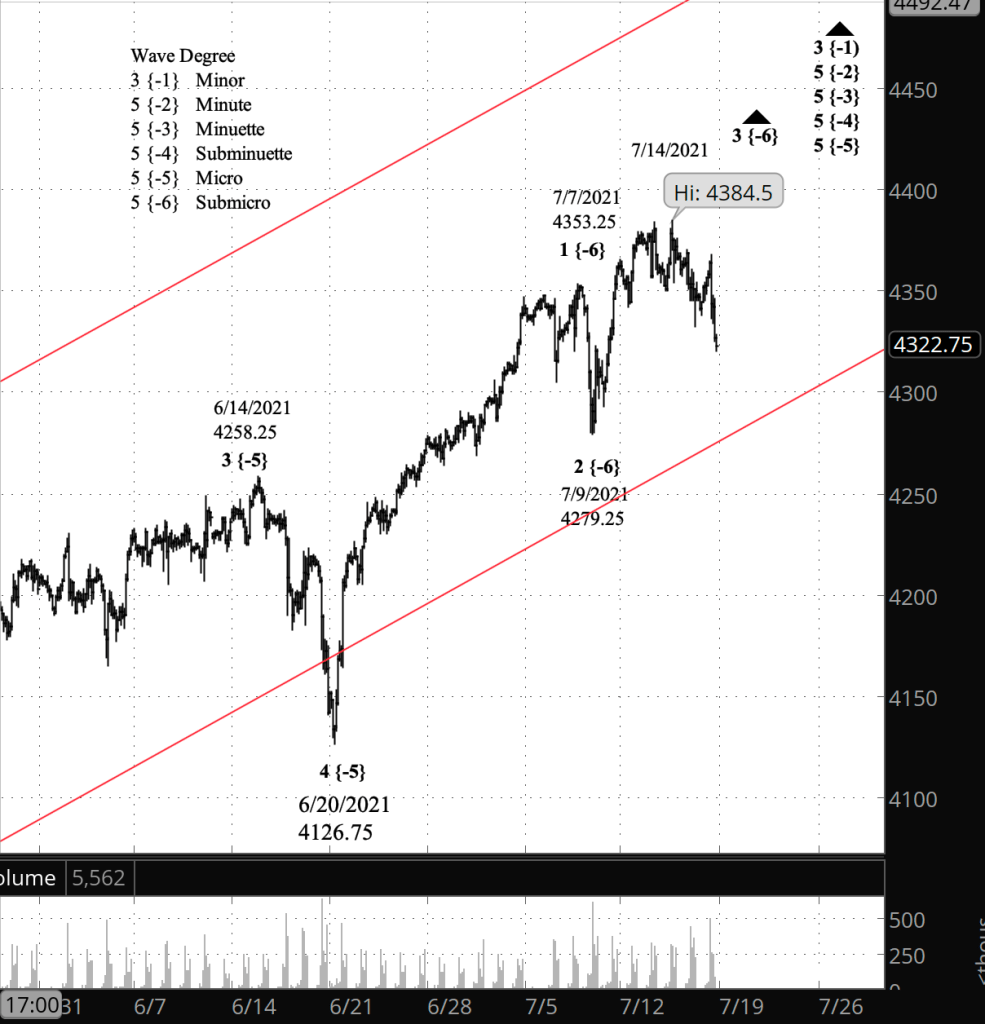
Half an hour before the closing bell. The S&P 500 fell throughout the day, reaching the low 4320s. I’m labeling the movements today as subwaves of a rising wave 3 of Submicro degree. One reason for considering Submicro 3 to still be underway is the brevity of that 3rd wave so far compared to the 1st wave that preceded it. Under Elliott wave theory, a 3rd wave can’t be shorter than both the 1st wave and the 5th wave of set, and indeed 3rds tend to be the longest of the three. But we’ll see what the chart does. This may be one of those atypical movements that make Elliott wave analysis interesting, and challenging.

I’ve updated the shorter-term (top) chart, below.

9:40 a.m. New York time

What’s happening now? The S&P 500 rose in the 4th leg of a small degree rise within a larger uptrend that began on June 20, which in turn is part of a far larger uptrend that began on February 23, 2020, with the price remaining below Wednesday’s high of 4384.50 on the E-mini futures, 4393.68 on the index.

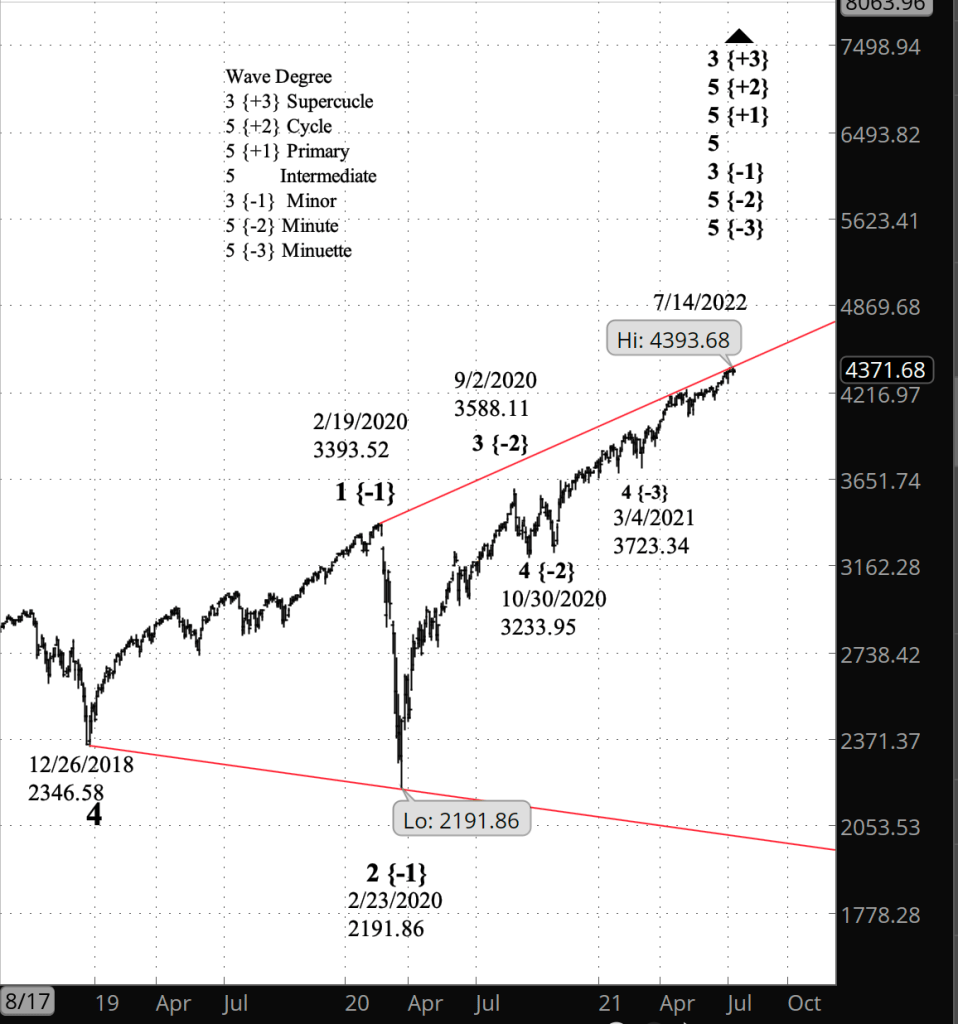
What does it mean? The uptrends, both the smaller and the larger, have since April have been scraping along the upper boundary of an expanding Diagonal Triangle pattern that began on December 26, 2018, suggesting that the market, while still rising, will soon will be pull away and begin a downward journey to the lower boundary of the triangle, presently about 50 points above the 2000 level and falling.

What’s the alternative? It’s possible to count Wednesday’s high as the end of the uptrend from June 20, meaning the present decline is a correction of that rise, or even as the end of the uptrend from February 2020, meaning that the downward journey has already begun. Based on my work in yesterday’s analysis, I consider these to be the less likely interpretations of the chart.

[S&P 500 E-mini futures at 3:30 p.m., 2-hour bars, with volume]
[S&P 500 index at 9:36 a.m., 2-day bars]

What does Elliott wave theory say? The upper boundary of the Diagonal Triangle, connecting the endpoints of waves 1 and 3 of Minor degree, gets bumped a bit higher and steeper with each new high of the S&P 500. In looking at the chart, I’m struck by the change in the angle of the price as it relates to the triangle boundary. Up until April the price was at an angle that brought it every closer to the triangle’s upper boundary. It was on the move. Since April, the price has mimicked the angle of the upper boundary — rising, to be sure, but doing little to push the 3rd wave endpoint of the boundary higher.

Intuitively, the chart looks like a rise that’s running out of steam, to use an old-fashioned phrase at one time much beloved by market commentators. In the terminology of Elliott wave analysis, my principle count has it that rising wave 3 of Submicro degree within wave of Micro degree is still underway. Submicro wave 3 will be followed by a shallow 4th wave correction, and then a final 5th wave push to the upside, completing the parent, Micro wave 5.

A rise to a new high will mean that Submicro 3 is still underway. A decline below the start of Submicro wave 3, from 4279.25 on the futures, will mean the completion of Subicro 3, which would in fact properly counted as Submicro wave 5, and would trigger a complete recount of the rise from June 20 and

The end of wave 5 of Micro degree, whenever it happens, will also mark the end of 5th waves up to Minute degree, four degrees larger, and of the 3rd wave of Minor degree (up one more degree).

Learning and other resources. See the menu page Analytical Methods for a rundown on where to go for information on Elliott wave analysis.

By Tim Bovee, Portland, Oregon, July 16, 2021

Disclaimer

Tim Bovee, Private Trader tracks the analysis and trades of a private trader for his own accounts. Nothing in this blog constitutes a recommendation to buy or sell stocks, options or any other financial instrument. The only purpose of this blog is to provide education and entertainment.

No trader is ever 100 percent successful in his or her trades. Trading in the stock and option markets is risky and uncertain. Each trader must make trading decisions for his or her own account, and take responsibility for the consequences.

License
Creative Commons License

All content on Tim Bovee, Private Trader by Timothy K. Bovee is licensed under a Creative Commons Attribution-ShareAlike 4.0 International License.

Based on a work at www.timbovee.com.
XBI Trade

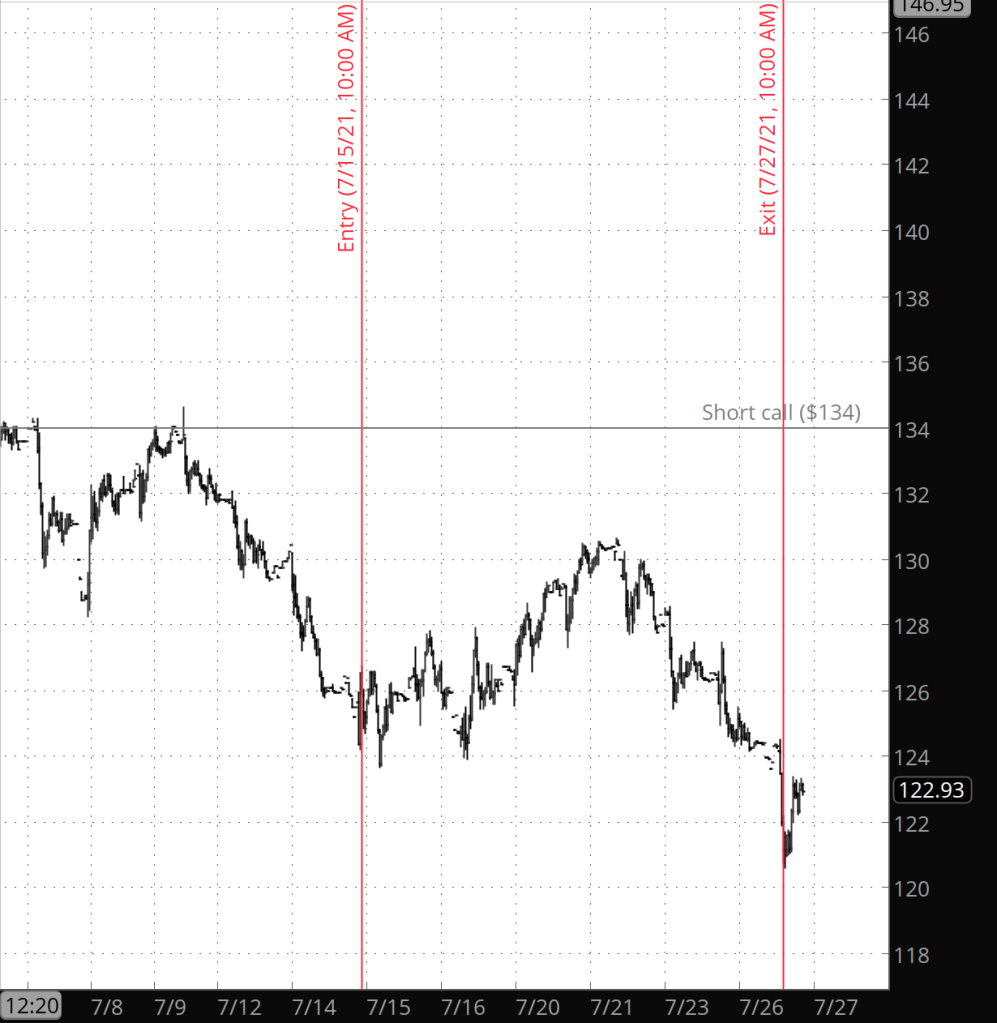
Update 7/27/2021: I exited my short bear call spread position on XBI 24 days before expiration, for a $0.38 debit per contract/share, a profit before fees of $0.92 per contract. Shares were trading at $122.05, down $2.70 from the entry level.

My decision to exit was based on the price reaching more than 50%.of maximum potential profit, as required by my trading rules. The price remained below my short call strike, $34, throughout the life of the position. The entry and exit dates are shown by vertical red lines on the chart, with a horizontal gray line marking short call strike price.

[XBI at 2:15 p.m., 20-minute bars]

Shares declined by 2.2% over nine days for a -65.8% annual rate. The options position produced a 121.1% return for a 3,682% annual rate.


SPDR S&P Biotech ETF (XBI)

Lot 2

I have entered a short bear call spread on XBI, using options that trade for the last time 36 days hence, on August 20. The premium is a $0.84 credit per contract share and the stock at the time of entry was priced at $124.75.

The implied volatility rank (IVR) stands at 30%.

Premium: $0.84 Expire OTM  
XBI-bear call spread Strike Odds Delta
Puts      
Long 140.00 91.0% 11
Break-even 133.16 86.0% 17
Short 134.00 81.0% 23

The premium is 28% of the width of the position’s wing.
The profit zone covers a 6.7% move to the upside.

The risk/reward ratio is 6.1:1, with maximum risk of $516 and maximum reward of $84 per contract.

[XBI, daily bars]

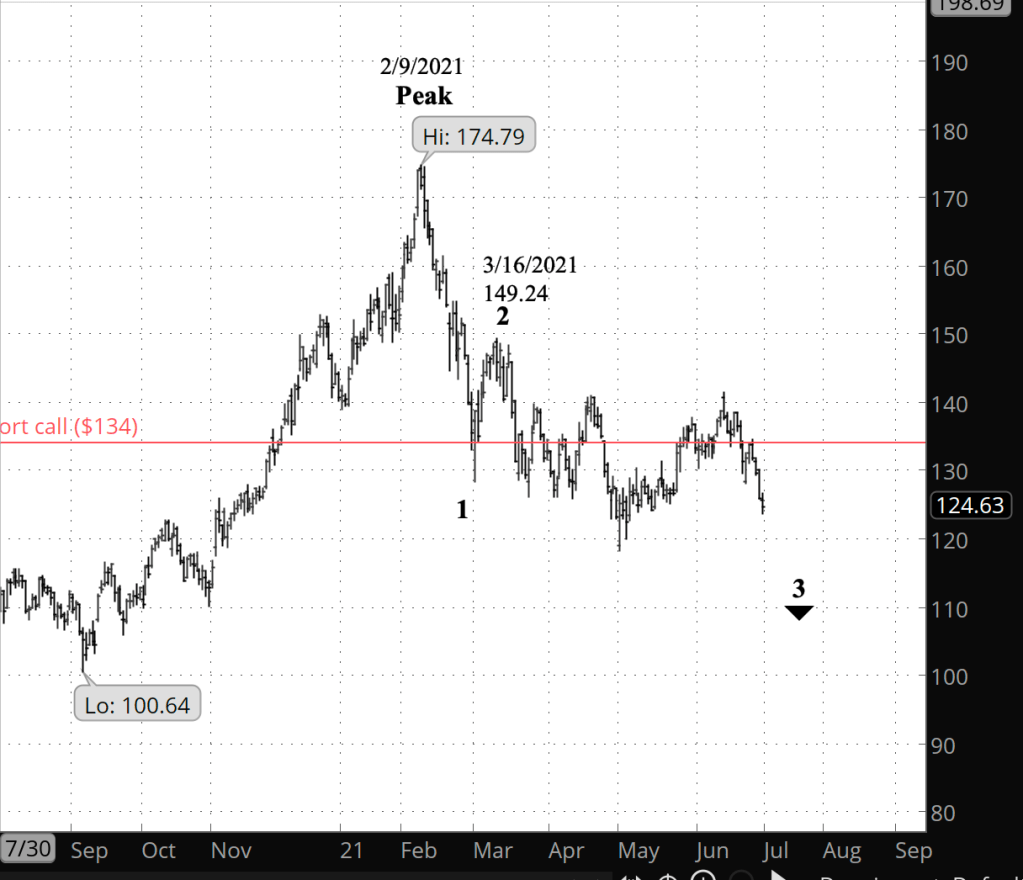
Elliott wave analysis places XBI in a 3rd wave downtrend, and if that analysis holds up, then the price is unlikely to revisit the $134 level, which marks the top of my profit zone.

By Tim Bovee, Portland, Oregon, July 15, 2021

Disclaimer

Tim Bovee, Private Trader tracks the analysis and trades of a private trader for his own accounts. Nothing in this blog constitutes a recommendation to buy or sell stocks, options or any other financial instrument. The only purpose of this blog is to provide education and entertainment.

No trader is ever 100 percent successful in his or her trades. Trading in the stock and option markets is risky and uncertain. Each trader must make trading decisions for his or her own account, and take responsibility for the consequences.

License

All content on Tim Bovee, Private Trader by Timothy K. Bovee is licensed under a Creative Commons Attribution-ShareAlike 4.0 International License.

Based on a work at www.timbovee.com.
SP500 Analysis

3:30 p.m. New York time

Half an hour before the closing bell. The S&P 500 continued to decline during the day, reach a low of 4332.50 on the futures and of 4340.70 on the index. No change to the analysis. I’ve updated the chart.

9:50 a.m. New York time

What’s happening now? The S&P 500 E-mini futures continued to decline from yesterday’s high, 4384.50.

What does it mean? There is some ambiguity. My principle analysis is that the uptrend is still underway. This will be confirmed by a higher high.

What’s the alternative? Or the uptrend could well have ended with yesterday’s high. At this point I consider both analyses to be almost equally likely.

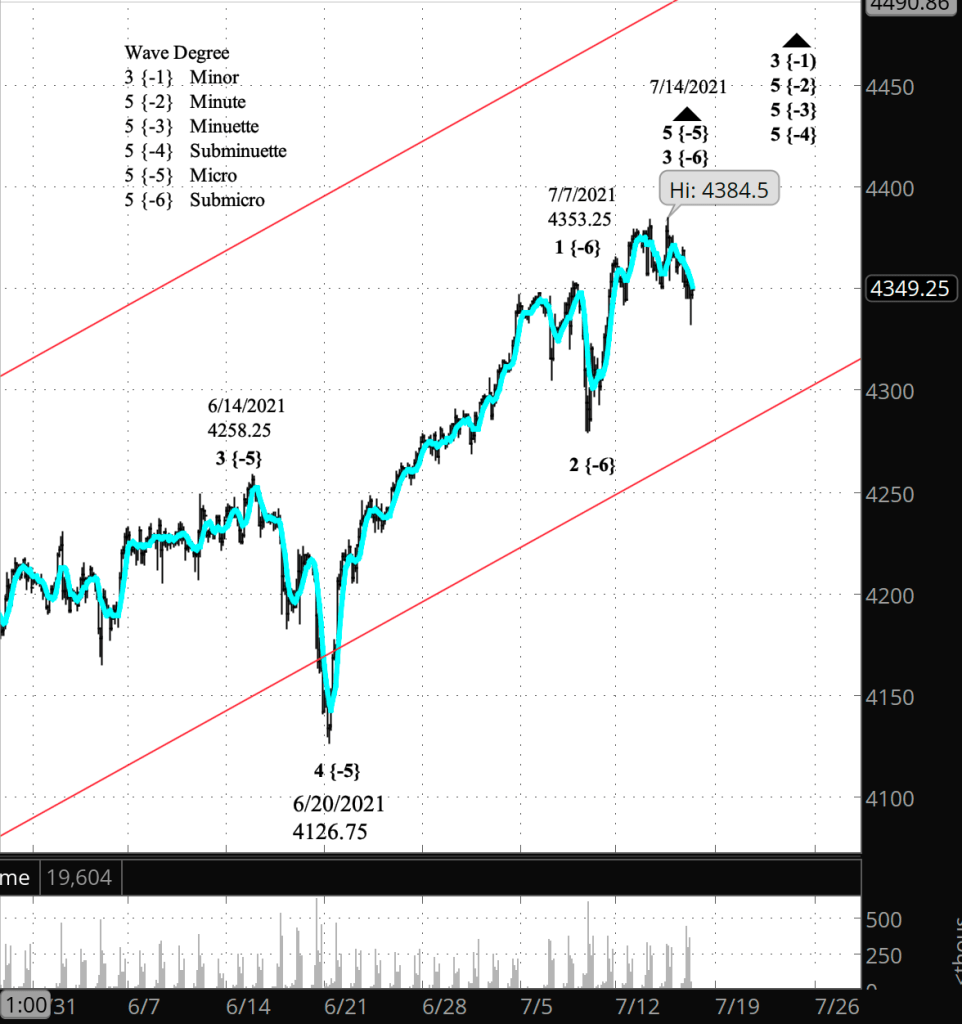
[S&P 500 E-mini futures at 3:29 p.m., 2-hour bars, with volume]

What does Elliott wave theory say? It struck me that it would be useful to pull the chart back to a broader view, so as to not lose sight of the forest for the trees. A difficulty in Elliott wave analysis is always to distinguish between degrees. What one analyst sees as a 2nd wave in the degree under analysis, another analyst sees as a wave of lower degree that can be safely be ignored.

One technique for separating the significant from the insignificant is to overlay the chart with a six-bar moving average — six two-hour bars on the chart above. The moving average is the bright blue line.

So the question is, how many waves can we count beginning with the June 20 low of 4126.75. The moving average shows no declines of significance until July 7, when the price reversed from from a peak of 4353.25. So by this method, the peak is the end of wave 1, and in the broader analytical framework I’ve used, it will be wave 1 of Submicro degree.

The difficulty is that wave 1 seems overly long for such a movement, and the following wave 2 seems two short. Second waves tend to retrace much of the ground covered by the preceding 1st wave. Even if the retracement seems truncated, it’s the largest retracement we have so far on the rise from June 20. And as long as the future wave 3 or wave 5 of Submicro degree is longer than wave 1, then the rules of Elliott wave analysis are satisfied.

Another consideration is that the price is some distance below the upper boundary of the price channel of the degree above Micro, the Subminuette degree. In theory, the price should come close to that upper boundary, which is presently just below 4500 and rising.

Bottom line: The peak of July 14 is within an ongoing wave 3 of Submicro degree within the parent, wave 5 of Micro degree. The uptrend that began on June 20 continues.

Learning and other resources. See the menu page Analytical Methods for a rundown on where to go for information on Elliott wave analysis.

By Tim Bovee, Portland, Oregon, July 15, 2021

Disclaimer

Tim Bovee, Private Trader tracks the analysis and trades of a private trader for his own accounts. Nothing in this blog constitutes a recommendation to buy or sell stocks, options or any other financial instrument. The only purpose of this blog is to provide education and entertainment.

No trader is ever 100 percent successful in his or her trades. Trading in the stock and option markets is risky and uncertain. Each trader must make trading decisions for his or her own account, and take responsibility for the consequences.

License
Creative Commons License

All content on Tim Bovee, Private Trader by Timothy K. Bovee is licensed under a Creative Commons Attribution-ShareAlike 4.0 International License.

Based on a work at www.timbovee.com.
SPCE Exit

2:20 p.m. New York time

I’ve exited my bear call options spread position on SPCE, two days before expiration, and have updated the entry post with results.

By Tim Bovee, Portland, Oregon, July 14, 2021

Disclaimer

Tim Bovee, Private Trader tracks the analysis and trades of a private trader for his own accounts. Nothing in this blog constitutes a recommendation to buy or sell stocks, options or any other financial instrument. The only purpose of this blog is to provide education and entertainment.

No trader is ever 100 percent successful in his or her trades. Trading in the stock and option markets is risky and uncertain. Each trader must make trading decisions for his or her own account, and take responsibility for the consequences.

License
Creative Commons License

All content on Tim Bovee, Private Trader by Timothy K. Bovee is licensed under a Creative Commons Attribution-ShareAlike 4.0 International License.

Based on a work at www.timbovee.com.
SP500 Analysis

3:30 p.m. New York time

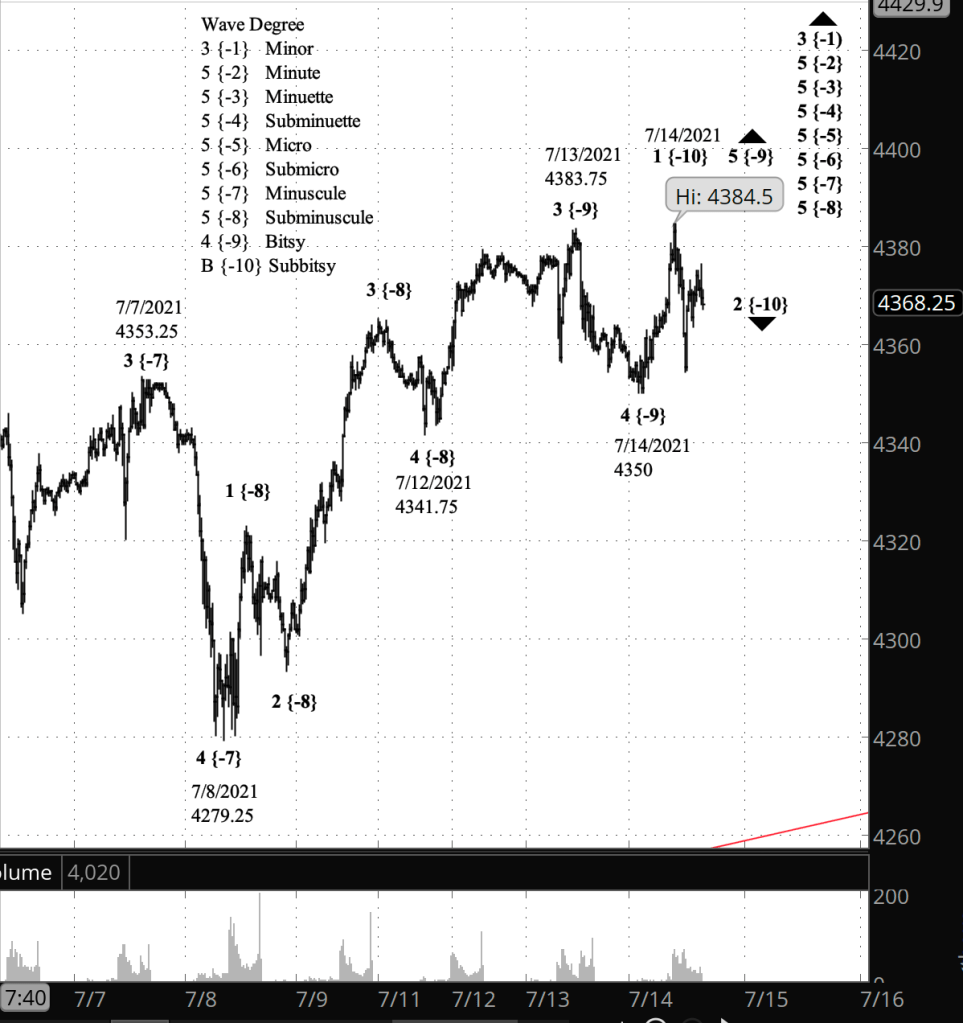
Half an hour before the closing bell. The S&P 500 declined from its overnight high, 4384.50, and then rose again, so far remaining below the high. By my count the decline is wave 2 of Subbitsy degree, and the subsequent rise is either wave B within Bitsy wave 2, which must remain below the high, or the start of wave 3 of Bitsy degree, which will move above the high. I’ve updated the chart.

9:40 a.m. New York time

What’s happening now? The S&P 500 E-mini futures fell overnight to a low of 4350 and then rose to a new high.

What does it mean? The rise continues the uptrend that began on July 12 within a much larger uptrend that began February 23, 2020.

What are the alternatives? The higher high removes the immediate ambiguities from the chart.

[S&P 500 E-mini futures at 3:30 p.m., 20-minute bars, with volume]

What does Elliott wave theory say? The move to a new high means that the 4th wave correction of Bitsy degree ended at last night’s low of 4350 and wave 5 of Bitsy degree is underway, with no limit on how high it can go, beyond the need that it remain proportional to other waves of that degree. The rise is part of an expanding diagonal triangle that began on December 26, 2018. The price is now at the upper boundary of the triangle.

Learning and other resources. See the menu page Analytical Methods for a rundown on where to go for information on Elliott wave analysis.

By Tim Bovee, Portland, Oregon, July 14, 2021

Disclaimer

Tim Bovee, Private Trader tracks the analysis and trades of a private trader for his own accounts. Nothing in this blog constitutes a recommendation to buy or sell stocks, options or any other financial instrument. The only purpose of this blog is to provide education and entertainment.

No trader is ever 100 percent successful in his or her trades. Trading in the stock and option markets is risky and uncertain. Each trader must make trading decisions for his or her own account, and take responsibility for the consequences.

License
Creative Commons License

All content on Tim Bovee, Private Trader by Timothy K. Bovee is licensed under a Creative Commons Attribution-ShareAlike 4.0 International License.

Based on a work at www.timbovee.com.
SP500 Analysis

3:30 p.m. New York time

Half an hour before the closing bell. The S&P 500, having set a new high in the morning, has drawn back, trading more than 20 points below the peak. No change in the analysis. I’ve updated the top chart.

10:55 a.m. New York time

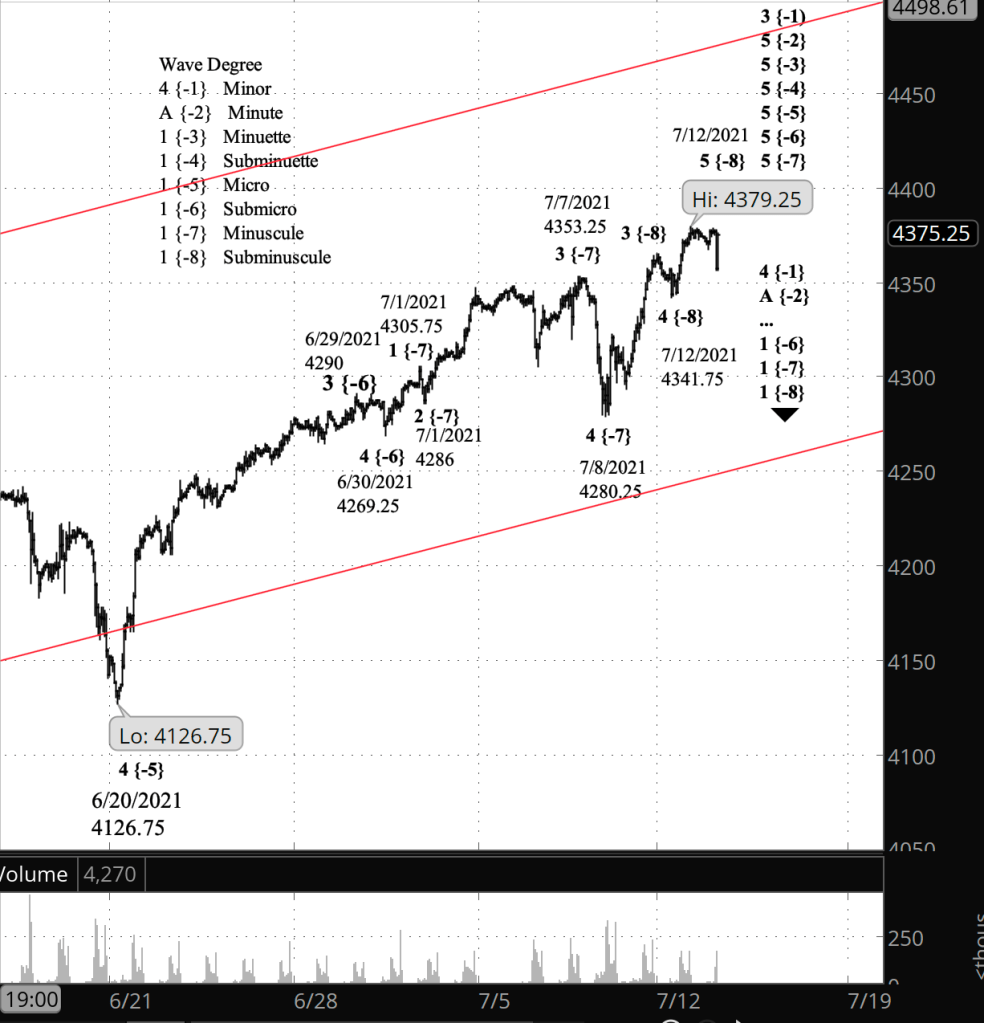
Alternative analysis wins. Well, that was fast. The S&P 500 E-mini futures reversed course and rose to a new high, meaning that the alternative analysis is the correct one. Wave 5 of Subminuscule degree and 5th waves up Minute degree are still underway, as is wave 3 of Minor degree.

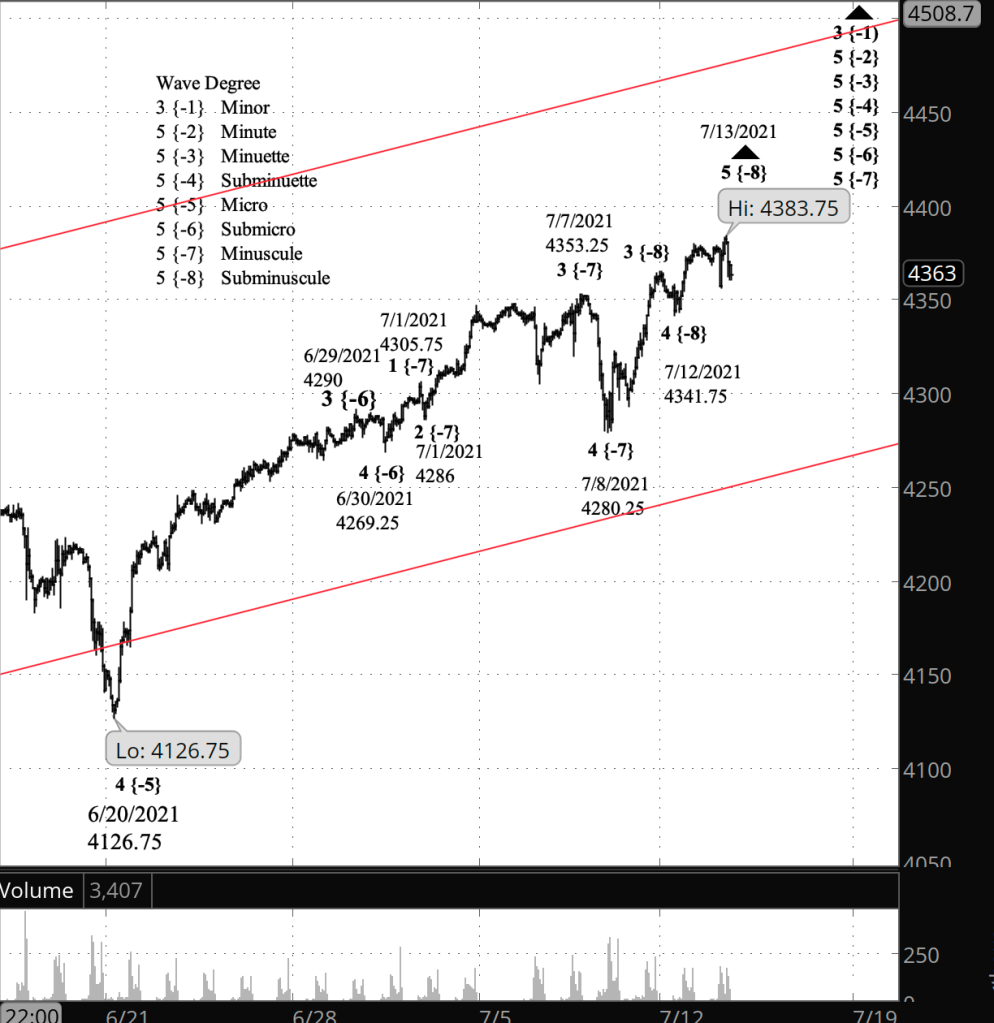
[S&P 500 E-mini futures at 3:30 p.m., hourly bars, with volume]

9:55 a.m. New York time

What’s happening now? The S&P 500 E-mini futures sharply reversed from Monday’s high of 4379.25.

What does it mean? Same song different verse. If the price remains below Monday’s high, then that level marks the end of the rise from June 20 and indeed the end of the rise that began on February 23, 2020. If it moves below Monday’s low of 4341.75, then the odds strengthen that a major downtrend has begun.

What’s the alternative? If the price reverses and moves above Monday’s high to a still higher high, then the rise that began on June 20 and indeed in February of last year is still underway.

[S&P 500 E-mini futures at 9:55 a.m., hourly bars, with volume]

What does Elliott wave theory say? I’ve marked the chart according to the principle analysis, although at this point, I find it impossible to choose between it and the alternative analysis.

Under the principle analysis, Monday’s high of 4379.25 marks the end of wave 5 of Subminuscule degree, and indeed of parent 5th waves up six degrees to Minute degree. Up one degree further, the peak marks the end of wave 3 of Minor degree, which began on February 23, 2020 from 2191.86 on the index and somewhere close to that level on the futures.

The ensuing decline is the start of wave 4 of Minor degree, a shallow correction that commonly takes the form of a Flat, although there are other possibilities. Fourth waves typically end with the price range of wave 4 within the preceding wave 3; in this case, wave 4 of Minute degree within wave 3 of Minor degree. The price range on the index is from 3588.11 down to 3233.95, levels set in September and October of last year.

Under the alternative analysis, a move of the price above Monday’s high of 4379.25 means that wave 3 of Minor degree is still under way, as are its child waves — 5th waves down to Minuscule degree and lower. See the top chart in yesterday’s analysis for a sense of what that labeling would look like.

Under the alternative analysis, there is no limit on how high the price can rise; fifth waves have a tendency to extend, sometimes to an extraordinary length.

Bottom line, we are back in ambiguity and won’t know which analysis turns out to be correct until the price tells us.

Learning and other resources. See the menu page Analytical Methods for a rundown on where to go for information on Elliott wave analysis.

By Tim Bovee, Portland, Oregon, July 13, 2021

Disclaimer

Tim Bovee, Private Trader tracks the analysis and trades of a private trader for his own accounts. Nothing in this blog constitutes a recommendation to buy or sell stocks, options or any other financial instrument. The only purpose of this blog is to provide education and entertainment.

No trader is ever 100 percent successful in his or her trades. Trading in the stock and option markets is risky and uncertain. Each trader must make trading decisions for his or her own account, and take responsibility for the consequences.

License
Creative Commons License

All content on Tim Bovee, Private Trader by Timothy K. Bovee is licensed under a Creative Commons Attribution-ShareAlike 4.0 International License.

Based on a work at www.timbovee.com.
SP500 Analysis

3:30 p.m. New York time

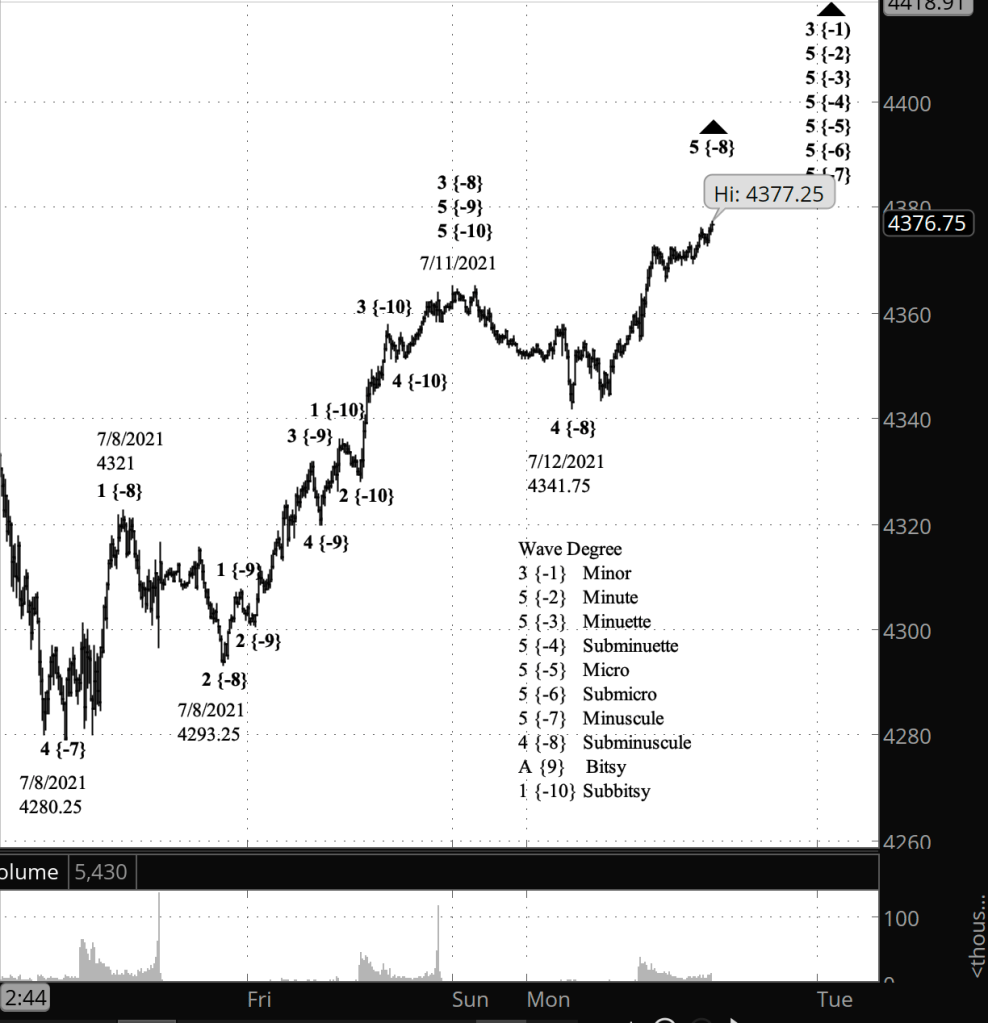
Half an hour before the closing bell. The S&P 500 continued to rise, reaching a high of 4377.25 on the futures and 4385.57 on the index. Afterward it continued to trade just below the highs. Wave 5 of Subminuscule degree is still underway. I’ve updated the top chart of the two posted earlier today.

11:10 a.m. New York time

Price follows alternative path. My alternative analysis has proven correct, as the price moved to a new high after the opening bell. Wave 5 of Subminuscule degree is underway. Here’s a chart with the revised count. I’ve retained the chart I posted this morning so that the changes are apparent.

[S&P 500 E-mini futures at 3:30 p.m., 8-minute bars, with volume]

9:45 a.m. New York time

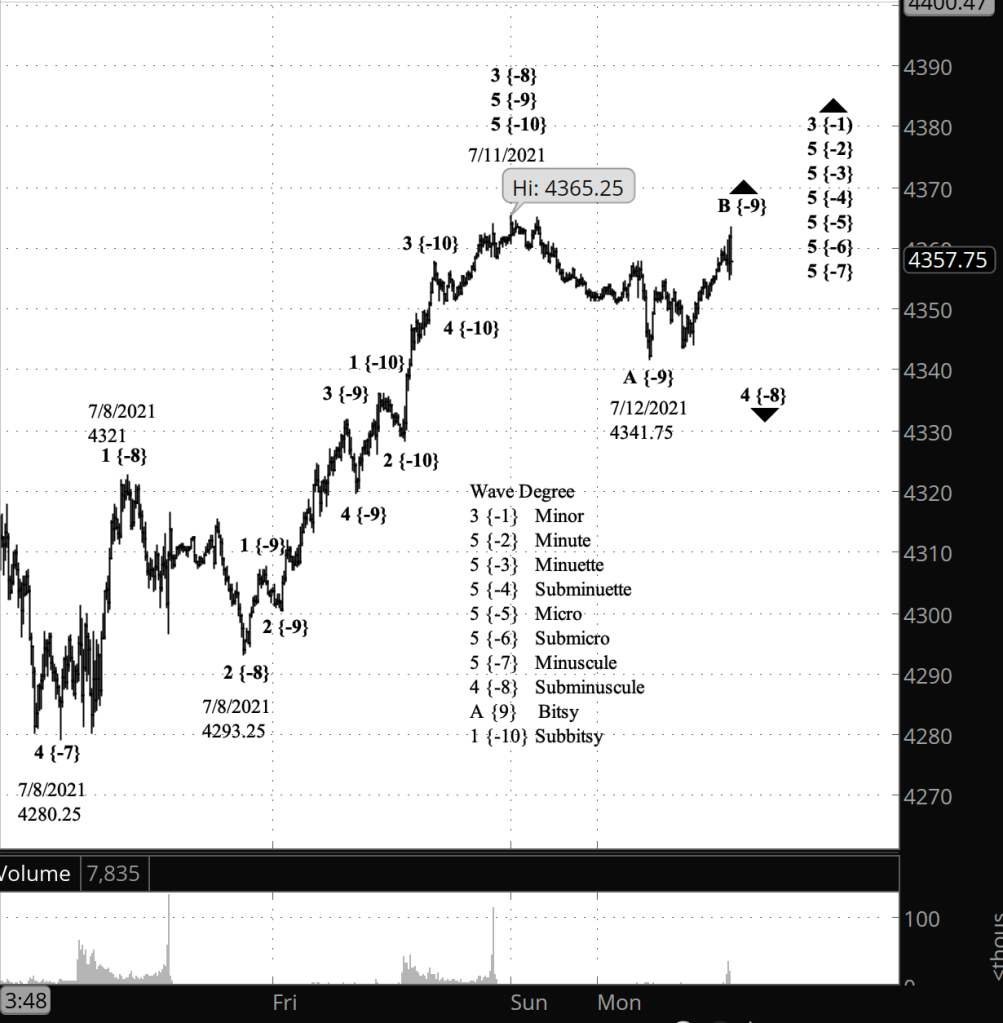
What’s happening now? The S&P 500 E-mini futures moved to a new high of 4365.25 after trading resumed on Sunday, and then reversed, reaching a low of 4341.75. The price then reversed to the upside but remained below Sunday’s peak.

What does it mean? The decline from Sunday’s peak is a shallow correction within the small rise that began on July 8 from 4280.25, the last leg of a very large rise that began in February 2020. The present rise within the correction will be followed by a further decline, possibly completing the correction, which will be followed by a push up to new highs. I say “possibly” because the correction could prove to be a complex pattern, pasting several simple corrective patterns together.

What’s the alternative? If the present rise moves above Sunday’s high, then the early morning low of 4341.75 marks the end of the correction, and the push to higher highs has already begun.

[S&P 500 E-mini futures at 9:42 a.m., 7-minute bars, with volume]

What does Elliott wave theory say? In the chart I’ve moved in close to see the detailed wave count within wave 5 of Minuscule degree, which began on July 8 from 4280.25. Within Minuscule 5, Sunday’s peak, 4365.25, marked the end of wave 3 of Subminuscule degree and the beginning of Subminuscule wave 4, a correction that appears to be taking a Flat pattern. One common occurrence in 4th waves is that they extend into complex patterns. The basic corrective pattern is three waves, and a complex correction consists of a basic pattern, a connector wave, and then another basic pattern. Sometimes the correction will go on to a third corrective pattern.

Within Subminuscule 4, the A wave of Bitsy degree, to the downside, ended at 4341.75 and the B wave of Bitsy degree, to the upside, is still underway. Bitsy wave B must remain below the beginning of the parent 4th wave’s starting point of 4365.25.

If the price in fact moves above the 4th wave’s starting point, then the alternative analysis kicks in; what I have labeled as wave A becomes the end of wave 4 of Subminuscule degree, and the rise from that point is an ongoing wave 5 of Subminuscule degree. I consider this alternative to be less likely.

Learning and other resources. See the menu page Analytical Methods for a rundown on where to go for information on Elliott wave analysis.

By Tim Bovee, Portland, Oregon, July 12, 2021

Disclaimer

Tim Bovee, Private Trader tracks the analysis and trades of a private trader for his own accounts. Nothing in this blog constitutes a recommendation to buy or sell stocks, options or any other financial instrument. The only purpose of this blog is to provide education and entertainment.

No trader is ever 100 percent successful in his or her trades. Trading in the stock and option markets is risky and uncertain. Each trader must make trading decisions for his or her own account, and take responsibility for the consequences.

License
Creative Commons License

All content on Tim Bovee, Private Trader by Timothy K. Bovee is licensed under a Creative Commons Attribution-ShareAlike 4.0 International License.

Based on a work at www.timbovee.com.