SP500 Analysis

3:30 p.m. New York time

Half an hour before the closing bell. The S&P 500 traded slightly below its peak of the day as wave 5 of Minuscule degree resumed its rise. It is the final wave of that relatively small degree within a much larger uptrend, wave 3 of Minor degree, that began on February 23, 2020, at the floor of the crash that marked the early weeks of the pandemic. Minor 3 will be followed by a significant correction that will remain above that February 2020 low, 2191.86 on the index, and will followed by still higher highs months or perhaps more than a year down the road. The high so far today on the futures so far is 4362.50, and on the index, 4370.52. I’ve updated the top chart of this post.

12:45 p.m. New York time

Midday updated. And the ambiguity on the chart has been resolved. The S&P 500 moved to a new high, meaning that the decline from the July 7 high, ending wave 3 of Minuscule degree, was a 4th wave correction, down to 4280.25. The price subsequently rose to a high so far today of 4357.75 on the futures, and 4365.89 on the index. Long story short: The uptrend that began on June 20 is still underway, as is the larger uptrend that began on February 23, 2020.
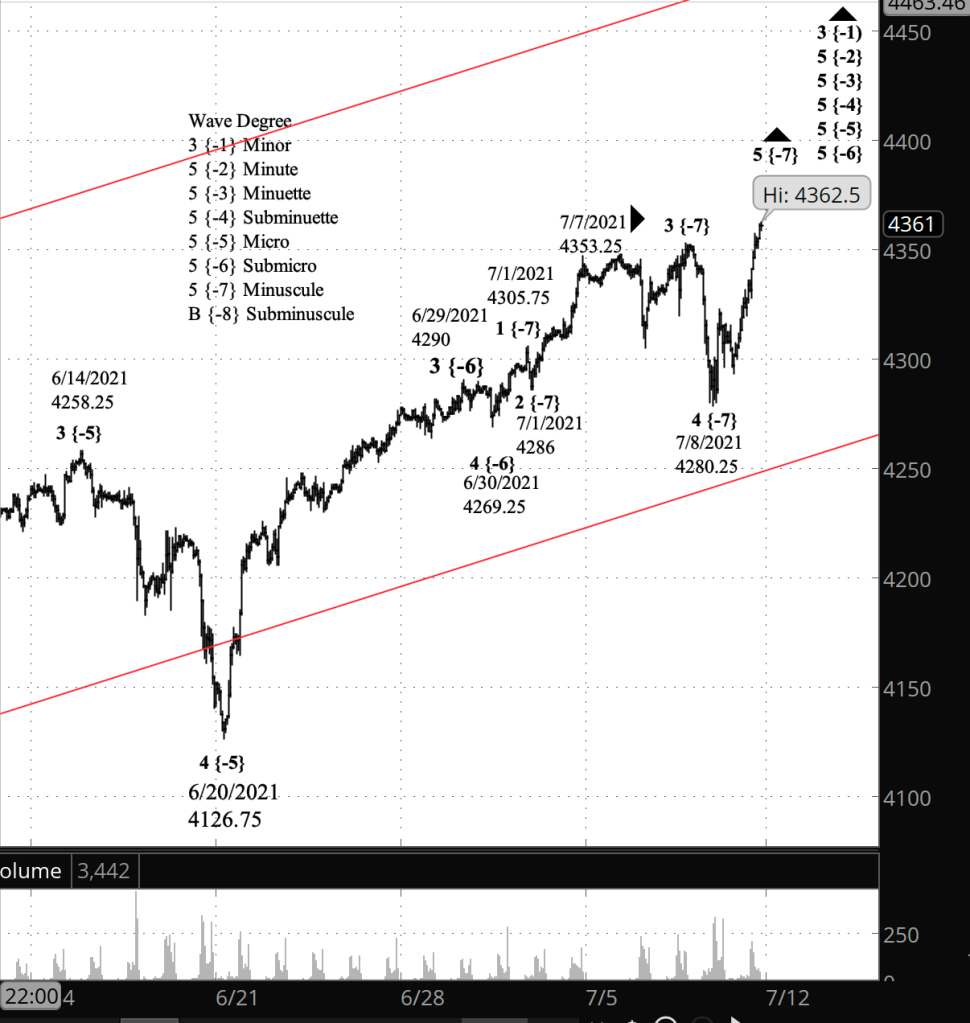
[S&P 500 E-mini futures at 3:30 p.m., hourly bars, with volume]

10:05 a.m. New York time

What’s happening now? The S&P 500 E-mini futures continued to rise in overnight trading, having remained below the July 7 high of 4353.25 and above the June 30 low of 4269.25.

What does it mean? By remaining within the range defined by those two prices, the meaning of the track set by the price remains ambiguous.

A move above the July 7 high would mean that the decline that followed the peak is a correction within an ongoing rise.

What’s the alternative? A move below the June 30 low would mean that the decline from July 7 is the beginning of a downtrend that will reach significant proportions.
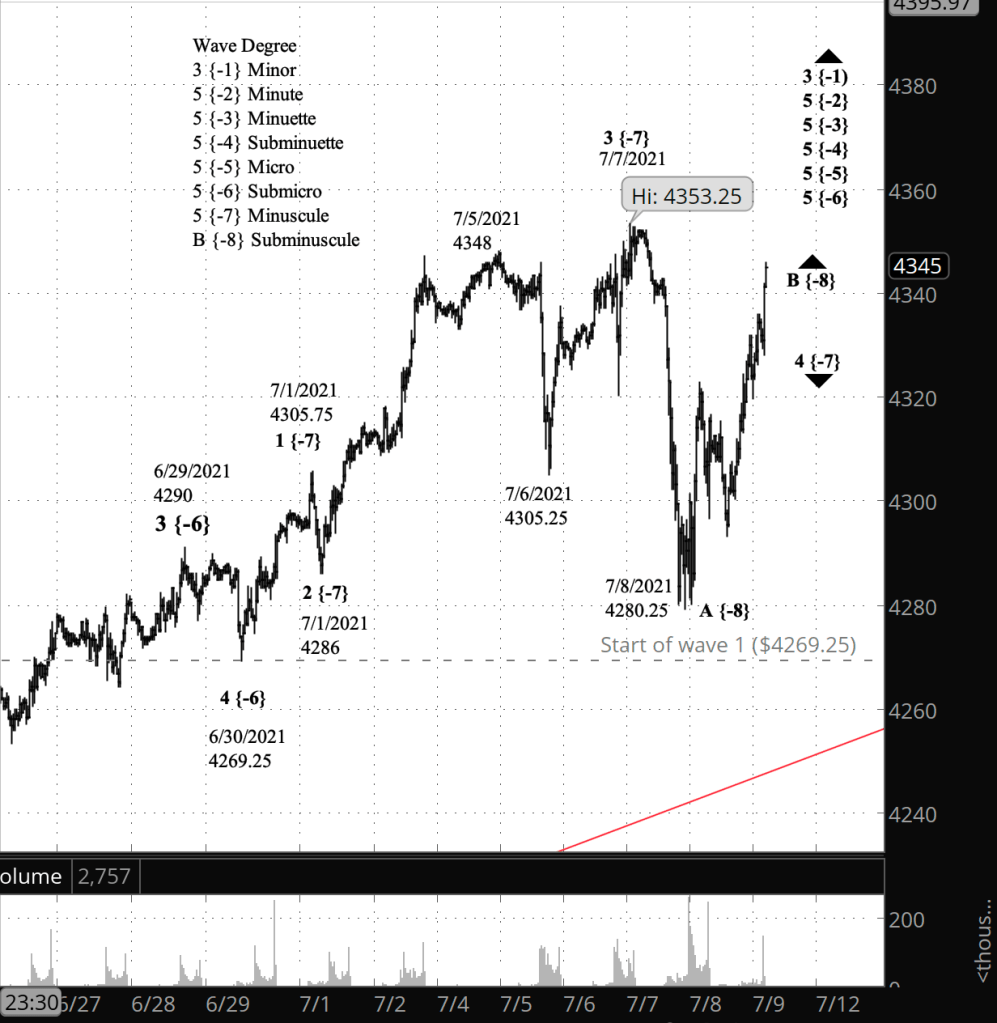
[S&P 500 E-mini futures at 10:04 a.m., 30-minute bars, with volume]

What does Elliott wave theory say? On the chart I’ve analyzed the movements from July 7 to match the first alternative, with the expectation that the price will move above the July 7 high, which marked the end of wave 3 of Minuscule degree. The Minuscule wave 4 correction to the downside is now underway.

Under the second alternative, the July 7 high would mark the end of wave 5 of Minuscule degree, and also of increasingly larger 5th waves up five levels to Minute degree, and above that, wave 3 of Minor degree. The subsequent decline is wave 1 of Minuscule degree, a small step in what will be a major downtrend.

As long as the price remains between the July 7 high of 4353.25 and the June 30 low of 4269.25, I can’t choose between those alternatives.

See yesterday’s analysis for a discussion of why the 4269.25 level is important.

Learning and other resources. See the menu page Analytical Methods for a rundown on where to go for information on Elliott wave analysis.

By Tim Bovee, Portland, Oregon, July 9, 2021

Disclaimer

Tim Bovee, Private Trader tracks the analysis and trades of a private trader for his own accounts. Nothing in this blog constitutes a recommendation to buy or sell stocks, options or any other financial instrument. The only purpose of this blog is to provide education and entertainment.

No trader is ever 100 percent successful in his or her trades. Trading in the stock and option markets is risky and uncertain. Each trader must make trading decisions for his or her own account, and take responsibility for the consequences.

License
Creative Commons License

All content on Tim Bovee, Private Trader by Timothy K. Bovee is licensed under a Creative Commons Attribution-ShareAlike 4.0 International License.

Based on a work at www.timbovee.com.
SP500 Analysis

3:30 p.m. New York time

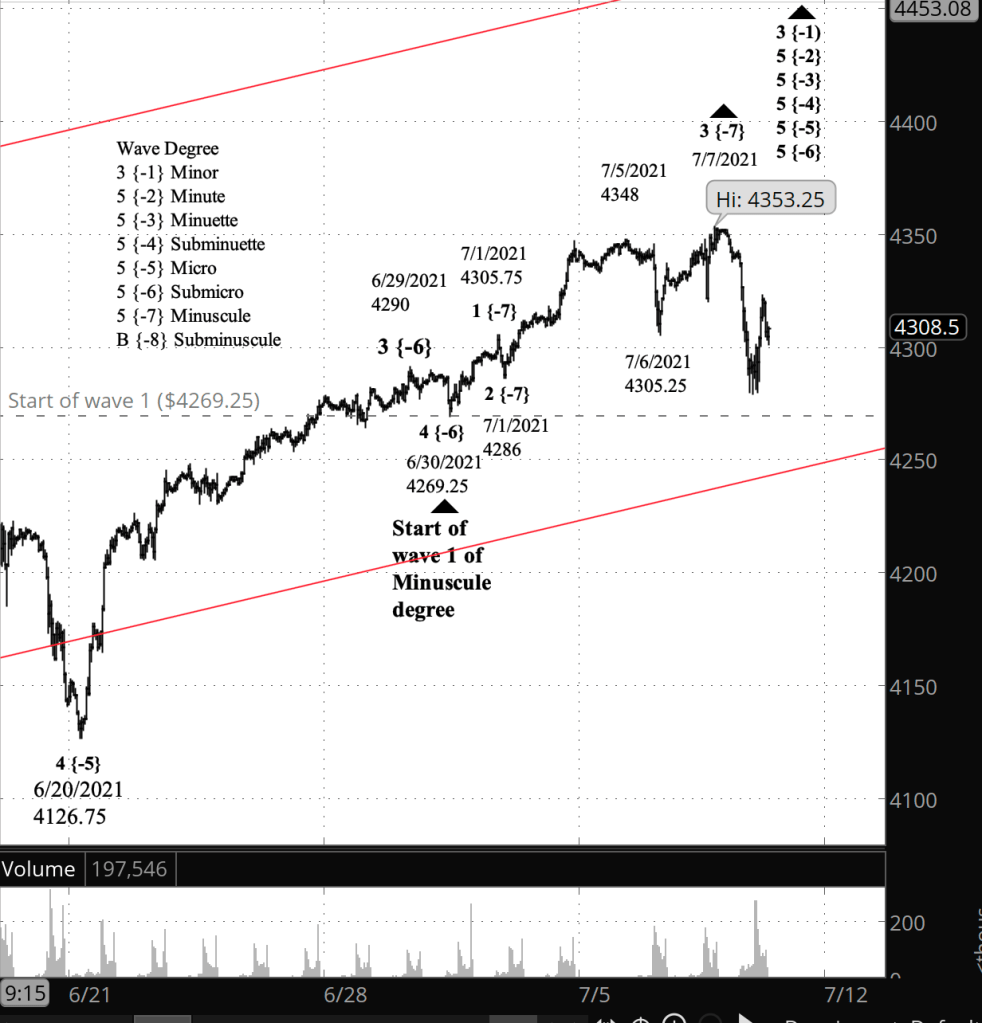
Half an hour before the closing bell. The S&P 500 rose from its overnight low, remaining above the start of wave 1 of Minuscule degree and below yesterday’s high. That positioning keeps alive the two equally likely alternatives discussed in this morning’s post. I’ve updated the chart, in the process correcting a labelling error. The wave number immediately above the price label for yesterday’s high, 4353.25, should read 3 {-7} rather than 4 {-7}.

9:55 a.m. New York time

What’s happening now? The S&P 500 E-mini futures dropped sharply in overnight trading from yesterday’s high of 4353.25, reaching a low so far of 4279.25.

What does it mean? If the price moves below 4269.25 — another 10 points lower — then the rise that began June 20 is complete, and the decline is the first step in what will become a major downtrend.

What’s the alternative? If the price remains above 4269.25 and reverses to rise above 4353.25, then the rise that began June 20 is still underway, and the price can be expected to reach still higher levels.

I consider both alternatives to be a equal likelihood. I can’t choose between them.

[S&P 500 E-mini futures at 3:30 p.m., 45-minute bars, with volume]

What does Elliott wave theory say? A rule of Elliott wave analysis says that a 4th wave cannot move beyond the start of the preceding 1st wave. That rule is the key to understanding the chart at this point.

Wave 1 of Minuscule degree began on June 30 from 4269.25. If Minuscule wave 3 is still underway (the count shown on the chart), then the overnight decline must be a 4th wave following the end of Minuscule 3. If the decline moves below 4279.25, then Minuscule 4 will have moved below the start of Minuscule 1, breaking the rule cited above.

Should that rule be broken under the present count, then the count must be revised as follows: The July 7 peak at 4353.25 becomes the end of wave 5 of Minuscule degree, and also the end of the rise that began June 20. The July 5 high of 4348 becomes the end of wave 3, and the June 6 low of 4305.25 becomes the end of wave 4.

The end of Minuscule wave 5 also means the end of parent 5th waves up to Minute degree, and also, one more degree larger, the end of wave 3 of Minor degree, which began on February 23, 2020.

Learning and other resources. See the menu page Analytical Methods for a rundown on where to go for information on Elliott wave analysis.

By Tim Bovee, Portland, Oregon, July 8, 2021

Disclaimer

Tim Bovee, Private Trader tracks the analysis and trades of a private trader for his own accounts. Nothing in this blog constitutes a recommendation to buy or sell stocks, options or any other financial instrument. The only purpose of this blog is to provide education and entertainment.

No trader is ever 100 percent successful in his or her trades. Trading in the stock and option markets is risky and uncertain. Each trader must make trading decisions for his or her own account, and take responsibility for the consequences.

License
Creative Commons License

All content on Tim Bovee, Private Trader by Timothy K. Bovee is licensed under a Creative Commons Attribution-ShareAlike 4.0 International License.

Based on a work at www.timbovee.com.
SP500 Analysis

3:30 p.m. New York time

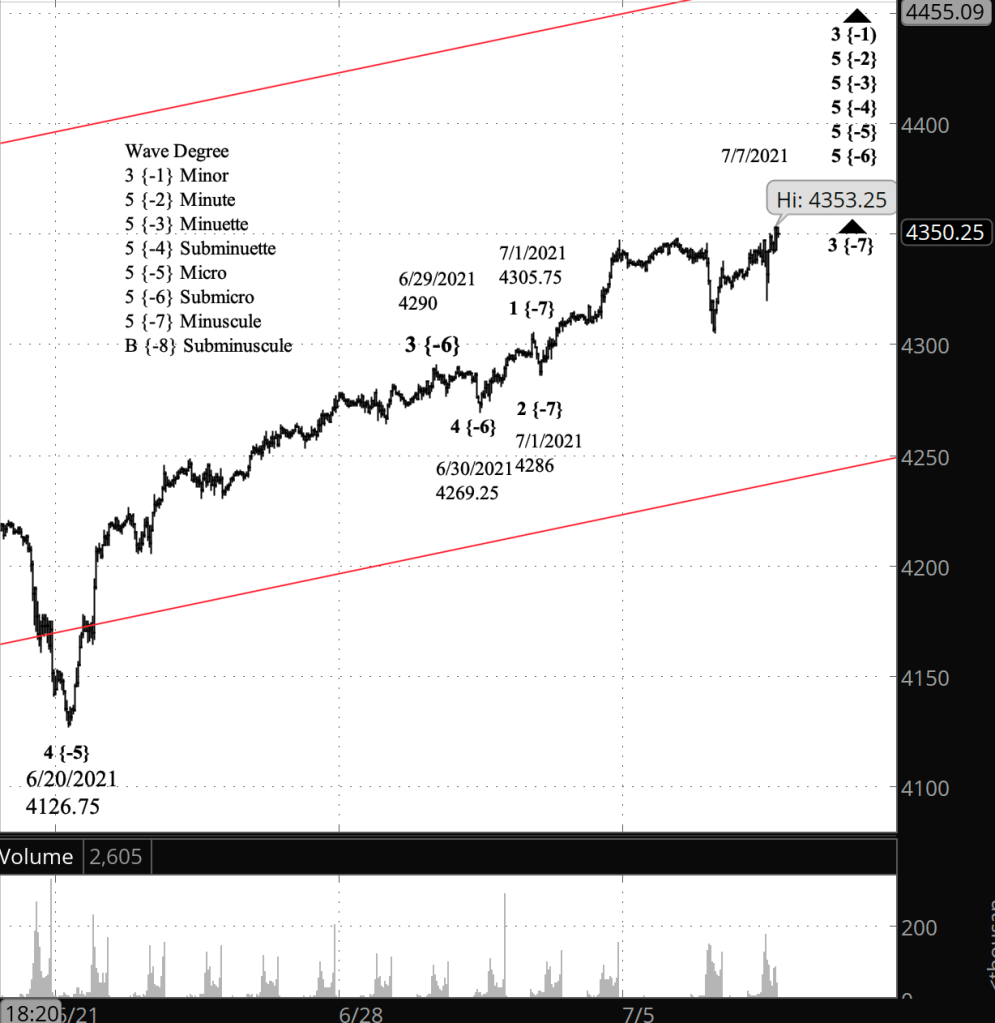
Half an hour before the closing bell. The S&P 500 E-mini futures moved to a new high in trading today, bringing itself back in line with the index. The high on the futures so far is 4323.55, and on the index, 4361.71. Long story short: Wave 3 of Minuscule degree within wave 5 of Submicro degree within 5th waves all the up to Minute degree, with wave 3 of minor degree, is still underway.

[S&P 500 E-mini futures at 3:30 p.m., 40-minute bars, with volume]

9:50 a.m. New York time

What’s happening now? The S&P 500 E-mini futures continued to rise overnight, reaching 4345.50, less than three points below the July 5 high of 4348. The index set a new high at the opening bell, 4356.46, and continued rising.

What does it mean? The new high on the index creates a divergence between the index and the futures. The principle analysis for the index is that the rise that began June 20 is still underway. The futures, in contrast, are in an upward correction within a larger downward correction that began on June 20.

Which analysis is right? Elliott wave doctrine says each analysis is right for its specific product, but I find that to be absurd. In this case, I consider the index to be the correct analysis — the rise from June 20 is still underway. See further discussion in the Elliott wave theory section below.

[S&P 500 E-mini futures at 9:50 a.m. , 40-minute bars, with volume]

What does Elliott wave theory say? The rise from June 20 is wave 5 of Micro degree. The high of July 5 on the futures ended wave 3 of Submicro degree within the rise, and the ensuing decline and rise are waves A and B within wave 4 of Submicro degree. The index doesn’t trade overnight, so all we can say of it is that the index set a high on July 2, another high on July 6 and yet another today. So why is the index correct? The higher high on this chart is unambiguous — the rise that began June 20 is still underway, and will be confirmed as underway with each new high. The futures set a high on July 5, dropped while the index wasn’t trading and remains below that July 5 high. Since the index can’t be rolled back and since the two products must eventually get back in sync, I expect the futures to reach a higher high, perhaps today, resolving the discrepancy.

The chart labeling reflects the index analysis, showing that the rise from June 20 is still underway.

Learning and other resources. See the menu page Analytical Methods for a rundown on where to go for information on Elliott wave analysis.

By Tim Bovee, Portland, Oregon, July 7, 2021

Disclaimer

Tim Bovee, Private Trader tracks the analysis and trades of a private trader for his own accounts. Nothing in this blog constitutes a recommendation to buy or sell stocks, options or any other financial instrument. The only purpose of this blog is to provide education and entertainment.

No trader is ever 100 percent successful in his or her trades. Trading in the stock and option markets is risky and uncertain. Each trader must make trading decisions for his or her own account, and take responsibility for the consequences.

License
Creative Commons License

All content on Tim Bovee, Private Trader by Timothy K. Bovee is licensed under a Creative Commons Attribution-ShareAlike 4.0 International License.

Based on a work at www.timbovee.com.
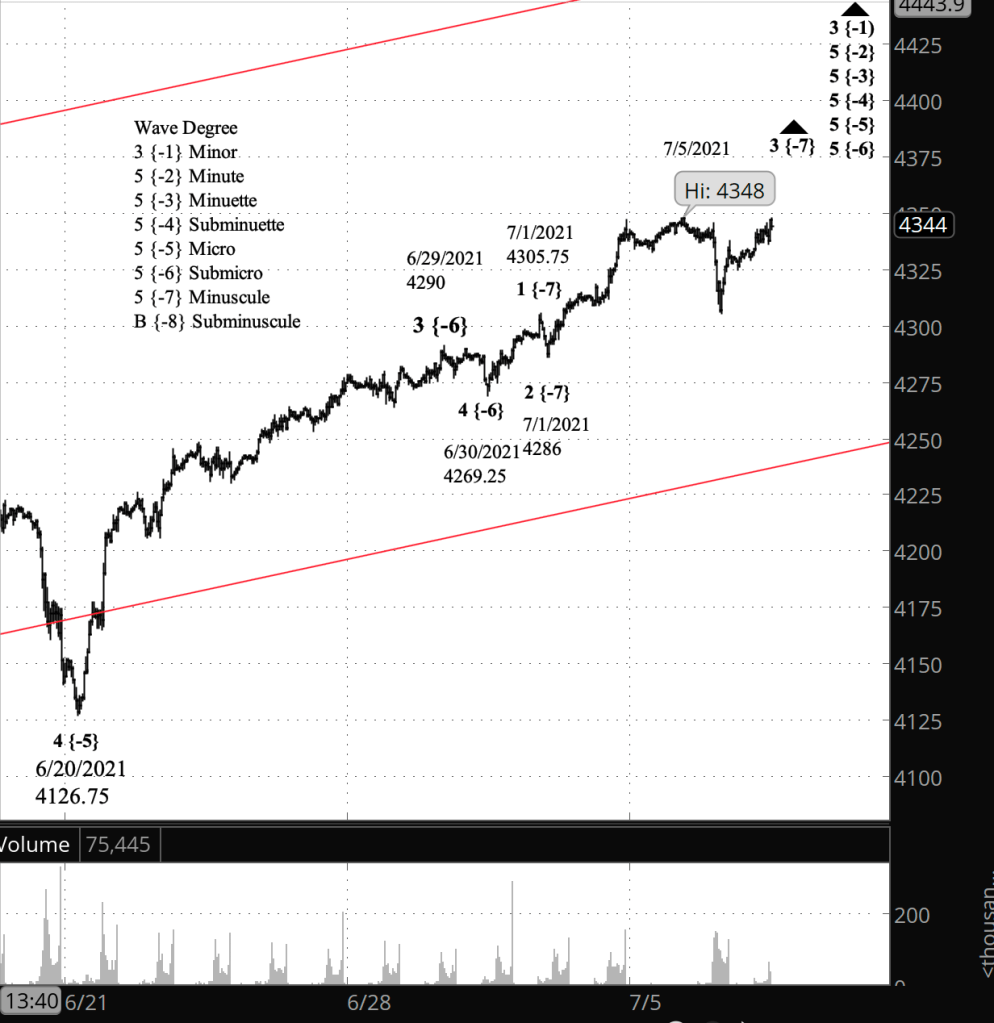
SP500 Analysis

3:30 p.m. New York time

Half an hour before the closing bell. The S&P 500 futures declined sharply from the overnight peak, 4348, and the index decline from its high at the start of the session, 4356.46. The drop is the largest to occur since the uptrend began on June 20.

My new principle analysis places the end of wave 3 of Minuscule degree at the high, and the subsequent decline during the day as wave A of Subminuscule degree within wave 4 of Minuscule degree.

If the rise that followed today’s decline rises above the peak, then this morning’s analysis, stated below, was correct and wave 3 of Minuscule degree is still rising. If today’s rise following the decline reverses into a new decline decline before reaching the peak, then my present principle analysis, stated above, is correct.

[S&P 500 E-mini futures at 3:30 p.m., 40-minute bars, with volume]

9:45 a.m. New York time

What’s happening now? The S&P 500 E-mini futures pushed to a higher high, 4348, in overnight trading and then retreated by a few points. The S&P 500 index at the opening bell gapped to high of 4356.46, slightly above its high of July 2.

What does it mean? The uptrend that began on June 20 continues its final leg. When it is complete, the price will begin a significant move to the downside.

What’s the alternative? The question at this point is whether a new high marks the end of the rise. At this point, I think, the uptrend has a bit longer to run, for reasons I discuss in the Elliott wave theory section below.

[S&P 500 E-mini futures at 9:43 a.m., 40-minute bars, with volume]

What does Elliott wave theory say? As wave of 5 of Submicro degree lengthened, it became clear that the count within that wave needed revision. Submicro 5 began on June 30. I had labelled the high of July 1 as the end of wave 3. I’ve now labelled that high as the end of wave 1, with the low that same day as the end of wave 2, and a lengthening wave 3 still underway, all at Minuscule degree. What comes next within within Submicro 5 will be a sideways correction after Minuscule 3 is complete, and then a final upward push as Minuscule 5 completes its parent wave.

The end of wave 5 of Minuscule degree will also mark the end of 5th waves up to Minute degree, five degrees higher, and also the end of the wave above Minute degree, wave 3 of Minor degree.

Learning and other resources. See the menu page Analytical Methods for a rundown on where to go for information on Elliott wave analysis.

By Tim Bovee, Portland, Oregon, July 6, 2021

Disclaimer

Tim Bovee, Private Trader tracks the analysis and trades of a private trader for his own accounts. Nothing in this blog constitutes a recommendation to buy or sell stocks, options or any other financial instrument. The only purpose of this blog is to provide education and entertainment.

No trader is ever 100 percent successful in his or her trades. Trading in the stock and option markets is risky and uncertain. Each trader must make trading decisions for his or her own account, and take responsibility for the consequences.

License
Creative Commons License

All content on Tim Bovee, Private Trader by Timothy K. Bovee is licensed under a Creative Commons Attribution-ShareAlike 4.0 International License.

Based on a work at www.timbovee.com.
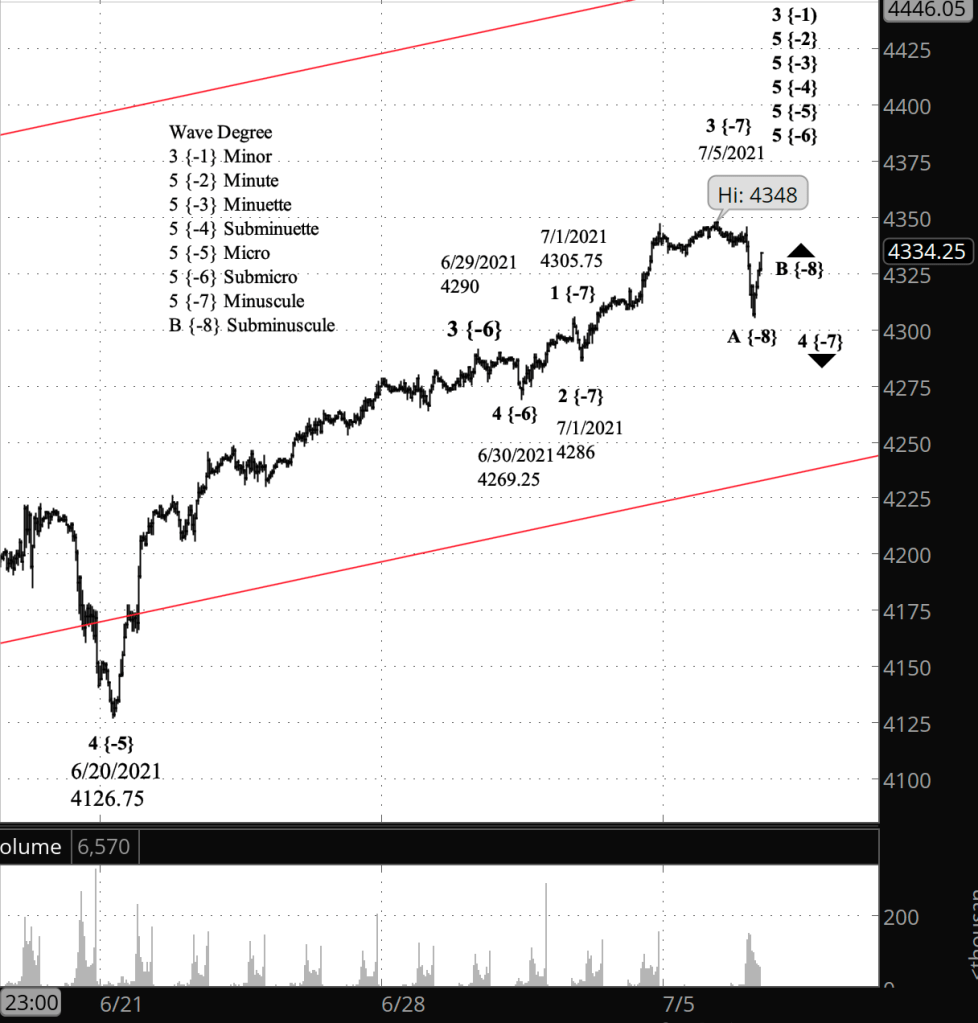
SP500 Analysis

10:10 a.m. New York time

What’s happening now? The U.S. markets are closed in observance of the Independence Day. The S&P 500 E-mini futures are trading in an abbreviated global session, and overnight remained about 4 points below the high of 4347 attained Friday shortly before the closing bell.

What does it mean? The uptrend that began on June 20 remains underway.

What’s the alternative? The difficulty is figuring out when the end has arrived, since late-stage small declines from a high can be interpreted as either the normal jaggedness of a price movement or as the early stages of a decline. I’ve labeled the chart showing that the trend is underway. It just as well could have ended with Friday’s peak.

[S&P 500 E-mini futures at 10:07 a.m., 35-minute bars, with volume]

What does Elliott wave theory say? The rise from June 20 is wave 5 of Micro degree, and it is in its 5th subwave down two levels to Minuscule degree. Completion of Micro 5 will also mark the end of 5th waves up three levels to Minute degree, and also the completion one degree higher of wave 3 of Minor degree.

Learning and other resources. See the menu page Analytical Methods for a rundown on where to go for information on Elliott wave analysis.

By Tim Bovee, Portland, Oregon, July 5, 2021

Disclaimer

Tim Bovee, Private Trader tracks the analysis and trades of a private trader for his own accounts. Nothing in this blog constitutes a recommendation to buy or sell stocks, options or any other financial instrument. The only purpose of this blog is to provide education and entertainment.

No trader is ever 100 percent successful in his or her trades. Trading in the stock and option markets is risky and uncertain. Each trader must make trading decisions for his or her own account, and take responsibility for the consequences.

License
Creative Commons License

All content on Tim Bovee, Private Trader by Timothy K. Bovee is licensed under a Creative Commons Attribution-ShareAlike 4.0 International License.

Based on a work at www.timbovee.com.
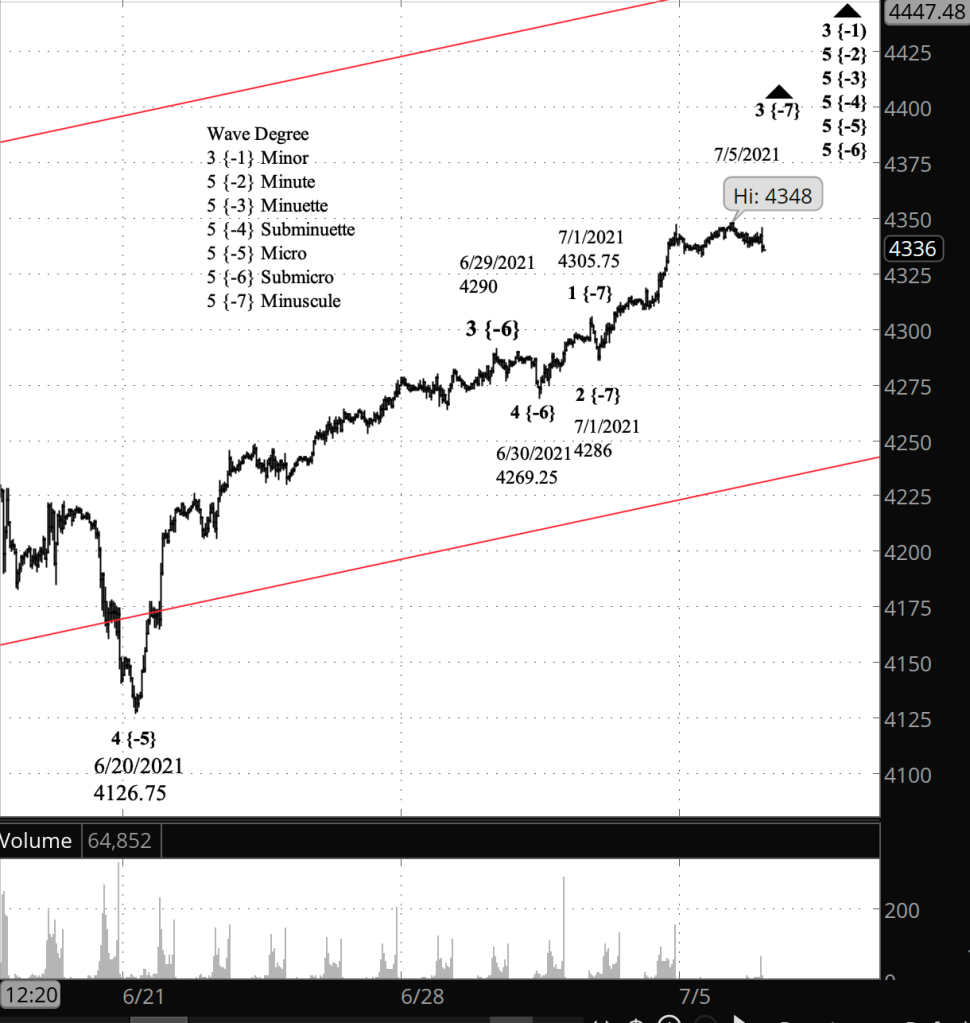
SP500 Analysis

3:30 p.m. New York time

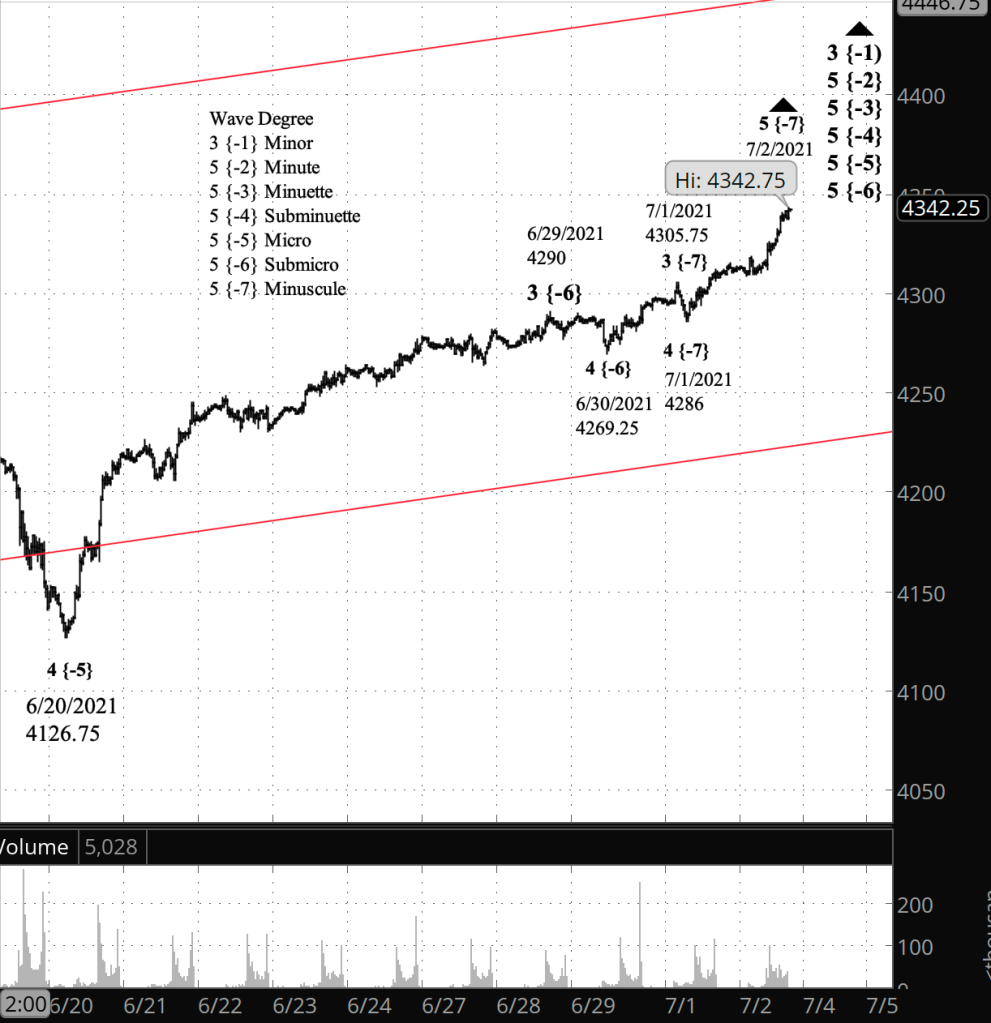
Half an hour before the closing bell. The S&P 500 pushed higher during the day, to 4342.75 so far on the futures (4351 on the index), as wave 5 of Micro degree, which began on June 20, continued its upward course. The principle analysis at the end of the day is that the Minor wave 3 uptrend that began in February 2020 is still underway and is in its last stages. The alternative analysis, as the peak-fishing continues, is that any fresh high can be the end of Minor wave 3 and its smaller child wave, Micro wave 5, since both have met the requirements for completion laid out by Elliott wave theory.

Rather than overwrite this morning’s chart, I’ve added a late-day look at the futures.

[S&P 500 E-mini futures at 3:30 p.m., 30-minute bars, with volume]

12:10 p.m. New York time

Fishing for a high. And the S&P 500 moved higher, meaning that my alternative analysis was correct. The index and it’s derivatives are fishing for higher highs. Wave 3 of Minor degree is still underway, as is its internal wave six levels down, wave 5 of Minuscule degree.

9:25 a.m. New York time

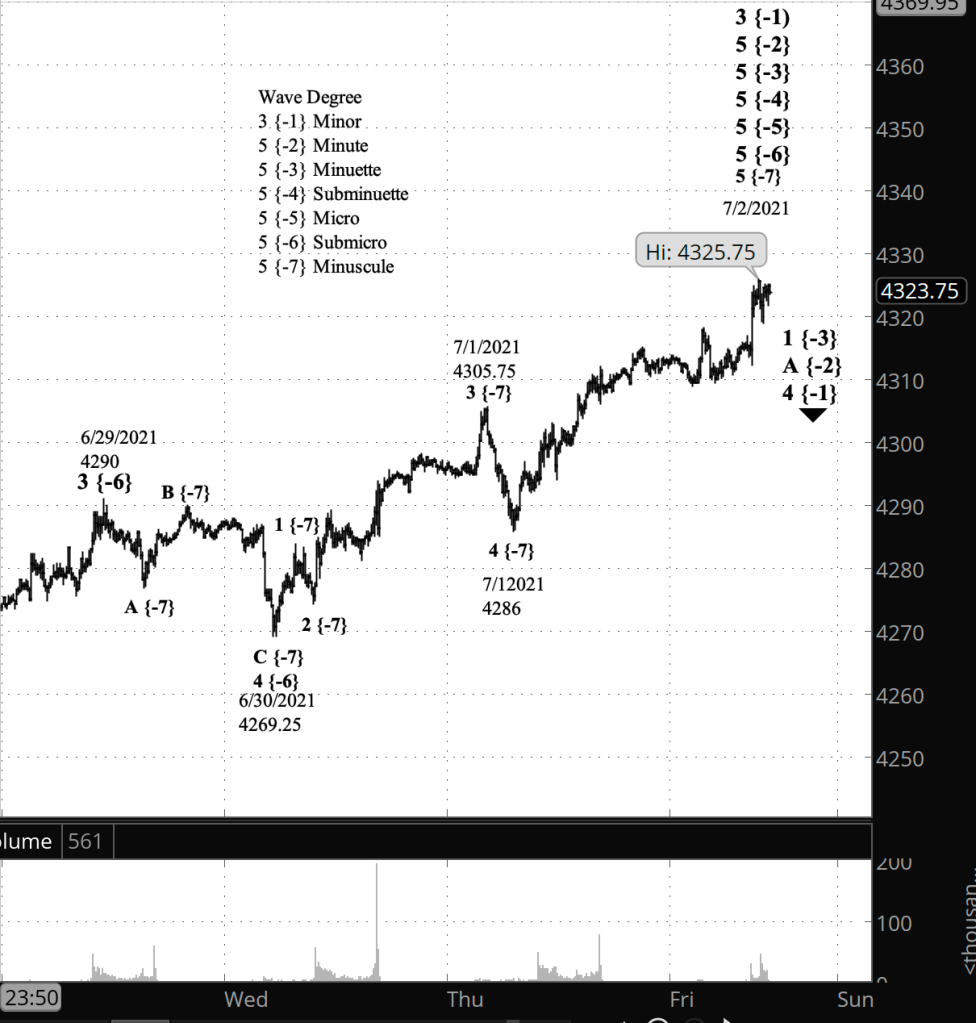
What’s happening now? The S&P 500 reached a higher high of 4325.75 on the E-mini futures shortly before the opening bell, and then reversed to the downside. Trading on the index opened a few minutes later and it quickly moved to a high of 4334.16.

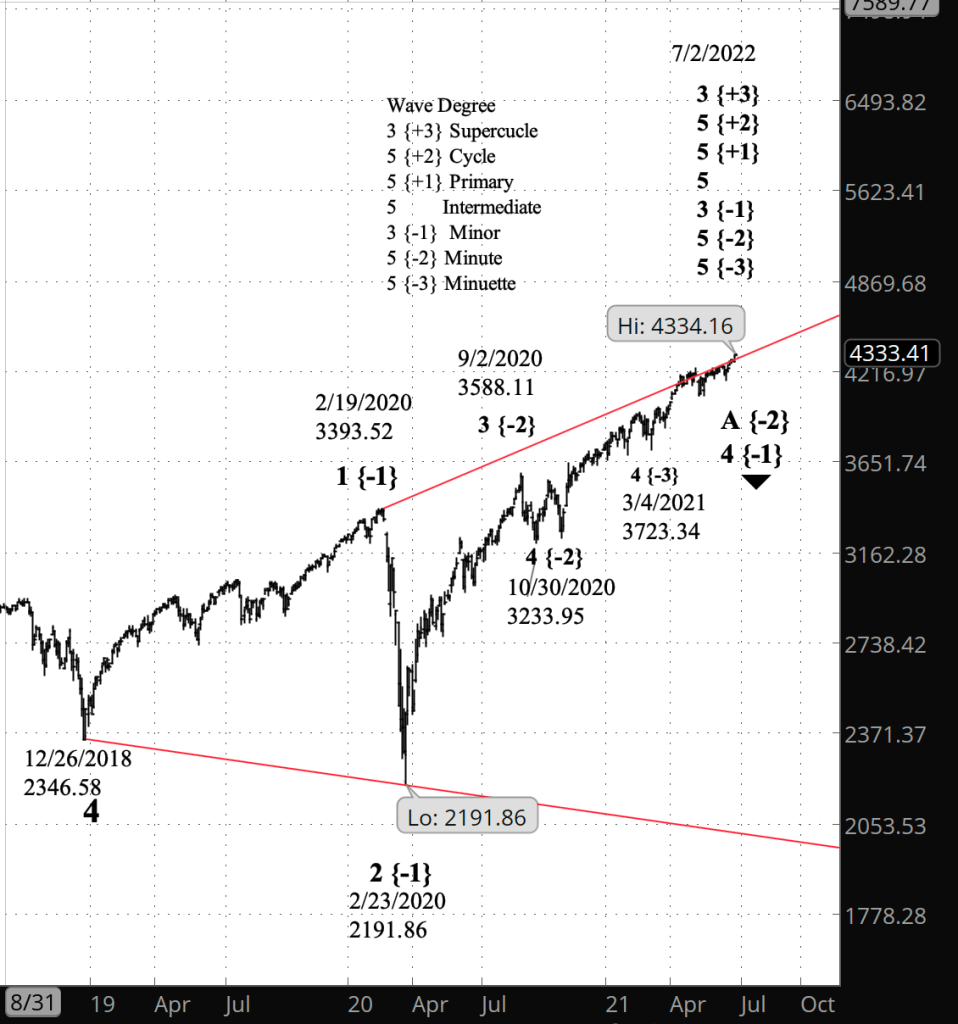
What does it mean? In analyzing the charts below, I’ve treated the morning peak as the end of the rise that began on February 23, 2020. The decline from the peak, although of a very small scale, was dramatic, with none of the wishy washy dawdling that we see when traders are uncertain whether to bid higher. If this principle analysis is indeed correct, then the 16-month rise that began in February of last year, is complete, and a major movement to the downside has begun. It will eventually carry the price down to below 2000, the lower boundary of an expanding triangle that began in December 2018.

What’s the alternative? If the price moves above 4325.75, then we’re back to a game of where’s the top, which we’ve been playing for the past few days. In this alternative analysis, the rise is still underway, and the principle analysis will be shelved as we await the start of the next downward movement in triangle.

[Close-up: S&P 500 E-mini futures at 9:34 a.m., 10-minute bars, with volume]
[Big view: S&P 500 index at 9:25 a.m., 2-day bars]

What does Elliott wave theory say? The large downward movement that began modestly after this morning’s high is wave 4 of Minor degree with an expanding diagonal triangle that is wave 5 of Intermediate degree, having begun on December 26, 2018. Diagonal triangles have five waves altogether, bouncing between two boundaries that over time grow further apart from one another. How low can it go? That’s a function of time; the longer it takes the price to reach the lower boundary, presently around 2020, the lower that boundary will have dropped.

Whether this principle analysis is indeed valid at this time depends upon the price remaining below this morning’s high, 4325.75 on the futures and 4334.16 on the index. If the price moves above those levels, then the alternative analysis kicks in: Minor wave 3 is still in progress, as it has been since it began on February 23, 2020, and the subsequent progress of the chart described in the present principle analysis will be deferred until Minor 3 ends.

Learning and other resources. See the menu page Analytical Methods for a rundown on where to go for information on Elliott wave analysis.

By Tim Bovee, Portland, Oregon, July 2, 2021

Disclaimer

Tim Bovee, Private Trader tracks the analysis and trades of a private trader for his own accounts. Nothing in this blog constitutes a recommendation to buy or sell stocks, options or any other financial instrument. The only purpose of this blog is to provide education and entertainment.

No trader is ever 100 percent successful in his or her trades. Trading in the stock and option markets is risky and uncertain. Each trader must make trading decisions for his or her own account, and take responsibility for the consequences.

License
Creative Commons License

All content on Tim Bovee, Private Trader by Timothy K. Bovee is licensed under a Creative Commons Attribution-ShareAlike 4.0 International License.

Based on a work at www.timbovee.com.
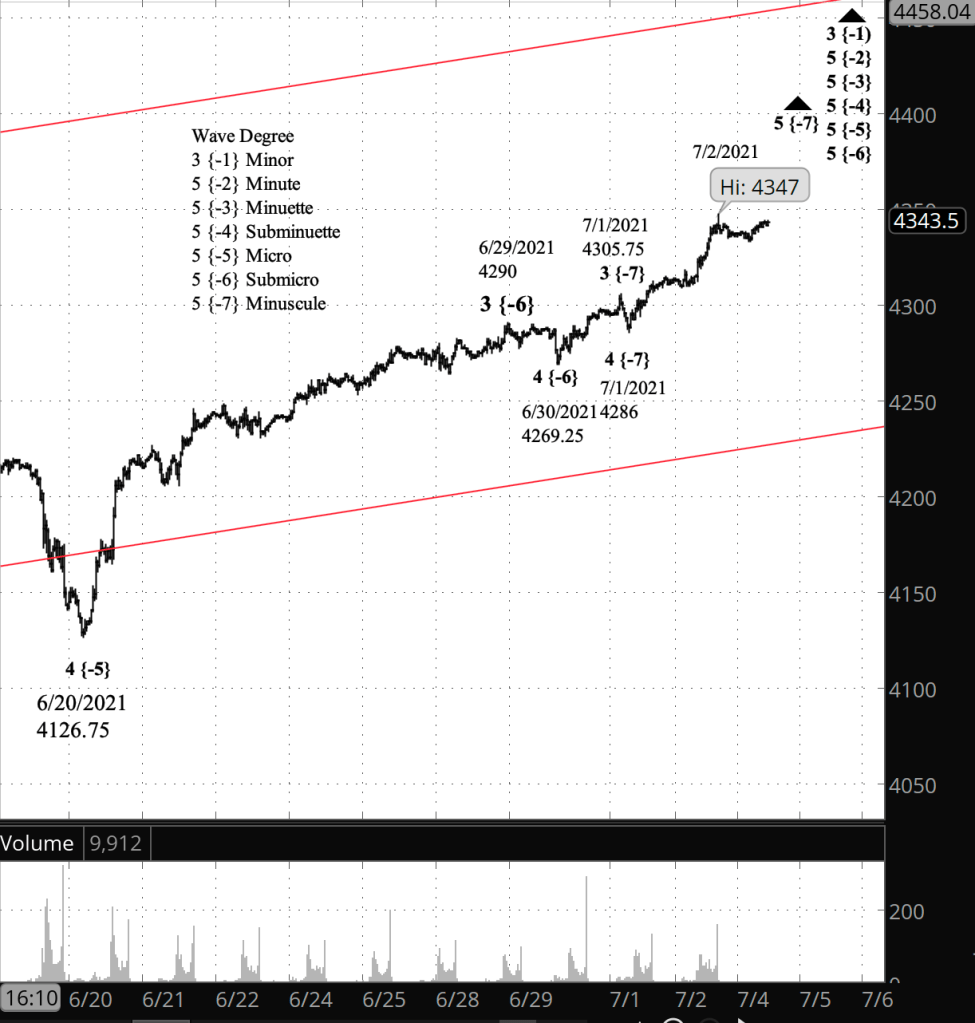
SP500 Analysis

3:30 p.m. New York time

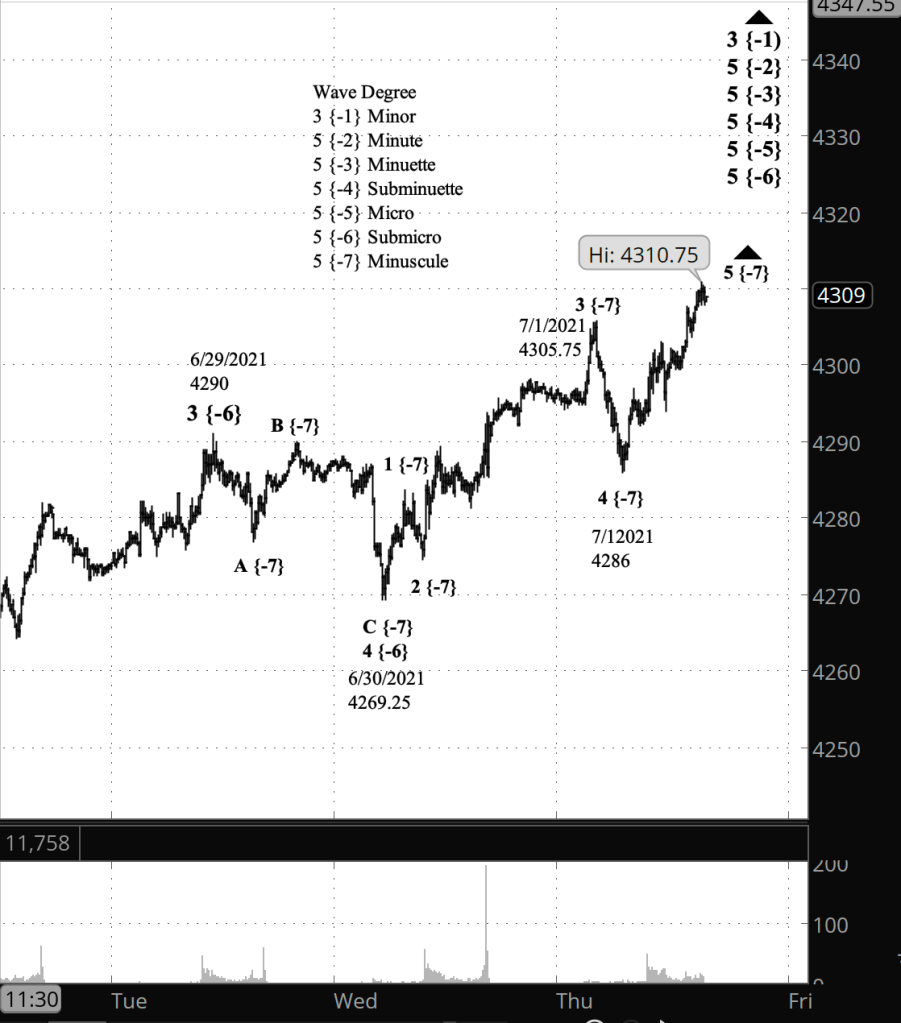
Half an hour before the closing bell. The S&P 500 continued to rise during the day, exceeding the high set before the opening bell, to a peak of 4310.75 on the futures (4319.96 on the index. Because of the rise to new high, I’ve changed my analysis to show the July 1 low of 4286 on the futures (4300.73 on the index) as the end of wave 4 of Minuscule degree, and the subsequent rise to a new high as wave 5 of Minuscule degree, which is still underway. Minuscule 5 is the final wave of Submicro degree, and its completion will also be the completion of five 5th waves of increasingly higher degree, to Minute wave 5, and up one, the completion of wave 3 of Minor degree.

9:50 a.m. New York time

What’s happening now? The S&P 500 E-mini futures rose to a new high, 4305.75, in overnight trading

What does it mean? The uptrend that began June 20 is still underway but nearing an end.

What’s the alternative? If the present rise fails to top 4305.75, then the uptrend ended at that point.

[S&P 500 E-mini futures at 3:30 p.m., 10-minute bars, with volume]

What does Elliott wave theory say? In the chart today I drill down to a close-up to see in detail what’s happening within wave 5 of Micro degree, which began on June 20.

One degree down, wave 3 of Submicro degree ended on June 29 at 4290. It was followed by a 4th wave downward correction containing three waves of Minuscule degree and ending on June 30 at 4269.25.

The final wave of the uptrend follows, wave 5 of Submicro degree. By my count, the overnight high of 4305.75 ends wave 3 of Minuscule degree within wave 5 of Submicro degree. The fall from that endpoint is a 4th wave correction of Minuscule degree, and it has been followed by a three-wave rise which is an ongoing wave B of Subminuscule degree.

The B wave will be followed by Subminuscule C, which may complete the correction, although often 4th waves will extend in compounds patterns.

At any rate, Minuscule wave 4 will be followed by Minuscule wave 5 to the upside, which will rise above 4305.75 and when complete, will mark the end of wave 5 of Micro degree and of 5th waves all the way up to Minute degree, and also that Minute degree’s parent, wave 3 of Minor degree, which began on February 23, 2020 from 2191.86 on the S&P 500 index.

Learning and other resources. See the menu page Analytical Methods for a rundown on where to go for information on Elliott wave analysis.

By Tim Bovee, Portland, Oregon, July 1, 2021

Disclaimer

Tim Bovee, Private Trader tracks the analysis and trades of a private trader for his own accounts. Nothing in this blog constitutes a recommendation to buy or sell stocks, options or any other financial instrument. The only purpose of this blog is to provide education and entertainment.

No trader is ever 100 percent successful in his or her trades. Trading in the stock and option markets is risky and uncertain. Each trader must make trading decisions for his or her own account, and take responsibility for the consequences.

License
Creative Commons License

All content on Tim Bovee, Private Trader by Timothy K. Bovee is licensed under a Creative Commons Attribution-ShareAlike 4.0 International License.

Based on a work at www.timbovee.com.
SP500 Analysis

3:30 p.m. New York time

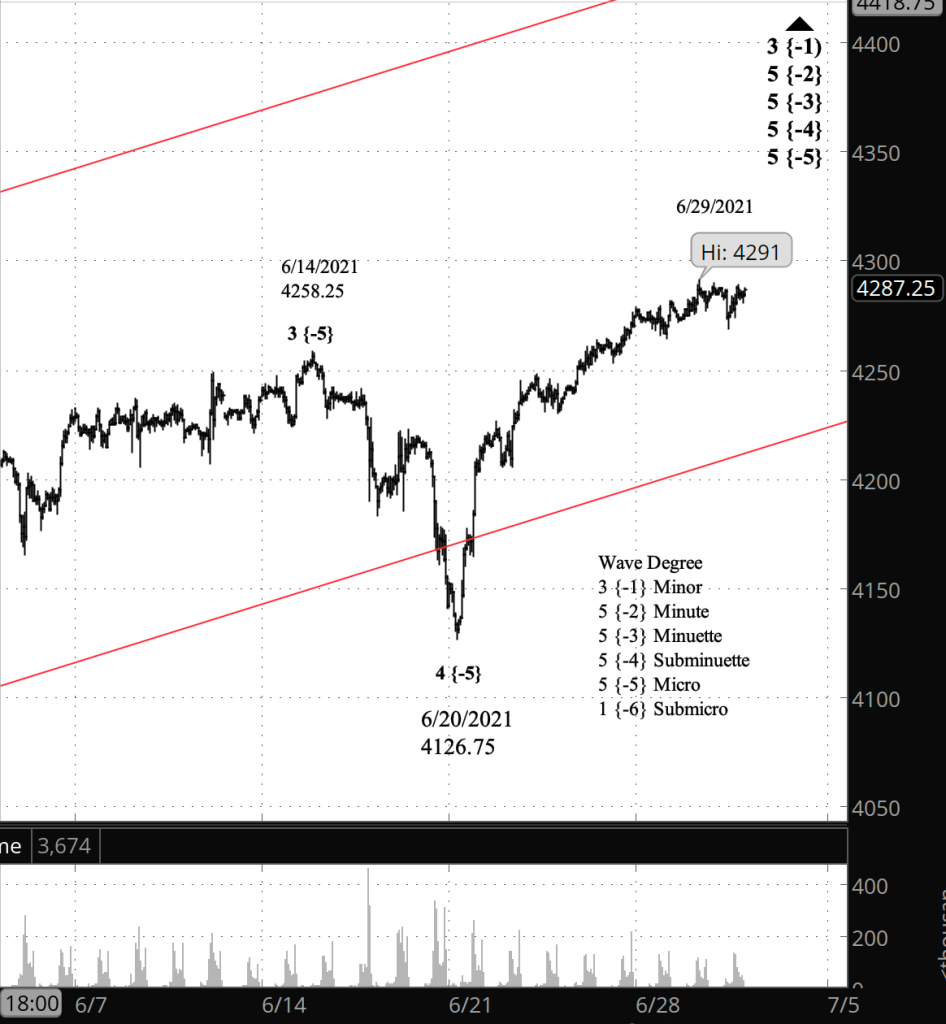
Half an hour before the closing bell. The S&P 500 futures dropped nearly 22 points below the high of the day before and then rose, coming to within less than 2 points of that peak. A move above the June 29 high of 4291 on the futures would mean that wave 5 of Micro degree is still underway and rising. As long as the price remains below that level, it is possible, although not certain, that the Micro 5th wave is complete and that the trend is down. I’ve updated the chart below.

9:40 a.m. New York time

What’s happening now? The S&P 500 E-mini futures dawdled overnight below yesterday’s peak, 4291, in overnight trading.

What does it mean? The rise from June 20 has met the requirements for a complete uptrend, and so 4291 could mark the end of that rise, to be followed by a significant movement to the downside.

What’s the alternative? Nothing on the chart precludes the rise from June 20 from extending higher.

[S&P 500 E-mini futures at 3:30 p.m., hourly bars, with volume]

What does Elliott wave theory say? The rise from June 20 is wave 5 of Micro degree. Internally, I can count the high of June 29 as being the end of the wave, but I see room for one more push to the upside, with the June 29 peak being the end of wave 3 of Submicro degree. There’s a bit of ambiguity on the chart.

The completion of Micro 5 will also mark the completion of three parent 5th waves, up to Minute degree, and above that the completion of wave 3 of Minor degree, setting up a signifiant correction to the downside. Minor wave 3 began more than a year ago, in February 2020, and so I would expect the Minor 4th wave correction to last a comparable length of time — maybe shorter, maybe longer, but still a movement best viewed on a one- or two-year chart.

Learning and other resources. See the menu page Analytical Methods for a rundown on where to go for information on Elliott wave analysis.

By Tim Bovee, Portland, Oregon, June 30, 2021

Disclaimer

Tim Bovee, Private Trader tracks the analysis and trades of a private trader for his own accounts. Nothing in this blog constitutes a recommendation to buy or sell stocks, options or any other financial instrument. The only purpose of this blog is to provide education and entertainment.

No trader is ever 100 percent successful in his or her trades. Trading in the stock and option markets is risky and uncertain. Each trader must make trading decisions for his or her own account, and take responsibility for the consequences.

License
Creative Commons License

All content on Tim Bovee, Private Trader by Timothy K. Bovee is licensed under a Creative Commons Attribution-ShareAlike 4.0 International License.

Based on a work at www.timbovee.com.
SP500 Analysis

3:30 p.m. New York time

Half an hour before the closing bell. The S&P 500 continued nudging higher, reaching 4291 on the futures and 4300.52 on the index. No change in the analysis. Chart updated.

9:40 a.m. New York time

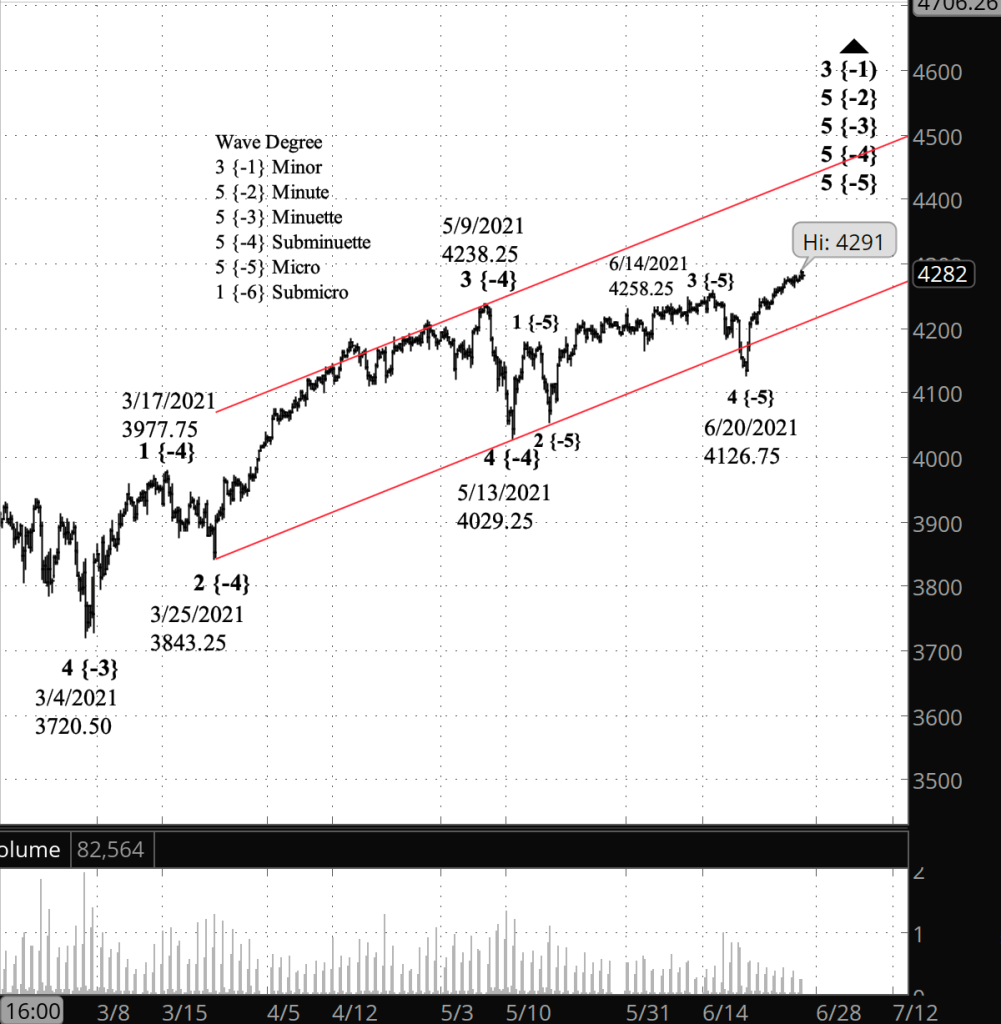
What’s happening now? Another day, another high on the S&P 500, which inched upward shortly after the opening bell to 4289 on the E-mini futures, 4299.80 on the index

What does it mean? The uptrend that began June 20 continues. It’s completion will mark the end not only of the near-term rise but of the uptrend that began after the crash early in the pandemic, in February 2020.

What’s the alternative? The price channel, racking the rise that began on March 4, provides target for the present uptrend, but there’s no guarantee that the price will reach that point, or even come close. And it good move well beyond that point. Price channels provide some analytical structure to a chart, but I treat them with a great deal of skepticism.

[S&P 500 E-mini futures at 3:30 p.m., 5-hour bars, with volume]

What does Elliott wave theory say? The rise from June 20 is wave 5 of Micro degree. The price channel tracks one degree higher, wave 5 of Subminuette degree. The rise that began in February 2020 is wave 3 of Minor degree, which is three degrees higher than Subminuette. Minor 3 is part of an expanding triangle that began in December 2018. The subsequent 4th wave in theory should approach the lower boundary of the triangle, presently in the low 2000s. And the Minor 5th wave after that will bring the price back up to highs at the upper boundary. Given that Minor wave 3 has lasted a year and four months so far, we’re talking about events that will take some time to unfold.

Learning and other resources. See the menu page Analytical Methods for a rundown on where to go for information on Elliott wave analysis.

By Tim Bovee, Portland, Oregon, June 29, 2021

Disclaimer

Tim Bovee, Private Trader tracks the analysis and trades of a private trader for his own accounts. Nothing in this blog constitutes a recommendation to buy or sell stocks, options or any other financial instrument. The only purpose of this blog is to provide education and entertainment.

No trader is ever 100 percent successful in his or her trades. Trading in the stock and option markets is risky and uncertain. Each trader must make trading decisions for his or her own account, and take responsibility for the consequences.

License
Creative Commons License

All content on Tim Bovee, Private Trader by Timothy K. Bovee is licensed under a Creative Commons Attribution-ShareAlike 4.0 International License.

Based on a work at www.timbovee.com.
SP500 Analysis

2:30 p.m. New York time

Ninety minutes before the closing bell. The S&P 500 has spent the day so far trading slightly below the early morning high, 4279.50 on the futures and 4288.41 on the index. No change in the analysis. I’ve update the chart.

9:40 a.m. New York time

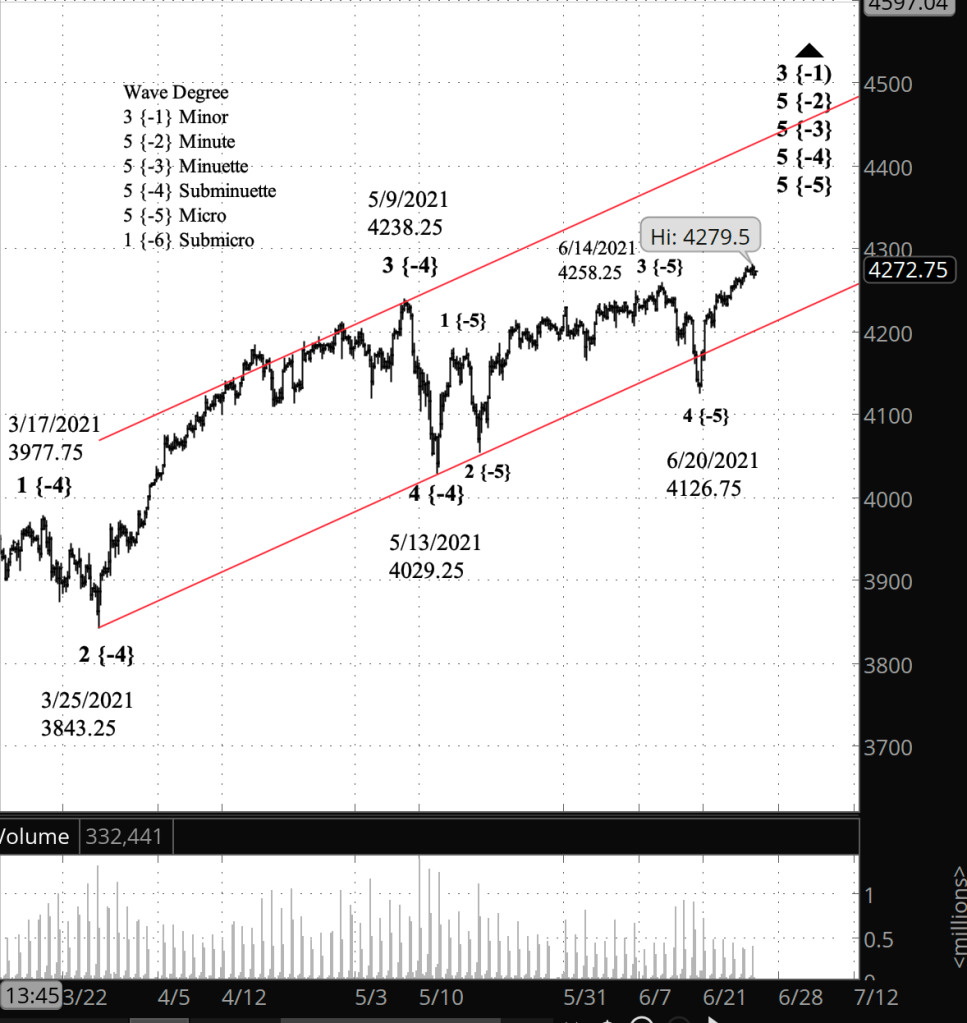
What’s happening now? The S&P 500 E-mini futures rose overnight and shortly after the opening bell reached a new high, 4279.50.

What does it mean? The upward movement that began June 20 continues, within the large-scale rise that began February 23, 2020. The near-term target is 4500 or so.

What’s the alternative? Although I expect the rise from June 20 to end around the upper boundary of the price channel shown on the chart, there’s no guarantee that it won’t fall short of that target, and it could well move significantly beyond it. I treat price channels as guidance but not as certainties.

[S&P 500 E-mini futures at 2:30 p.m., 255-minute bars, with volume]

What does Elliott wave theory say? The rise from June 20 is wave 5 of Micro degree within wave 5 of Subminuette degree, which began on May 13. Micro 5 appears to be in its 5th and final wave internally, which means it could reverse at any point into a wave 1 downtrend within a larger downward correction.

At larger degrees, the market is in an uptrend, wave 3 of Minor degree, that began with the February 23, 2020 completion of a corrective wave early in the pandemic, wave 2 of Minor degree. This is all happening within wave 5 of Intermediate degree, which began on December 26, 2018 and is taking the form of an expanding triangle.

For the price channel, I’ve chosen to track wave 5 of Minuette degree, which began May 4 from 3723.34. The upper boundary that provides a price target for Subminuette wave 5 presently is in the 4420s and will reach 4500 by mid-July.

Learning and other resources. See the menu page Analytical Methods for a rundown on where to go for information on Elliott wave analysis.

By Tim Bovee, Portland, Oregon, June 28, 2021

Disclaimer

Tim Bovee, Private Trader tracks the analysis and trades of a private trader for his own accounts. Nothing in this blog constitutes a recommendation to buy or sell stocks, options or any other financial instrument. The only purpose of this blog is to provide education and entertainment.

No trader is ever 100 percent successful in his or her trades. Trading in the stock and option markets is risky and uncertain. Each trader must make trading decisions for his or her own account, and take responsibility for the consequences.

License
Creative Commons License

All content on Tim Bovee, Private Trader by Timothy K. Bovee is licensed under a Creative Commons Attribution-ShareAlike 4.0 International License.

Based on a work at www.timbovee.com.