SPCE Trade: 21 Days

Virgin Galactic Holdings Inc. (SPCE)

1:30 p.m. New York time

Today is 21 days before expiration of my short bear call spread options position on SPCE, which I entered on June 1 for a $70 premium per contract. The position expires on July 16.

Under my rules for such trades, the 21-day mark is when I manage the position, closing the winners no matter how small the profit. I hold on to the unprofitable positions, usually, playing the odds that the position will return to profitability.

And the chance of a return is significant. The smaller the loss the greater the odds of a profit. Research done by the TastyTrade — the best source I’ve found of information about options — found a 7-0% chance of a return to profitability if the loss at 21 days is one or two times the premium, when the initial short leg of the spread had a 16% delta, which is is the standard delta for placing the short leg under my rules. (The full video discussion of the research can be found here.)

So what about my SPCE position?

The analysis of the position posted at the time put the odds of the price remaining below the upper boundary of full profitability — $36 — at 78%. But I fudged my rules in positioning the short call in the position. Rather than putting it at the 16 delta mark, I put it at delta 39%.

My reasoning went like this. Context: It’s a low volatility market, and SPCE is the only liquid symbol that met my Implied Volatility Rank (IVR) requirements. Even with all of that, the premium at 16 delta was low. My Elliott wave analysis (see the chart on the entry analysis post) suggested little chance that the price would be above the $36 mark, and so I accepted the increased risk

And the analysis proved to be accurate, with the price making a few small forays above $36, until June 22, when the price began to rise, exceeding $40 the next day. And then today, on June 25, the price shot up, reaching a high so far of $56.40.
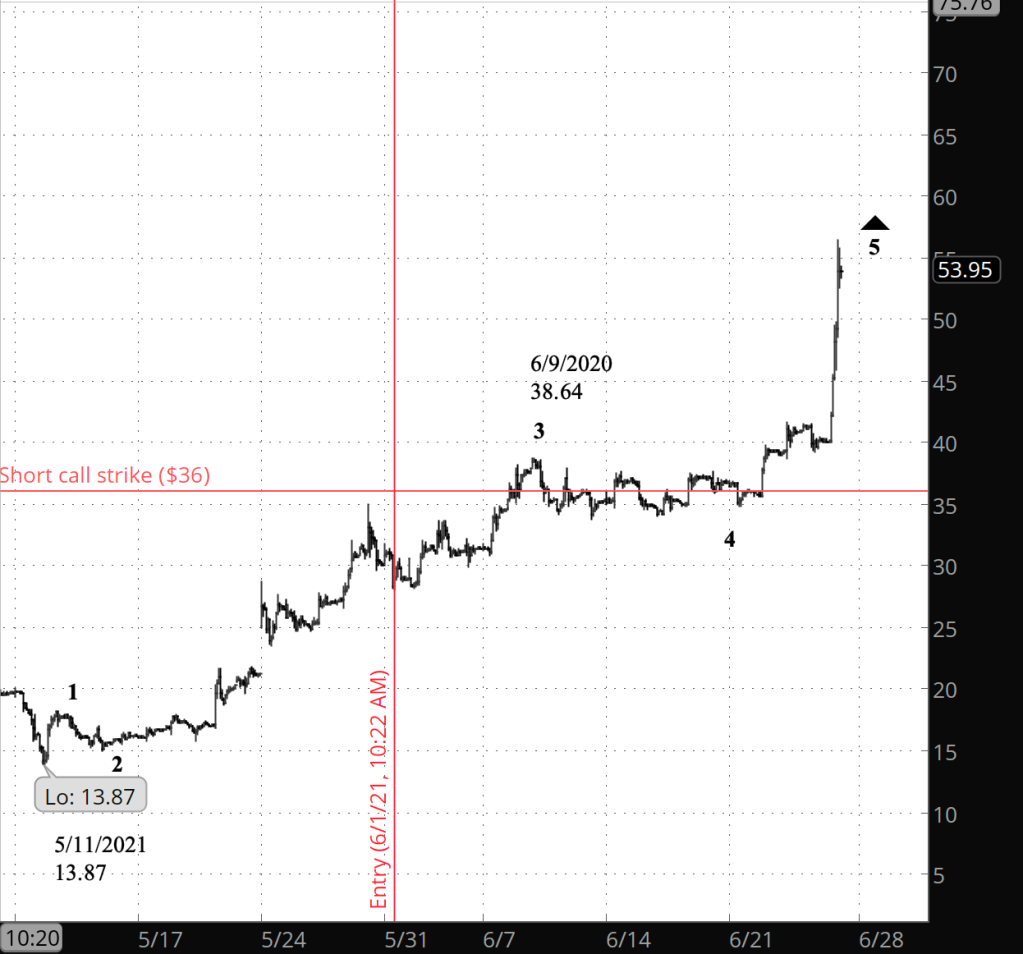
[SPCE at 1:06 p.m., 70-minute bars]

I’ve often said in my daily analyses of the S&P 500 that Elliott wave analysis provides context, not prophecy. It will tell us the implications of what we see on the chart right now, but if the chart changes, then so does our analysis of the implications. So it is with this chart.

The rise that began June 25 is a 5th wave, and probably a 3rd wave within it, which means that there’s significant upside left. At present, the share price is at 53.48 and the cost of exiting is $3.78 per contract share. The present loss is approximately five times the premium, which places the odds of a reversal to profitability as very unlikely indeed.

And so the question becomes, what’s the best exit strategy? First off, rolling the short call up isn’t really an option. The long call in the position has a strike price of $41, which is still in massive loss territory.

But of course, that $41 long strike is my insurance policy for the position, limiting my loss. If I hold the position through expiration, I’ll pay no more than $41 each for the shares dumped into my account.

And of course, we’ve had a very large rise today, and every rise I’ve seen is followed by a partial retracement. So I have 21 days to wait for that to happen, limiting my loss.

So here’s my decision: I’ll continue to hold the position, keeping a close watch on it, as always, and preparing to exit when the price is right. The “right” price will be a profit, of course, if it happens. And if it doesn’t, then the “right” price will be one that lessens the pain the of the loss.

Learning and other resources. See the menu page Analytical Methods for a rundown on where to go for information on Elliott wave analysis.

By Tim Bovee, Portland, Oregon, June 25, 2021

Disclaimer

Tim Bovee, Private Trader tracks the analysis and trades of a private trader for his own accounts. Nothing in this blog constitutes a recommendation to buy or sell stocks, options or any other financial instrument. The only purpose of this blog is to provide education and entertainment.

No trader is ever 100 percent successful in his or her trades. Trading in the stock and option markets is risky and uncertain. Each trader must make trading decisions for his or her own account, and take responsibility for the consequences.

License
Creative Commons License

All content on Tim Bovee, Private Trader by Timothy K. Bovee is licensed under a Creative Commons Attribution-ShareAlike 4.0 International License.

Based on a work at www.timbovee.com.
SP500 Analysis

3:30 p.m. New York time

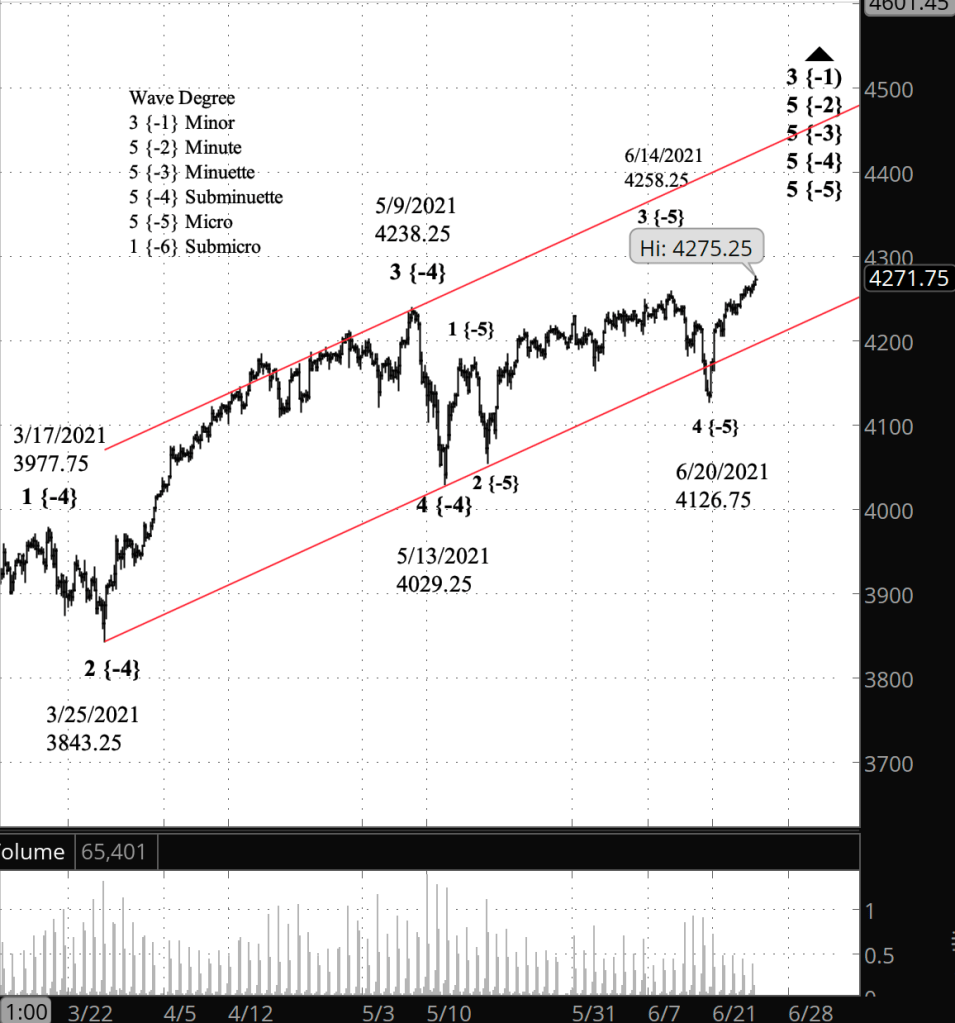
Half an hour before the closing bell. The S&P 500 continue to move higher, reaching 4275.25 on the futures, 4284.94 on the index. No change in the analysis, and I’ve updated the chart.

9:35 a.m. New York time

What’s happening now? The S&P 500 E-mini futures rose slightly in overnight trading and at the opening bell had reached a high of 4266.25.

What does it mean? The rise that began on March 20 continues, part of a larger uptrend that has been underway for 16 months. The present uptrend is the final leg in a much larger uptrend, and its completion will be followed by a significant decline.

What’s the alternative? As the price continually reaches new highs, it’s important to remember that each latest high point is potentially the end of the rise and the beginning of a new downtrend. Or not. The rules of my analysis set no upper boundary.

[S&P 500 E-mini futures at 3:30 p.m., 255-minute bars, with volume]

What does Elliott wave theory say? The rise from June 20 is wave 5 of Micro degree, the final upward push in the rise that began May 13, labelled wave 5 of Subminuette degree. And indeed, the end of the present five-day-old rise will cascade three degrees up the fractal structure to mark the end of wave 5 of Minute degree and, one degree higher, wave 3 of Minor degree, which began on February 23, 2020 from 2191.86.

There is no certain way to set a target for wave 5 of Micro degree, nor can we do more than guess how long it may take for wave 5 to reach its end. The upper boundary of the parent degree’s price channel — wave 5 of Subminuette degree — suggests a possible target in the 4400s if the price reaches the upper boundary around July 5. The longer it takes to reach the boundary, the higher the possible target.

The one certainty is that the present wave internally will contain five waves — up, down, up, down, up — in a rising sequence. Presently, Micro 5’s child wave is wave 1 of Submicro degree. So based on form, Micro 5 has a ways to go.

Learning and other resources. See the menu page Analytical Methods for a rundown on where to go for information on Elliott wave analysis25

By Tim Bovee, Portland, Oregon, June 25, 2021

Disclaimer

Tim Bovee, Private Trader tracks the analysis and trades of a private trader for his own accounts. Nothing in this blog constitutes a recommendation to buy or sell stocks, options or any other financial instrument. The only purpose of this blog is to provide education and entertainment.

No trader is ever 100 percent successful in his or her trades. Trading in the stock and option markets is risky and uncertain. Each trader must make trading decisions for his or her own account, and take responsibility for the consequences.

License
Creative Commons License

All content on Tim Bovee, Private Trader by Timothy K. Bovee is licensed under a Creative Commons Attribution-ShareAlike 4.0 International License.

Based on a work at www.timbovee.com.
SP500 Analysis

3:30 p.m. New York time

Half an hour before the closing bell. The S&P 500 rose slightly from this morning’s high, to 4260.75 on the futures.

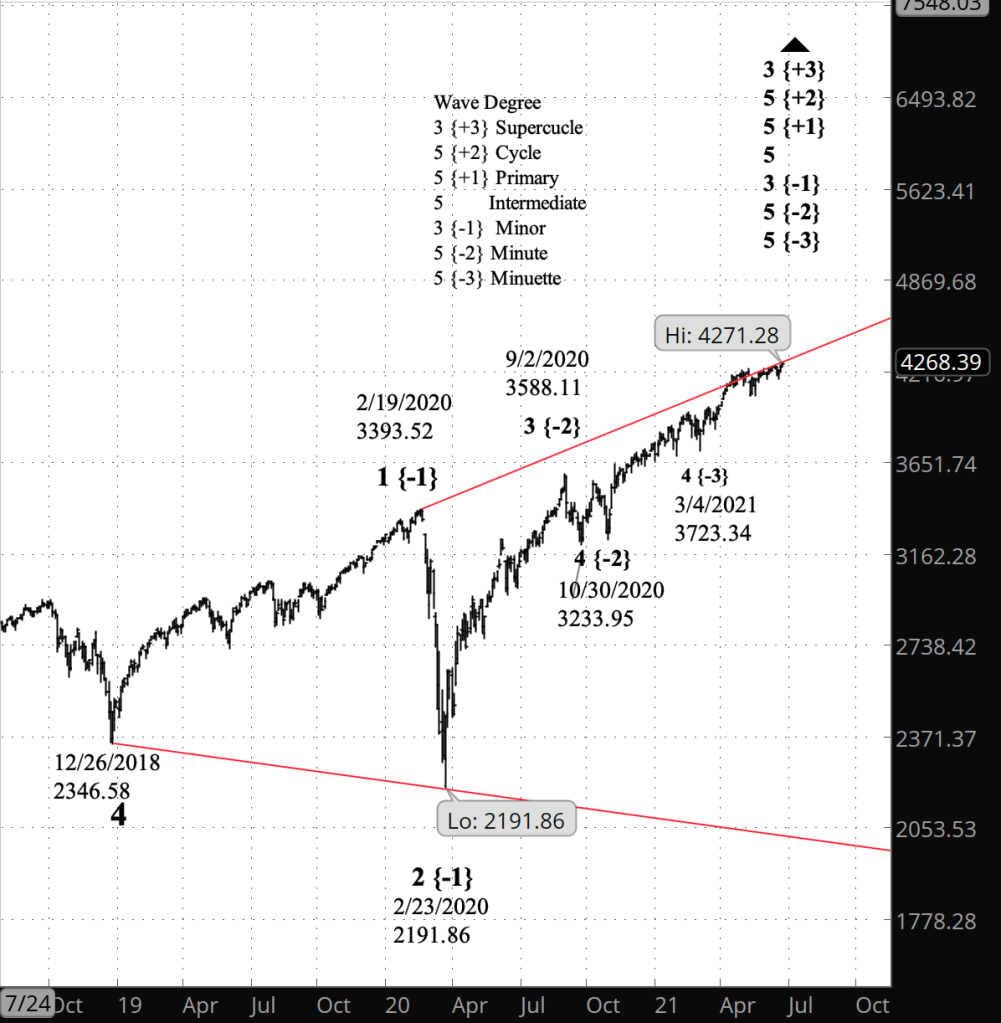
For perspective, here is a longer-term chart, tracing the entirety of the expanding diagonal triangle that marks the form taken by the S&P 500 during wave 5 of Intermediate degree since it began on December 26, 2018 from 2346.58.

The present rise, wave 3 of Minor degree, began on February 23, 2020 from 2191.86, the end of the 2nd wave crash early in the pandemic. Within Minor 3, wave 5 of Minuette degree — two degrees below Minor — began its rise on March 4, 2021 from 3723.40.

With an expanding triangle, we can expect a significant decline after the present wave 3 of Minor degree completes its rise. The decline ideally will reach the lower boundary of the triangle, which is presently around 2040 and declining further each day.

[Longer view: S&P 500 index at 3:19 p.m., 2-day bars]

10:30 a.m. New York time

Note: This replaces the analysis posted at 9:45 a.m., which was outdated by events shortly after the opening bell.

What’s happening now? The S&P 500 index moved above its high of June 14, to a new all-time high of 4270.53, extending the rise that began in February 2020, after the crash early in the pandemic. The E-mini futures exceeded its high of Juen 14, reaching a higher high of 4260.25 so far.

What does it mean? The index high means that the prior principle analysis gets tossed out the window and is replaced by the former alternative analysis.

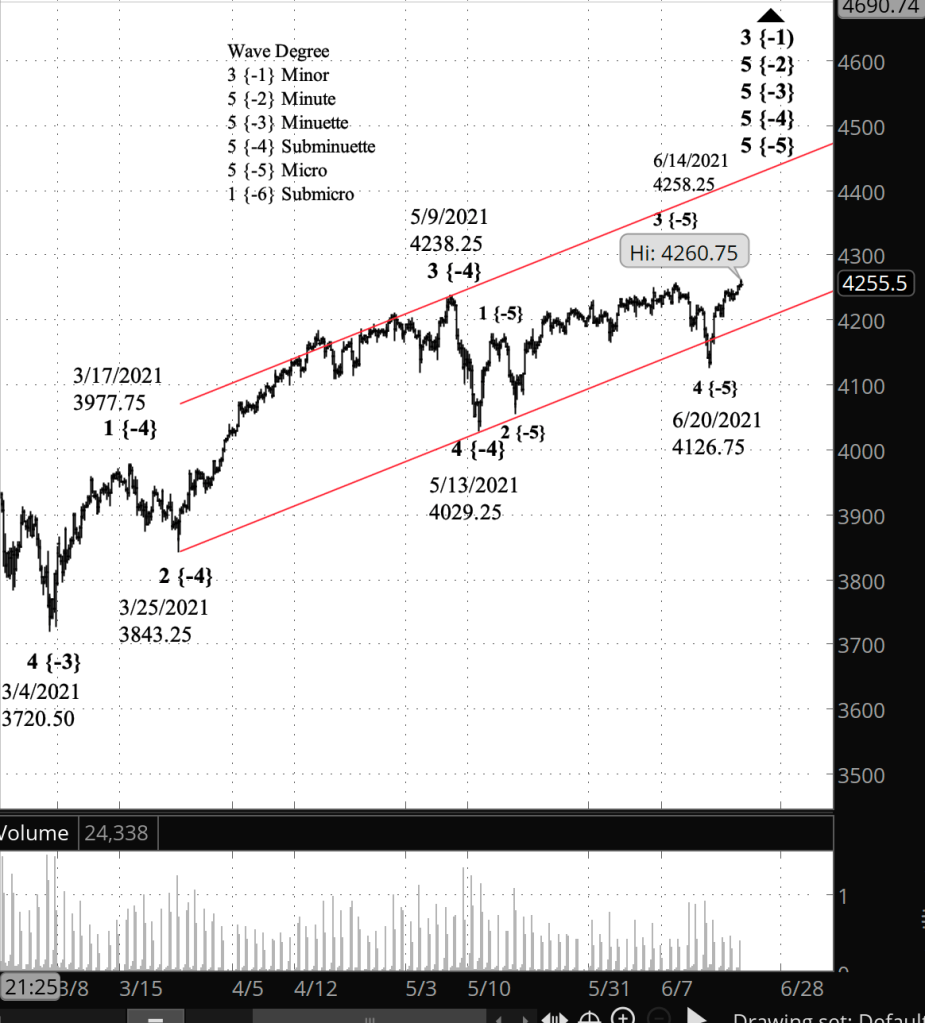
The new principle analysis: The rise of May 13 to June 14 was the middle movement within a larger uptrend that began on May 13. It was followed by a correction, and the final movement within the larger uptrend has begun. I expect it to continue to rise into the 4400s, perhaps, and it could go higher. See the “Elliott wave theory” section below for a discussion.

[Shorter view: S&P 500 E-mini futures at 3:30 p.m., 245-minute bars, with volume]

What does Elliott wave theory say? Wave 5 of Subminuette degree began on May 13 from 4029.25, and the present rise, from June 20, is the wave 5 of Micro degree, a child wave of the Subminuette. The decline from June 14 to June 20 was wave 4 of Micro degree. This is all happening within the parent, wave 5 of Minuette degree, which began on March 4 from 3720.50

So how much upside is there in the present Micro 5 rise? Elliott wave theory has few rules the how far a 5th wave can go. Some are short. Some extend far beyond all reasonable expectations. A price channel for the parent wave 5 of Minuette degree can provide some guidance. I’ve drawn it to connect the beginnings of waves 3 and 5 of Subminuette degree, with a parallel wave touching the end of wave 1 of Subminuette degree. If the rise reached the upper boundary on July 5, for example, the price would be in the 4460s. The sooner the price reaches the boundary, the lower the target. The longer it takes to get there, the higher the target.

Learning and other resources. See the menu page Analytical Methods for a rundown on where to go for information on Elliott wave analysis.

By Tim Bovee, Portland, Oregon, June 24, 2021

Disclaimer

Tim Bovee, Private Trader tracks the analysis and trades of a private trader for his own accounts. Nothing in this blog constitutes a recommendation to buy or sell stocks, options or any other financial instrument. The only purpose of this blog is to provide education and entertainment.

No trader is ever 100 percent successful in his or her trades. Trading in the stock and option markets is risky and uncertain. Each trader must make trading decisions for his or her own account, and take responsibility for the consequences.

License
Creative Commons License

All content on Tim Bovee, Private Trader by Timothy K. Bovee is licensed under a Creative Commons Attribution-ShareAlike 4.0 International License.

Based on a work at www.timbovee.com.
SP500 Analysis

Note: Just as I posted the price of the index moved above the June 14 high. I reworked analysis entirely and posted a new analysis. This analysis is no longer valid, having been overtaken by events. I’m leaving it up for comparison with the new analysis.

9:45 a.m. New York time

What’s happening now? The S&P 500 E-mini futures, in the rise that began on June 20, reached a new high shortly after the opening bell.. That level is at the all-time high of 4258.25, set on June 14. The S&P 500 index exceeded the June 14 high, creating a discrepancy between the two products.

What does it mean, #1? As long as the price remains at or below the June 14 high, my principle analysis is that the S&P 500 futures in an upward correction within a larger downtrend. The longer term expectation is for prices to fall significantly. Talk about hanging by a thread! This analysis is one penny away from being replaced by the alternative.

What does it mean, #2? If the price moves above the June 14 high, then the decline that began on June 14 was a correction within an ongoing uptrend, and the rise that began on June 20 is a resumption of the uptrend after the correction. The longer term expectation is for prices to rise, with no way to tell how high they hight go.

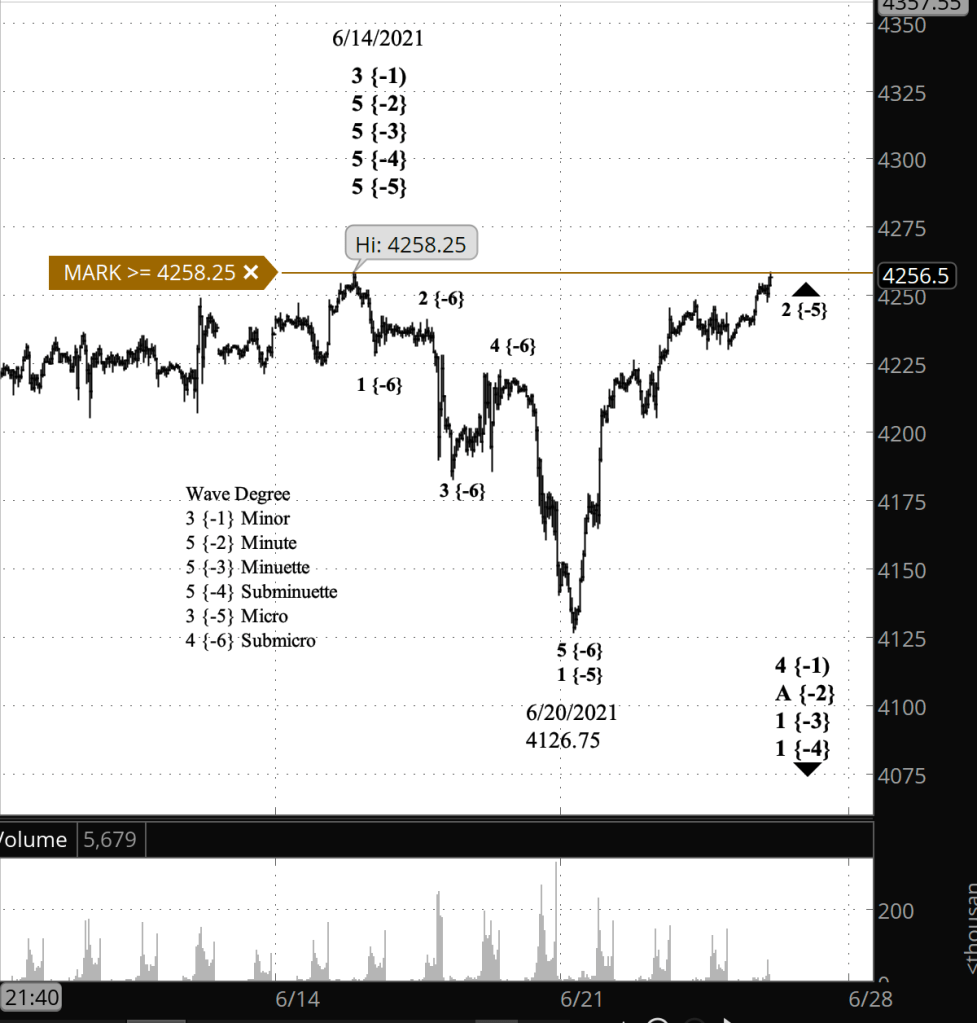
[S&P 500 E-mini futures at 9:46 a.m., 40-minute bars, with volume]

What does Elliott wave theory say? Principle analysis: Wave 2 of Micro degree is underway. I had counted it internally as wave A of Submicro degree within wave 2, but with no room between the wave 2 high and the June 14 peak, I don’t see how the A label can be correct. There’s just not enough space for a future C wave. Under this analysis, the June 14 peak ended a long-running uptrend all the way up to Minute degree.

If the price moves above the June 14 peak, then the rise from June 20 cannot be wave 2, because under the rules of Elliott wave theory, a 2nd wave cannot move beyond the start of the preceding wave 1. A move beyond that peak would mean that the June 14 peak was the start of a small correction within wave 5 of Minute degree and its child waves.

Learning and other resources. See the menu page Analytical Methods for a rundown on where to go for information on Elliott wave analysis.

By Tim Bovee, Portland, Oregon, June 24, 2021

Disclaimer

Tim Bovee, Private Trader tracks the analysis and trades of a private trader for his own accounts. Nothing in this blog constitutes a recommendation to buy or sell stocks, options or any other financial instrument. The only purpose of this blog is to provide education and entertainment.

No trader is ever 100 percent successful in his or her trades. Trading in the stock and option markets is risky and uncertain. Each trader must make trading decisions for his or her own account, and take responsibility for the consequences.

License
Creative Commons License

All content on Tim Bovee, Private Trader by Timothy K. Bovee is licensed under a Creative Commons Attribution-ShareAlike 4.0 International License.

Based on a work at www.timbovee.com.
SP500 Analysis

3:30 p.m. New York time

Half an hour before the closing bell. The S&P 500 stayed below its early high today of 4248.25 on the futures, 4256.60 on the index, which kept the price below the June 14 high of 4258.25 on the futures, 4257.16 on the index. The analysis is unchanged. I’ve updated the chart.

9:40 a.m. New York time

What’s happening now? The S&P 500 E-mini futures in overnight trading rose to 4248.25 and then reversed slightly.

What does it mean? The overnight high is 10 points below the June 14 peak of 4258.25. By my principle analysis, the rise from June 20 is the middle portion of an upward correction that will be followed by a resumption of the larger downtrend, as long as the price remains at or below the June 14 peak.

What’s the alternative? If the price exceeds the June 14 peak, then the uptrend that began in February 2020, after the early pandemic crash, is still underway, and the decline from that date to June 20 was a correction within that uptrend.

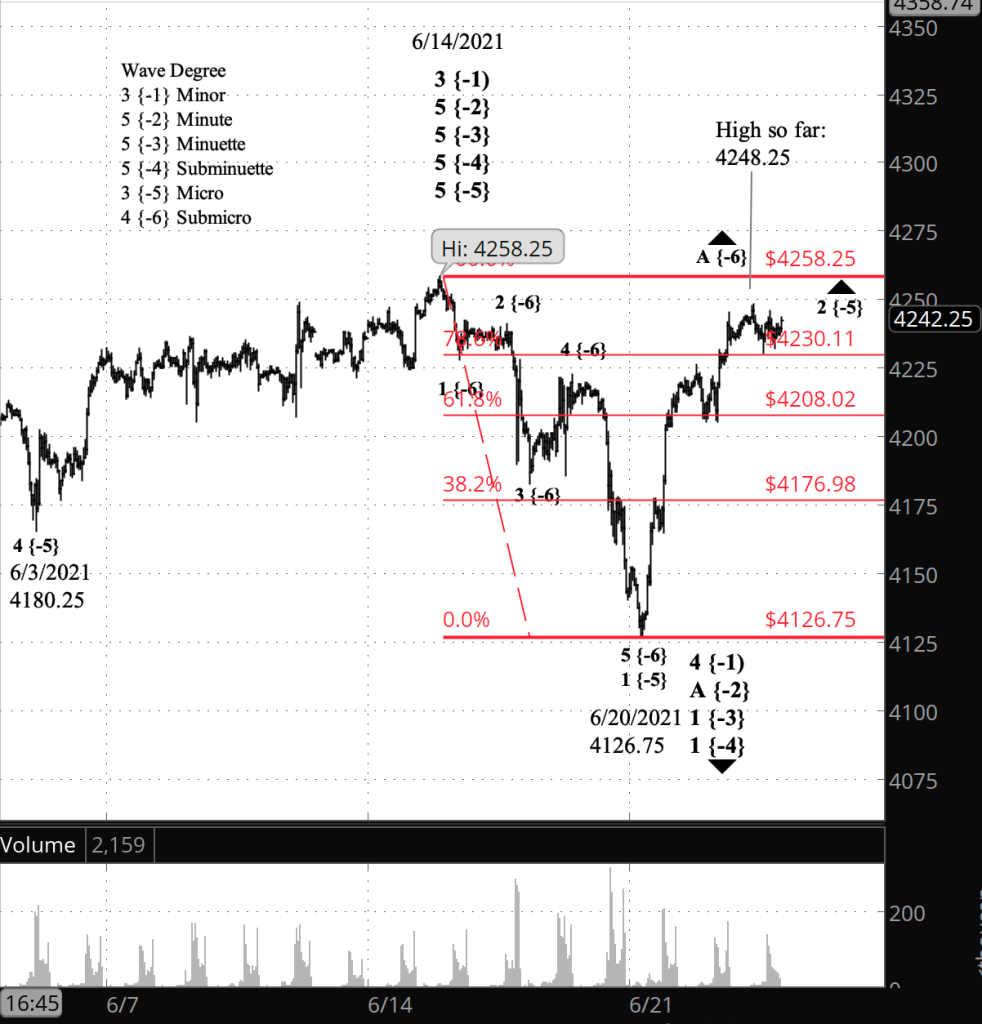
[S&P 500 E-mini futures at 3:30 p.m., 45-minute bars, with volume]

What does Elliott wave theory say? Following the overnight high, which is wave A of Submicro degree within wave 2 of Micro degree under the principle analysis, the price reversed, dropping back to the 78.6% Fibonacci retracement level. Under the Elliott rules, a 2nd wave can’t move beyond the start of the preceding 1st wave, and a move above the June 14 high would violate that rule, requiring a re-analysis.

That being the case, wave A has only 10 more points of upward potential and will be followed by a B wave to the downside and then a final C wave to the upside, which will be the completion of the parent wave 2 and the beginning of an energetic wave 3 to the downside, which will reach below the June 20 minimum of 4126.75, and perhaps significantly below.

If the price exceeds 4258.25, the June 14 peak, then the alternative count kicks in. Under the alternative, the decline from June 14 to June 20 is a corrective wave with three subwaves, and the rise since June 20 is a subwave of wave 5 of Micro degree, which began on June 3 from 4180.25. This scenario has an unknown amount of upward potential. It could be quite a bit, or maybe not so much.

Learning and other resources. See the menu page Analytical Methods for a rundown on where to go for information on Elliott wave analysis.

By Tim Bovee, Portland, Oregon, June 23, 2021

Disclaimer

Tim Bovee, Private Trader tracks the analysis and trades of a private trader for his own accounts. Nothing in this blog constitutes a recommendation to buy or sell stocks, options or any other financial instrument. The only purpose of this blog is to provide education and entertainment.

No trader is ever 100 percent successful in his or her trades. Trading in the stock and option markets is risky and uncertain. Each trader must make trading decisions for his or her own account, and take responsibility for the consequences.

License
Creative Commons License

All content on Tim Bovee, Private Trader by Timothy K. Bovee is licensed under a Creative Commons Attribution-ShareAlike 4.0 International License.

Based on a work at www.timbovee.com.
Bitcoin Analysis

1:20 p.m. New York time

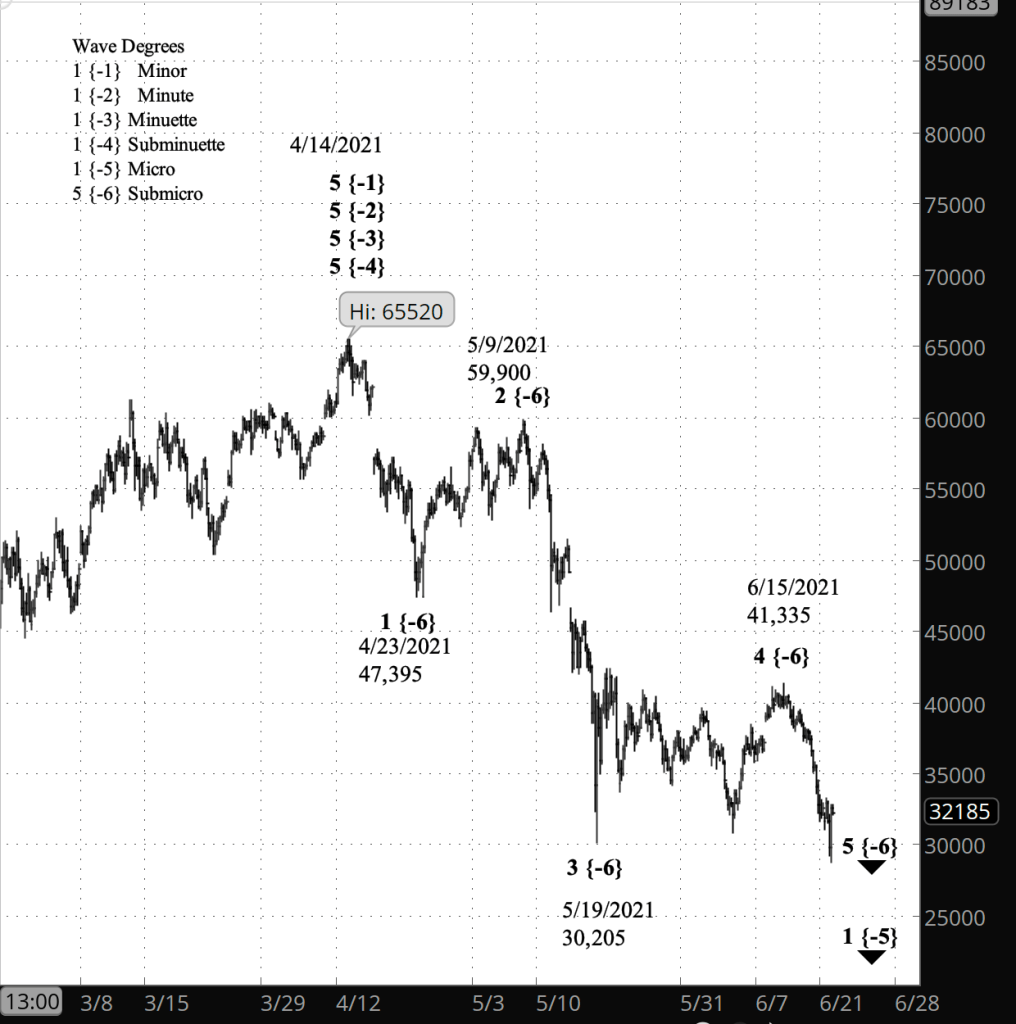
What’s happening now? Bitcoin futures fell to new lows following a near-term peak of 41,335 on June 15.

What does it mean? The decline is a final wave in a downtrend that began on April 14, when Bitcoin set a high of 65,520. It will be followed by an upward correction that will take back much of the decline since mid-April but will fall short of that all-time.

What’s the alternative? If the price moves above 65,520, then the decline that began April 14 was a correction within an ongoing uptrend.

[Bitcoin futures at 1:16 p.m., 4-hour bars]

What does Elliott wave theory say? By my principle count, the downtrend that began April 14 is wave 5 of Submicro degree with wave 1 of Micro degree, the beginning of a downtrend involving many larger degrees. Submicro 5 is the last waver in Micro 1, which will be followed by an upward correction, wave 2 of Micro degree, which will likely take the form of a Zigzag and will recover a large portion of the decline from April 14. Micro 2 will in turn be followed by an energetic 3rd wave decline.

By the alternative count, the decline from April 14 is a downward correction, perhaps wave 4 of Subminuette degree, within a rising wave 5 of Minuette degree.

Learning and other resources. See the menu page Analytical Methods for a rundown on where to go for information on Elliott wave analysis.

By Tim Bovee, Portland, Oregon, June 22, 2021

Disclaimer

Tim Bovee, Private Trader tracks the analysis and trades of a private trader for his own accounts. Nothing in this blog constitutes a recommendation to buy or sell stocks, options or any other financial instrument. The only purpose of this blog is to provide education and entertainment.

No trader is ever 100 percent successful in his or her trades. Trading in the stock and option markets is risky and uncertain. Each trader must make trading decisions for his or her own account, and take responsibility for the consequences.

License
Creative Commons License

All content on Tim Bovee, Private Trader by Timothy K. Bovee is licensed under a Creative Commons Attribution-ShareAlike 4.0 International License.

Based on a work at www.timbovee.com.
SP500 Analysis

3:30 p.m. New York time

Half an hour before the closing bell. The S&P 500 continued its rise, reaching 4241.75, a level less than points below the June 14 peak of 4258.25. As noted in this morning’s alternative analysis, if that level is breached, then the decline since June 14 has been a correction within an ongoing rise, which dates back to February of last year. Chart updated.

9:35 a.m. New York time

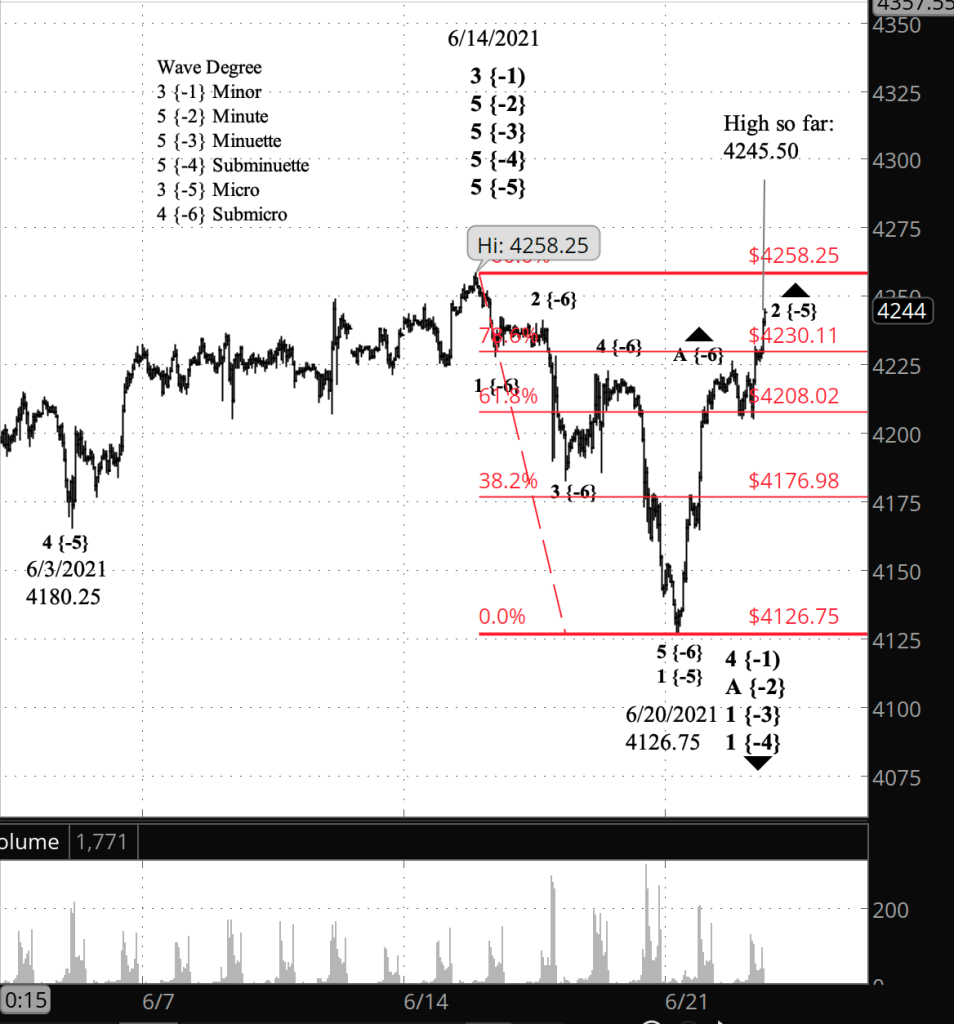
What’s happening now? The S&P 500 E-mini futures continued their rise overnight and in the past few days has taken back around three-fourths of the decline from June 14 to June 20.

What does it mean? The movement is an upward correction of the mid-June decline. By my principle count, the rise is the first leg of the correction, and will be followed by a downward move within the correction, and then a final push to the upside.

What’s the alternative? If the price rises above the June 14 peak, 4258.25, then the mid-June decline was a downward correction of an ongoing uptrend, the the subsequent rise — still underway — was either a resumption of the larger uptrend or a countertrend movement within the downward correction.

[S&P 500 E-mini futures at 3:30 p.m., 45-minute bars, with volume]

What does Elliott wave theory say? The rise overnight, wave A of Submicro degree, approached the 78.6% Fibonacci retracement level but has stayed below it. Under my principle analysis Submicro wave B will carry the price down while remaining above 4126.75, the starting point of wave A. The B wave will be followed by a C wave to the upside, which most likely will end above the end of wave A. The A wave is still underway, so there’s no way to put a number to its end point.

Under the alternative analysis, the low of June 20 ended a downward correction, and the subsequent rise is the first wave of a resumption of wave 5 of Micro degree, the larger uptrend.

Learning and other resources. See the menu page Analytical Methods for a rundown on where to go for information on Elliott wave analysis.

By Tim Bovee, Portland, Oregon, June 22, 2021

Disclaimer

Tim Bovee, Private Trader tracks the analysis and trades of a private trader for his own accounts. Nothing in this blog constitutes a recommendation to buy or sell stocks, options or any other financial instrument. The only purpose of this blog is to provide education and entertainment.

No trader is ever 100 percent successful in his or her trades. Trading in the stock and option markets is risky and uncertain. Each trader must make trading decisions for his or her own account, and take responsibility for the consequences.

License
Creative Commons License

All content on Tim Bovee, Private Trader by Timothy K. Bovee is licensed under a Creative Commons Attribution-ShareAlike 4.0 International License.

Based on a work at www.timbovee.com.
SP500 Analysis

3:30 p.m. New York time

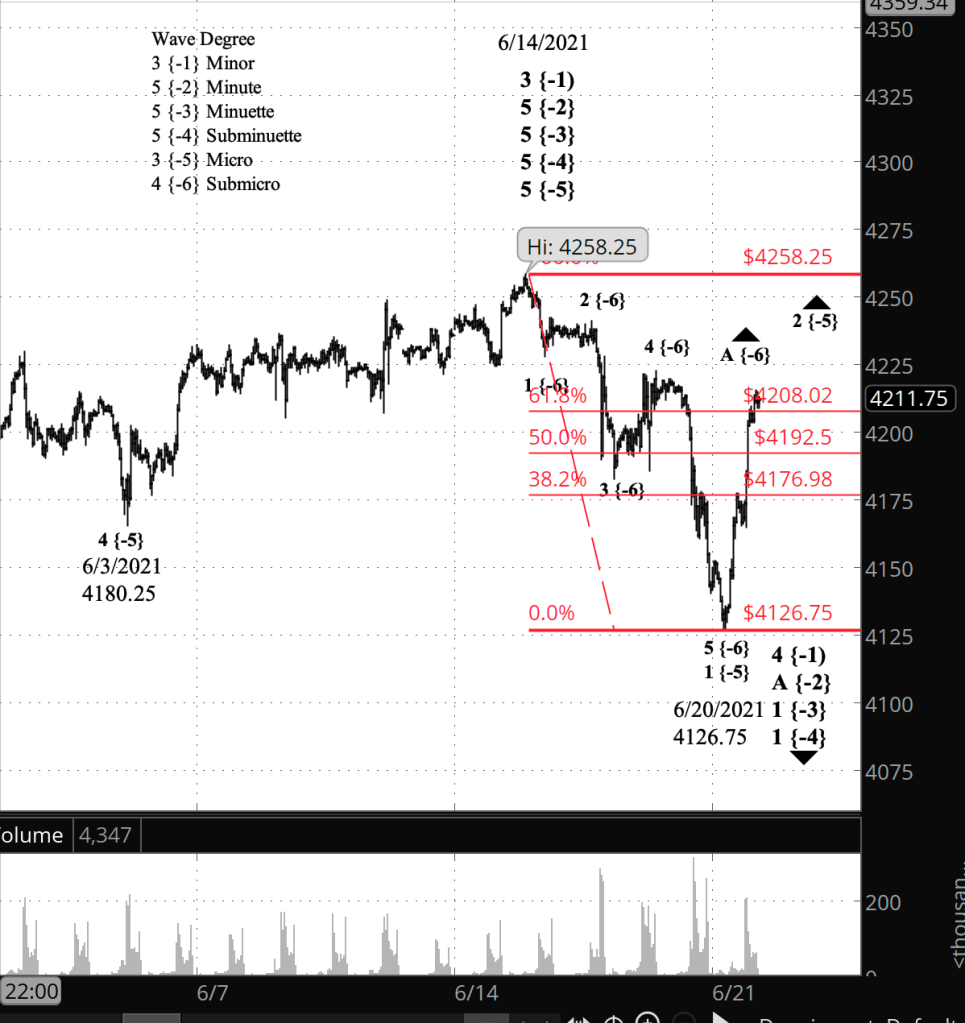
Half an hour before the closing bell. The S&P 500 continues its rise during the trading day, reaching just above a 61.8% Fibonacci retracement of the fall from June 14 to June 20. This morning’s pause at the 38.2% retracement level was so slight that I’m reluctant to call it the end of wave A and the start of wave B of the Submicro degree. It just doesn’t fit the rule of proportionality in Elliott wave theory. So I’ve counted the full rise so far as wave A, and I anticipate that it will be followed by a wave B decline and then a final push up as wave C.

9:40 a.m. New York time

What’s happening now? The S&P 500 E-mini futures reached a low of 4126.75 in overnight trading and then reversed to the upside, retracing 38% of the decline that began June 14.

What does it mean? The reversal marks the completion of the first leg in what will develop into a significant downtrend, and the upward move overnight is a small correction within that downtrend.

What’s the alternative? My principle analysis counts the high of June 14 as the end of an uptrend that began on February 28, 2020. It’s possible that the uptrend is still ongoing, and the proof of that would be the price continuing to rise from its present level, exceeding the mid-June peak of 4258.25.

[S&P 500 E-mini futures at 3:30 p.m., 45-minute bars, with volume]

What does Elliott wave theory say? The overnight rise paused at a 38.2% Fibonacci retracement level as it takes back part of the decline that began on June 14, which is wave 1 of Submicro degree within wave 1 of Micro degree, the early stages of a downtrend stretching all the up to Minute degree. The entire downtrend is occurring within wave A of Minute degree within wave 4 of Minor degree.

The overnight rise is wave 2 of Submicro degree within wave 1 of Micro degree. In my experience 2nd waves tend to take the form of a Zigzag, a markedly directional three-wave structure. The pause at the 38.2% Fibonacci level may mark the end of wave A of Submicro degree, although not necessarily. The next move in a Zigzag is a decline that stays above the beginning of wave A, which is 4126.75 in this case, and then a wave C reversal to high highs. The 61.8% Fibonacci level (4208.02) would be a not uncommon end point for wave C, but it could very well go higher, or run out of steam before reaching that level, perhaps at the 50% fibonacci level (4192.50).

Under the alternative analysis, wave 5 of Micro degree didn’t end on June 14 and still underway, with the decline from that date being an A wave within a downward correction. One aspect of the chart that makes this conceivable is the weakness of the Micro wave 5 rise from June 3 to the June 14 peak. It counts as a 5th wave completion, but it doesn’t feel that way, intuitively.

Learning and other resources. See the menu page Analytical Methods for a rundown on where to go for information on Elliott wave analysis.

By Tim Bovee, Portland, Oregon, June 21, 2021

Disclaimer

Tim Bovee, Private Trader tracks the analysis and trades of a private trader for his own accounts. Nothing in this blog constitutes a recommendation to buy or sell stocks, options or any other financial instrument. The only purpose of this blog is to provide education and entertainment.

No trader is ever 100 percent successful in his or her trades. Trading in the stock and option markets is risky and uncertain. Each trader must make trading decisions for his or her own account, and take responsibility for the consequences.

License
Creative Commons License

All content on Tim Bovee, Private Trader by Timothy K. Bovee is licensed under a Creative Commons Attribution-ShareAlike 4.0 International License.

Based on a work at www.timbovee.com.
SP500 Analysis

3:30 p.m. New York time

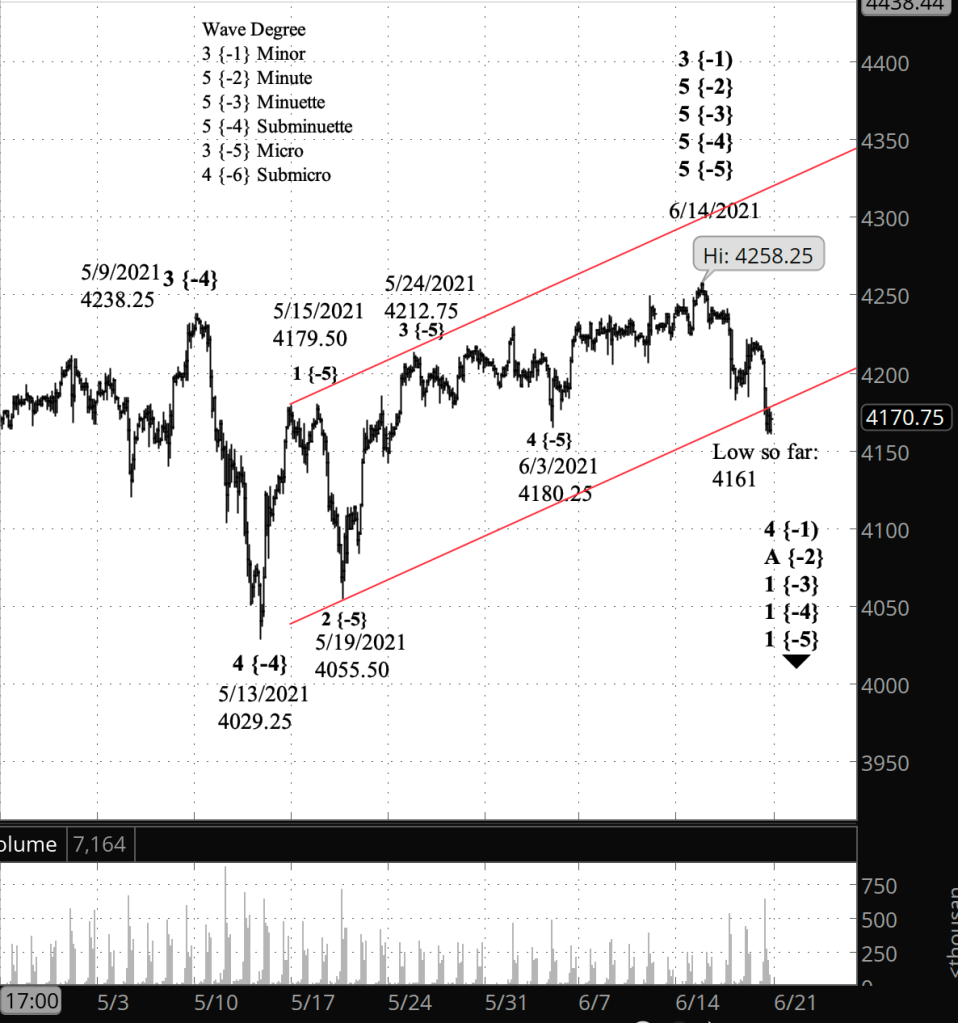
Half an hour before the closing bell. The S&P 500 continued to work its way lower, down to 4161 so far today on the futures. No change in the analysis. I’ve updated the short-term chart. I’ve also updated the long-term chart, adding in the upper and lower boundaries of wave 4 of Minute degree, the target range for for the Minor wave 4 correction that began on June 14.

10:30 a.m. New York time

Added. I’ve added a longer-term chart to the Elliott wave analysis section below.

10:20 a.m. New York time

What’s happening now? The S&P 500 E-mini futures fell in overnight trading and past the opening bell, reaching as low so far as 4170.50.

What does it mean? I had said in an earlier analysis that a decline below 4180.25, the low on June 3 that marked the beginning of an upward push, would make it less likely that the decline from the June 14 peak is a correction within an ongoing uptrend. My revised principle analysis labels the June 14 peak of 4258.25 as the end of the rise that began May 13 and the beginning of a new downtrend.

What’s the alternative? It’s possible that the uptrend that began May 13 is still underway, although at this point I’m uncertain how it could be counted. If the price rises back above the June 14 peak, then this alternative will become the principle analysis.

[S&P 500 E-mini futures at 3:30 p.m., 2-hour bars, with volume]

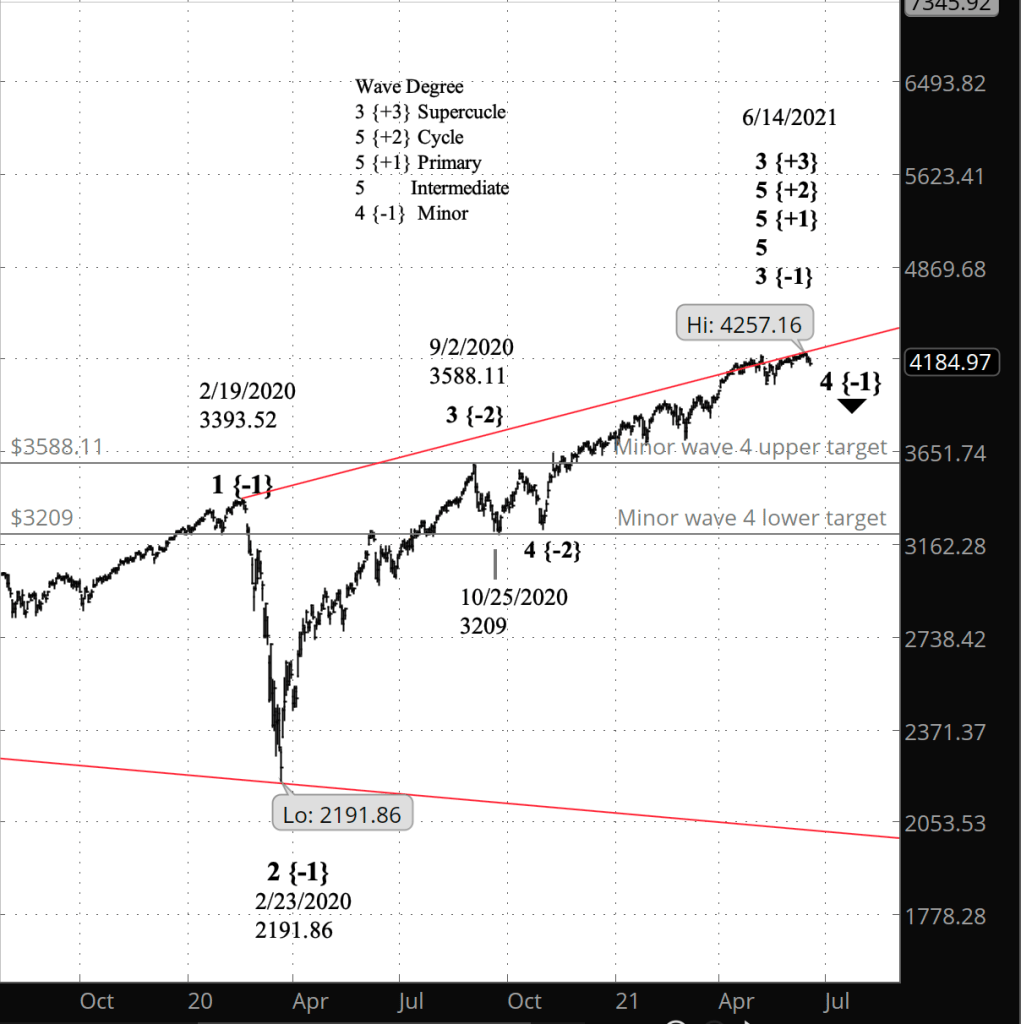
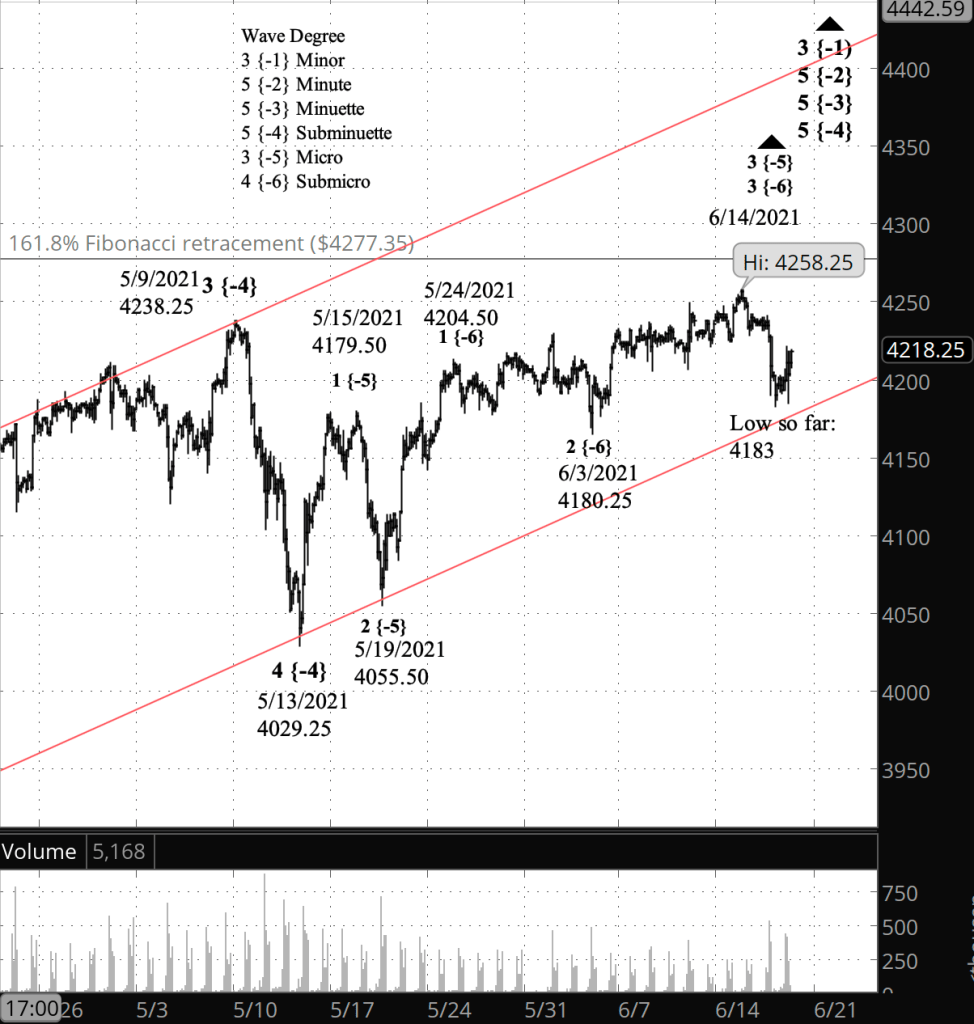
What does Elliott wave theory say? Under my principle analysis, the June 14 peak, ending wave 5 of Micro degree, is also the end of a series of 5th waves of greater degree, up three levels to wave 5 of Minute degree, which in turn marks the end of wave 3 of Minor degree, which began on February 23, 2020 — the end of the crash that marked the beginning of the pandemic.

I’ve redrawn the price channel for wave 5 of Subminuette degree. It shows the final internal wave, the 5th of Micro degree, failing to come close to the upper boundary of the channel. It’s not a truncated wave, since it moved beyond the peak of wave 3, but it’s not typical of 5th waves that I’ve seen.

With wave 3 of Minor degree having reached an end, the next move will be a large-degree 4th wave correction. Fourth waves tend to be on the shallow side, taking the form of a Flat, although not always, and often will extend in compound patterns, linking several corrective forms together, although not always. A 4th wave never moves beyond the end of the preceding wave 1, which is 2191.86 on the index. So that’s an absolute floor on the coming decline, and I expect it to end well above that level. A 4th wave will often end within the range of subwave 4 of the preceding 3rd wave, which would be between 3588 and 3209 on the index, a range set by wave 4 of Minute degree last October.

[S&P 500 index at 3:25 p.m., daily bars]

Learning and other resources. See the menu page Analytical Methods for a rundown on where to go for information on Elliott wave analysis.

By Tim Bovee, Portland, Oregon, June 18, 2021

Disclaimer

Tim Bovee, Private Trader tracks the analysis and trades of a private trader for his own accounts. Nothing in this blog constitutes a recommendation to buy or sell stocks, options or any other financial instrument. The only purpose of this blog is to provide education and entertainment.

No trader is ever 100 percent successful in his or her trades. Trading in the stock and option markets is risky and uncertain. Each trader must make trading decisions for his or her own account, and take responsibility for the consequences.

License
Creative Commons License

All content on Tim Bovee, Private Trader by Timothy K. Bovee is licensed under a Creative Commons Attribution-ShareAlike 4.0 International License.

Based on a work at www.timbovee.com.
SP500 Analysis

4 p.m. New York time

Juneteenth. U.S. markets will be open on Friday, the new Juneteenth holiday.

3:30 p.m. New York time

Half an hour before the closing bell. The S&P 500 continued to trade above its overnight low while remaining below yesterday’s high, which marked the start of a steep decline coinciding with release of the Federal Open Market Committee statement and FOMC member forecasts.

The news-driven fall proved to be short lived, as the futures bounced back to a high so far of 4221.75.

No change to the analysis. I’ve updated the chart.

9:40 a.m. New York time

What’s happening now? The S&P 500 E-mini futures continued their decline overnight, coming close to the lower price-channel boundary of the rise that began on March 4.

What does it mean? Under my principle analysis, I expect the price to reverse shortly (or perhaps it already has reversed) and reach new highs as the uptrend that began on May 19 continues, with a near-term upside target around the 4270s and a longer-term target in the low 4400s.

What’s the alternative? If the June 14 high proves to have been the end of the uptrend that began March 4, falling short of the upper boundary of the price channel. then a correction is already under way. When it complete, the rise will resume toward the longer-term target.

[S&P 500 E-mini futures at 3:30 p.m., 2-hours bars, with volume]

What does Elliott wave theory say? By my principle analysis, the decline that began yesterday is a corrective subwave within rising wave 3 of Submicro degree. Under my alternative analysis, the June 14 peak was the end of Submicro 3 and Submicro wave 4 has begun. A decline below the June 3 low — the beginning of Submicro wave 3 — would buttress the case for the alternative analysis.

Learning and other resources. See the menu page Analytical Methods for a rundown on where to go for information on Elliott wave analysis.

By Tim Bovee, Portland, Oregon, June 17, 2021

Disclaimer

Tim Bovee, Private Trader tracks the analysis and trades of a private trader for his own accounts. Nothing in this blog constitutes a recommendation to buy or sell stocks, options or any other financial instrument. The only purpose of this blog is to provide education and entertainment.

No trader is ever 100 percent successful in his or her trades. Trading in the stock and option markets is risky and uncertain. Each trader must make trading decisions for his or her own account, and take responsibility for the consequences.

License
Creative Commons License

All content on Tim Bovee, Private Trader by Timothy K. Bovee is licensed under a Creative Commons Attribution-ShareAlike 4.0 International License.

Based on a work at www.timbovee.com.