SP500 Analysis

2:45 p.m. New York time

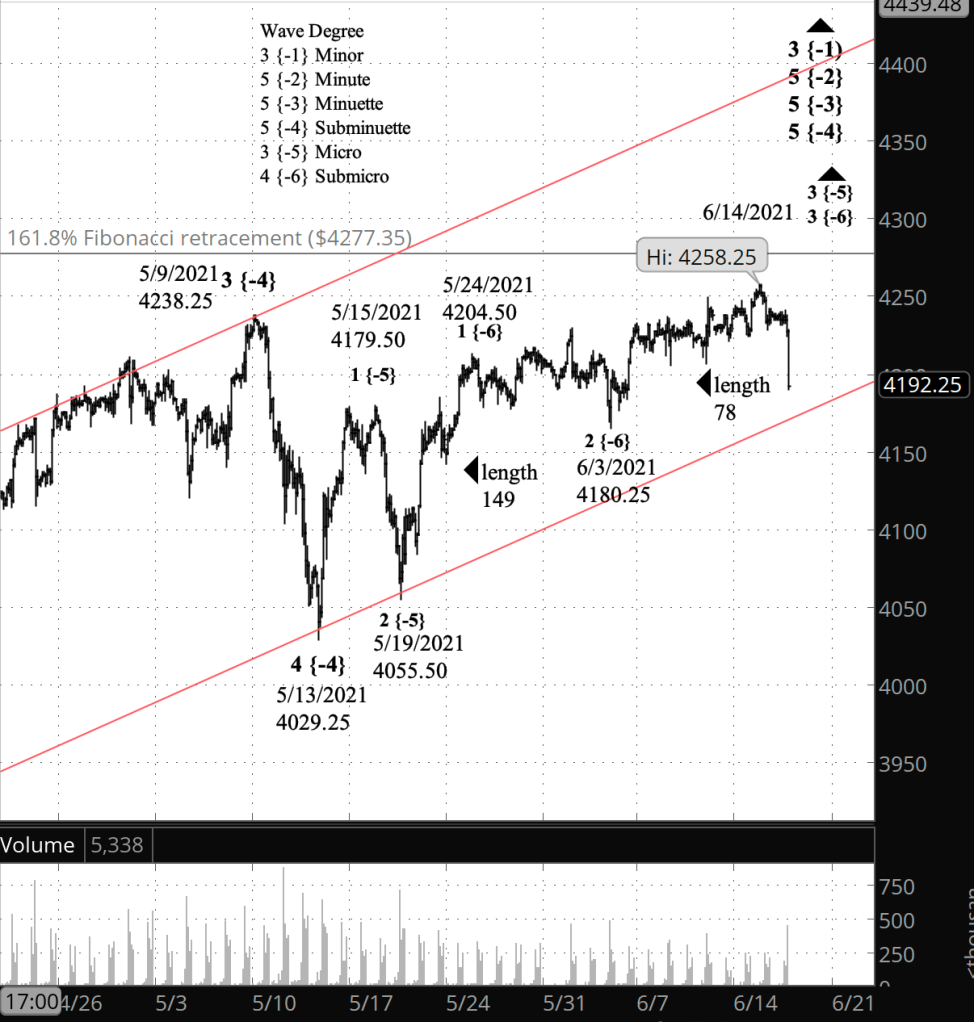
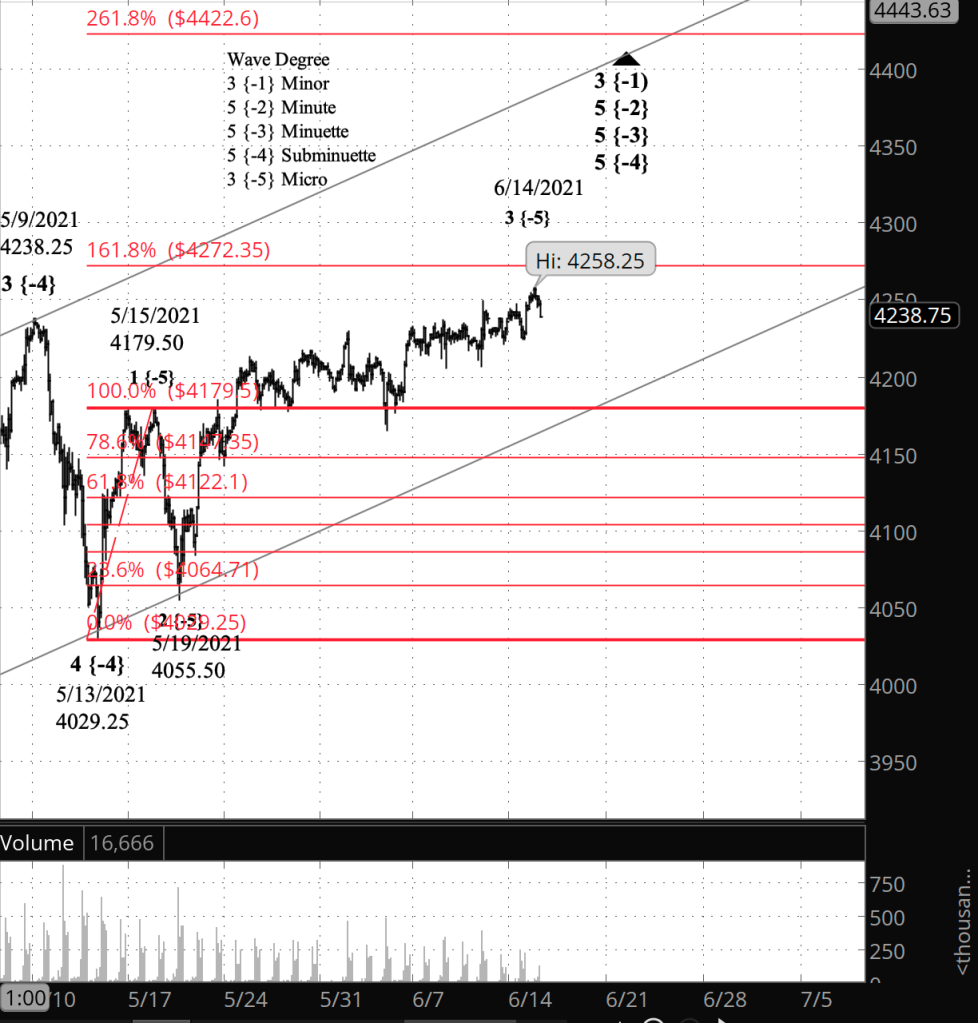
After the FOMC announcement. The S&P 500 dropped sharply immediately after the FOMC monetary policy announcement. The decline is in line with my principle analysis from this morning, that the wave 3 of Micro degree uptrend is still in progress, and the sharp decline is a correction of smaller degree within that uptrend.

Looking at the internals of Micro wave 3, I interpret the decline to be part of the rise rather than an end to Submicro wave 3 is because of a strict rule of Elliott wave analysis: A 3rd wave cannot be the shorter than both waves 1 and 5 within the same trend. If the June 14 peak were indeed the end of wave 3, then the 3rd wave would be 78 points long and the 1st wave would be 149 points long. That’s a large difference. It would be fine if wave 5 were to be shorter than 78 degrees, but my working assumption is that wave 3 will be longer than both waves 1 and 5, and for now I’ll stick to that assumption.

It is entirely possible that subsequent price moves will prove that assumption false, requiring a change in my analysis.

I’ve updated the chart below.

9:55 a.m. New York time

What’s happening now? The S&P 500 E-mini futures continued its small uptrending pattern in overnight trading, remaining below the peak of 4258.25 set on June 14.

What does it mean? For my principle analysis I’m treating the peak as a pause on a continuing rise, with a target in the 4270s for the rise from May 19 and in the 4400s for the larger rise that began on March 4. The end of the larger rise will mark the beginning of a significant decline.

What’s the alternative? It’s possible to see 4258.25 as the end of the rise that began on May 19 and the subsequent trading below the peak as the first steps in shallow correction.
[S&P 500 E-mini futures at 2:45 p.m., 2-hour bars, with volume]

What does Elliott wave theory say? The rise that began on May 19, from 4055.50, is wave 3 of Micro degree. I’ve set the target completion at a Fibonacci level 161.8% above the beginning of the preceding wave 1 of Micro degree (dark horizontal line on the chart). Within Micro wave 3, I count the present wave as being either wave 5 of Submicro degree (the principle analysis), or wave 4 of Submicro degree (the alternative analysis).

Micro 5 is part of wave 5 of Subminuette degree, which began on May 13 from from 4029.25. I’ve used a price channel for the parent wave, 5 of Minuette degree, which began on March 4 from 3720.50 (parallel red lines). The target in a rising price channel depends upon how long it takes for the price to reach the upper boundary. By June 20, the upper boundary, and therefore the target, will be at 4400, which 165 points above the present level.

Learning and other resources. See the menu page Analytical Methods for a rundown on where to go for information on Elliott wave analysis.

By Tim Bovee, Portland, Oregon, June 16, 2021

Disclaimer

Tim Bovee, Private Trader tracks the analysis and trades of a private trader for his own accounts. Nothing in this blog constitutes a recommendation to buy or sell stocks, options or any other financial instrument. The only purpose of this blog is to provide education and entertainment.

No trader is ever 100 percent successful in his or her trades. Trading in the stock and option markets is risky and uncertain. Each trader must make trading decisions for his or her own account, and take responsibility for the consequences.

License
Creative Commons License

All content on Tim Bovee, Private Trader by Timothy K. Bovee is licensed under a Creative Commons Attribution-ShareAlike 4.0 International License.

Based on a work at www.timbovee.com.
SP500 Analysis

3:30 p.m. New York time

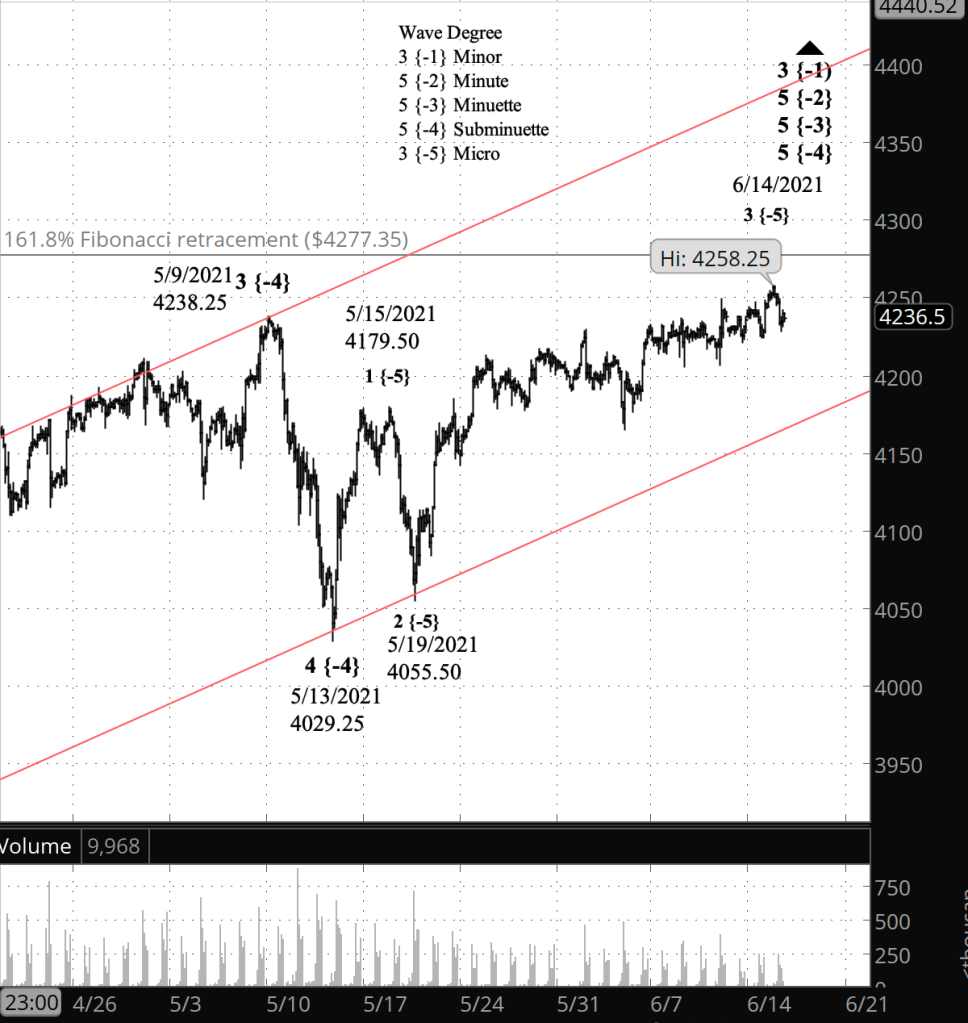
Half an hour before the closing bell. The S&P 500 continued a small decline, while remaining above the prior low. Higher highs, combined with higher low, mean that an uptrend is continuing, and that has been the pattern since the June 10 decline. No change in the analysis. Here’s an updated chart with simplified analytics.

[S&P 500 E-mini futures at 3:30 p.m., 2-hour bars, with volume]

10:05 a.m. New York time

What’s happening now? In overnight trading, the S&P 500 E-mini futures dropped off slightly in from yesterday’s high of 4238.25.

What does it mean? The pattern is a replay of what we’ve seen time and time again in the shallow coasting that began in mid-April. That the price has been in an uptrend since May 13 is clear. That the price is clearly in the third leg of its upward journey is also clear. What’s unclear is how high can it can go. I discuss the question in the Elliott wave theory section, below.

What’s the alternatives? So, two alternatives, equally likely: 1) Yesterday’s high is a pause in an ongoing rise that will reach new heights. 2) Yesterday’s high is the end of the rise and the drop-off is an early stage of a correction.

[S&P 500 E-mini futures at 10:03 a.m., 2-hour bars, with volume]

What does Elliott wave theory say? Under the continuing rise scenario the present rise is wave 3 of Micro degree within wave 5 of Subminuette degree. The question is, when does MIcro wave 3 reach its peak? And more important, when does its parent, Subminuette wave 5, reach its peak? For the end of Subminuette 5 will trigger a substantial downturn reaching all the way up to Minute degree, which is presently in its 5th wave.

I’ll tackle the Micro wave 3 problem first. Internally, Micro 3 is in its 5th wave of Submicro degree. (I haven’t marked the internal count on the chart, leaving it as an exercise for the reader.) Fifth waves, however, can cover quite a lot of ground, and so the internal count does little to set an upper limit. The take-away here is that the count gives greater weight to the continuing rise analysis.

Often, a 3rd wave will have a Fibonacci retracement relation to the preceding 1st wave. (Read about Fibonacci retracements here.) I’ve placed a Fibonacci retracement ladder on the chart. At yesterday’s high of 4258.25, the price is approaching a 161.8% retracement of the ground covered by the 1st wave of Micro degree. That Fibonacci level is 4272.35, and that can stand as a reasonable end-point target for the 3rd wave of MIcro degree. Fibonacci retracements are never exact, and the prices don’t always turn at Fibonacci levels. However, if the price is does turn at the next major Fibonacci level, it will be around 4272 plus/minus a bit.

To find target for the parent, wave 5 Subminuette degree, let’s turn to the parallel gray lines on the chart. They’ve appeared in my charts for several days running, in red, and they are a price channel for wave 5 of MInuette degree, which began on March 4 from 3720.50. Under the patterns used in Elliott wave theory, wave 5 of Subminuette degree ought to end around the upper boundary of the price channel. Sometimes such rises fall short of the boundary, and sometimes they overshoot it. Nonetheless, the price channel is almost always a point that has impact on the price direction.

The price channel is uptrending, and we don’t know how long it will take the price to reach the boundary, so it’s impossible to say for sure just how high Subminuette 5 will go. But there are some indications. The preceeding Subminuette 3 took a month and half to run its course, and 3rd waves tend to be the longest part of a rise. Subminuette 5 so far has been in progress for a month and two days. So if it runs another week — still shorter than the preceding 3rd wave — it would peak around June 20, at 4400. If it equalled wave 3 in time, it would reach an end around June 27, in the 4430s.

I would not bet the farm on those targets. My experience will Elliott wave analysis has shown me that at best, a target is an educated guess. I find Elliott wave targeting to be more accurate than other methods, but as always in market analysis, nothing is 100%. Elliott wave analysis provides context, not prophecy.

Learning and other resources. See the menu page Analytical Methods for a rundown on where to go for information on Elliott wave analysis.

By Tim Bovee, Portland, Oregon, June 15, 2021

Disclaimer

Tim Bovee, Private Trader tracks the analysis and trades of a private trader for his own accounts. Nothing in this blog constitutes a recommendation to buy or sell stocks, options or any other financial instrument. The only purpose of this blog is to provide education and entertainment.

No trader is ever 100 percent successful in his or her trades. Trading in the stock and option markets is risky and uncertain. Each trader must make trading decisions for his or her own account, and take responsibility for the consequences.

License
Creative Commons License

All content on Tim Bovee, Private Trader by Timothy K. Bovee is licensed under a Creative Commons Attribution-ShareAlike 4.0 International License.

Based on a work at www.timbovee.com.
SP500 Analysis

3:30 p.m. New York time

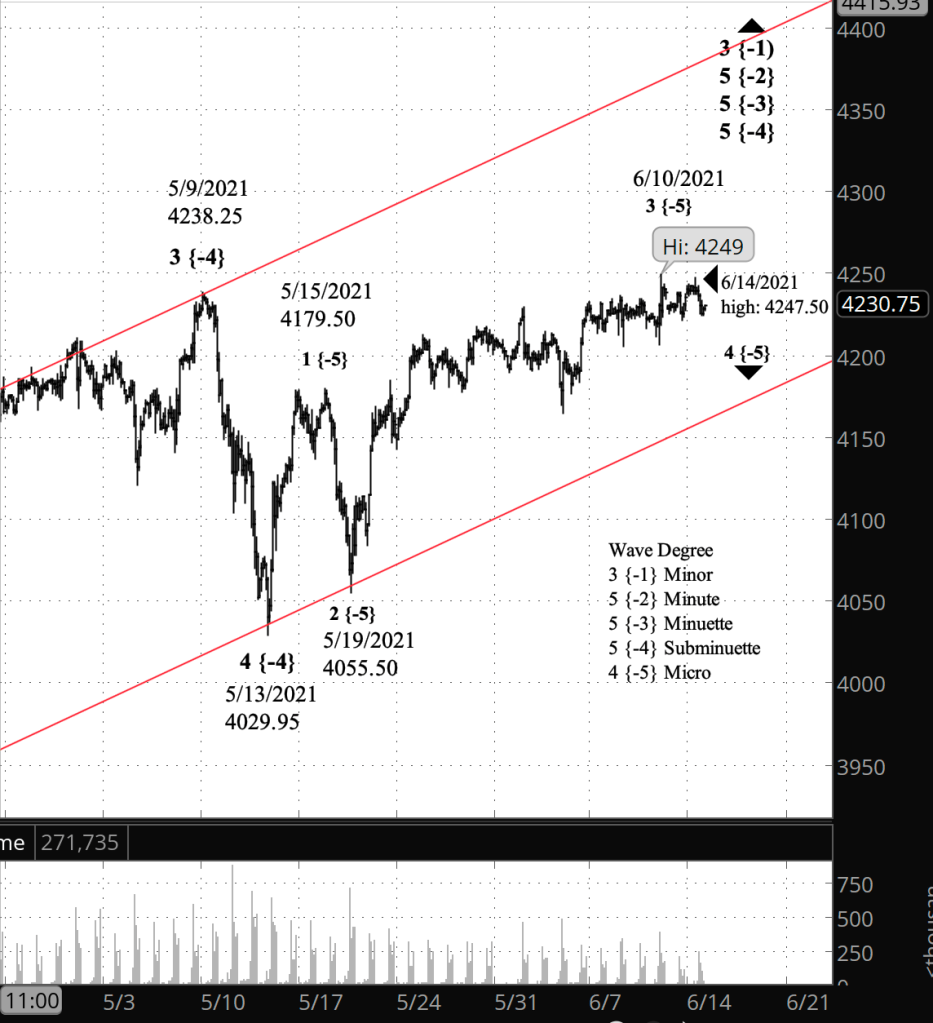
Half an hour before the closing bell. The S&P 500 E-mini futures traded in a sideways pattern — wave 4 of MIcro degree — throughout the day, reaching a high of 4247.50 on the futures, a point and a half below the June 10 peak. I’ve updated the chart. The analysis is unchanged.

9:45 a.m. New York time

What’s happening now? The S&P 500 E-mini futures continued to trade slightly below the June 10 high of 4249.

What does it mean? The lower price level, by my principle analysis, means that the rise that began on May 13 from 4029.95 is complete, and the following downward correction has begun.

What’s the alternative? The chart is also consistent with the a smaller correction within an ongoing rise from May 13.

[S&P 500 E-mini futures at 3:30 p.m., 2-hour bars, with volume]

What does Elliott wave theory say? The rise from May 13 to June 10 is wave 3 of Micro degree within wave 5 of Subminuette degree. I expect the 4th wave correction following Micro wave 3 to be shallow, as 4th waves tend to be. Also, the preceding 2nd wave correction was a Zigzag pattern, and by the rule of alternation, the 4th wave ought to be a Flat. All of this is happening within a series of 5th waves of higher degrees, up to wave 5 of Minute degree, which is the final wave of its parent, wav 3 of Minor degree, which began on February 23, 2020.

The end of the Micro 4th wave correction will mark the start of a push to new highs as wave 5 of Micro degree.

In the alternate analysis, the trading since June 10 has been a lower-degree correction within a still incomplete wave 3 of Micro degree.

Learning and other resources. See the menu page Analytical Methods for a rundown on where to go for information on Elliott wave analysis.

By Tim Bovee, Portland, Oregon, June 14, 2021

Disclaimer

Tim Bovee, Private Trader tracks the analysis and trades of a private trader for his own accounts. Nothing in this blog constitutes a recommendation to buy or sell stocks, options or any other financial instrument. The only purpose of this blog is to provide education and entertainment.

No trader is ever 100 percent successful in his or her trades. Trading in the stock and option markets is risky and uncertain. Each trader must make trading decisions for his or her own account, and take responsibility for the consequences.

License
Creative Commons License

All content on Tim Bovee, Private Trader by Timothy K. Bovee is licensed under a Creative Commons Attribution-ShareAlike 4.0 International License.

Based on a work at www.timbovee.com.
SP500 Analysis

3:30 p.m. New York time

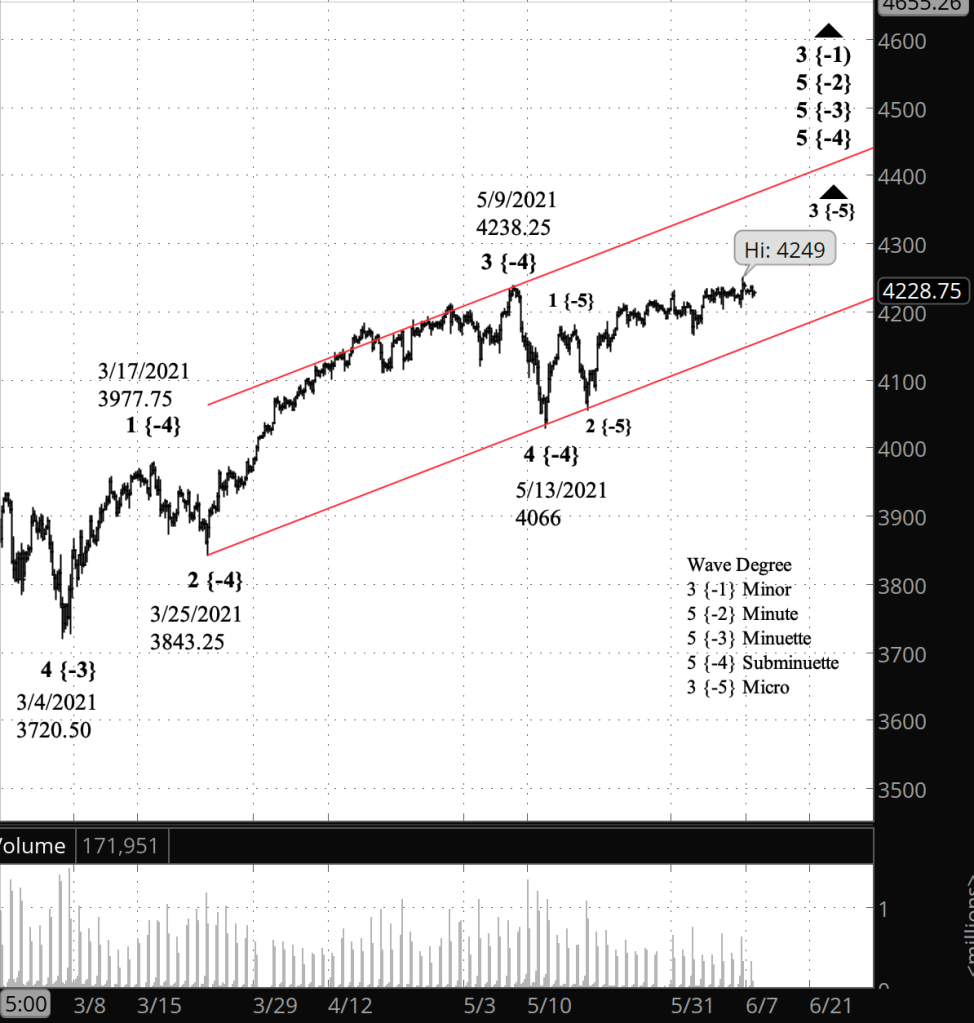
Half an hour before the closing bell. The S&P 500 since the opening bell has traded within a narrow range, staying below yesterday’s high of 4249 on the futures, 4249.74 on the index. No change in the analysis. I’ve updated the chart.

9:50 a.m. New York time

Added a graf to the Elliott wave analysis section, below.

9:35 a.m. New York time

What’s happening now? The S&P 500 E-mini futures in overnight trading remained below yesterday’s high of 4249.

What does it mean? The uptrend that began May 13 at 4066 continues. A price channel for the rise that began on March 4 from 3720.50 suggests that the price will reach the 4500s or higher before touching the channel’s upper boundary and reversing course.

What’s the alternative? Although prices tend to reach the upper boundaries of their channels, there’s no guarantee they will do so. An early reversal is possible.

[S&P 500 E-mini futures at 3:30 p.m., 4-hour bars, with volume]

What does Elliott wave theory say? The price channel tracks wave 5 of Minuette degree, which began on March 4 from 3720.50. The lower boundary connects the starting points of waves 3 and 5 of Subminuette degree, with the parallel upper boundary passing through the end of Subminuette 3.

Presently, from small to large, wave 3 of Micro degree is underway, within wave 5 of Subminuette degree within wave of Minuette degree.

One striking aspect of the chart is the flatness of wave 3 of Micro degree. Third waves are usually powerhouses, with enough strength to trigger hopeful talk of a bull market. This is a very weak third wave. To my thinking, the shallow angle of the rise suggests that the S&P 500 will struggle to reach the upper boundary of the price channel.

Learning and other resources. See the menu page Analytical Methods for a rundown on where to go for information on Elliott wave analysis.

By Tim Bovee, Portland, Oregon, June 11, 2021

Disclaimer

Tim Bovee, Private Trader tracks the analysis and trades of a private trader for his own accounts. Nothing in this blog constitutes a recommendation to buy or sell stocks, options or any other financial instrument. The only purpose of this blog is to provide education and entertainment.

No trader is ever 100 percent successful in his or her trades. Trading in the stock and option markets is risky and uncertain. Each trader must make trading decisions for his or her own account, and take responsibility for the consequences.

License
Creative Commons License

All content on Tim Bovee, Private Trader by Timothy K. Bovee is licensed under a Creative Commons Attribution-ShareAlike 4.0 International License.

Based on a work at www.timbovee.com.
SP500 Analysis

3:30 p.m. New York time

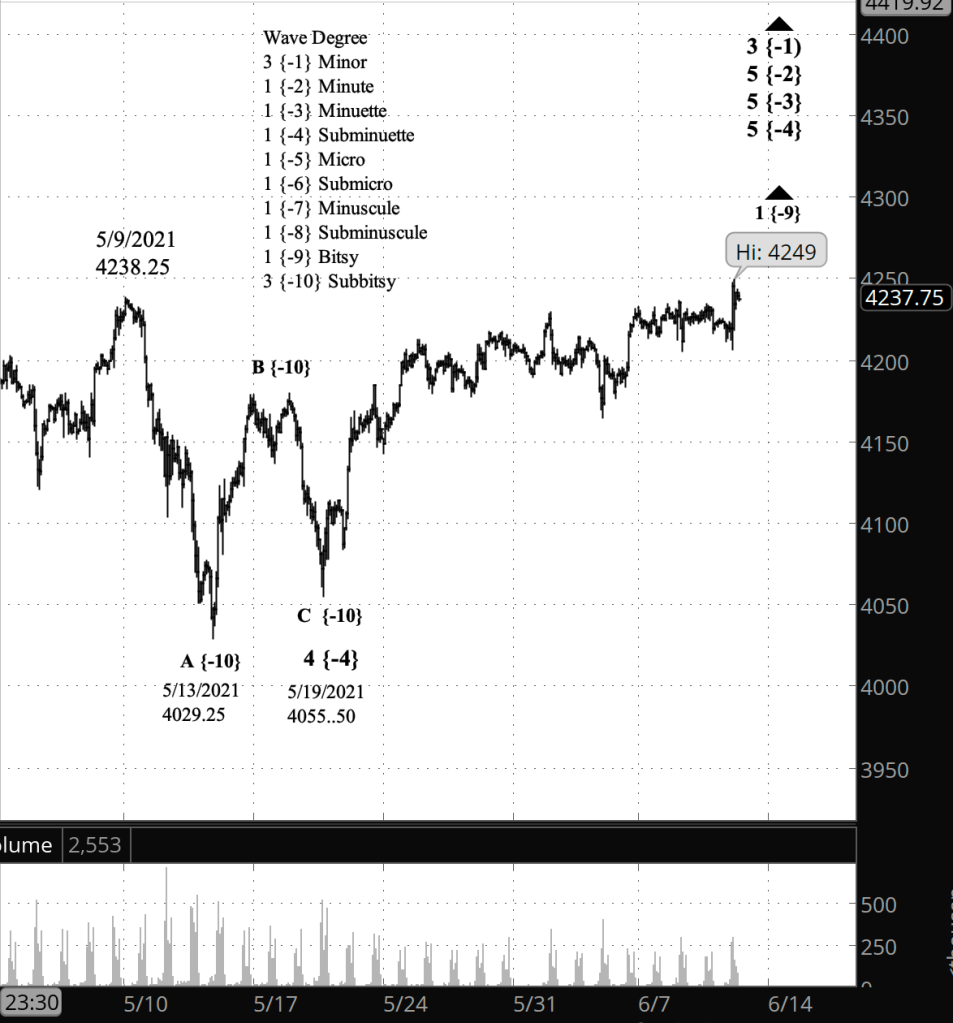
Half an hour before the closing bell. The S&P 500 rose slightly higher than at the opening, to 4249 on the futures and 4249.74 on the index. The analysis is unchanged. I’ve updated the short-term chart.

10:05 a.m. New York time

What’s happening now? At the opening bell the S&P 500 E-mini futures and the index both moved above the high of May 9 after four days of trading within a narrow range just a few points below that peak.

What does it mean? The new high means the correction following the May 9 high has been a minor pullback within an uptrend stretching back to February 23, 2020. The new high requires a tentative repositioning of the upper boundary of an expanding triangle that began on December 26, 2018, from 2346.58 on the index. I say tentative because the rise from 2018 is not yet complete and each new high will require a readjustment.

What’s the alternative? The alternatives will concern just how much upside remains. At this point, I haven’t a clue. There’s no requirement that the present upward movement cover a lot of ground, nor a barrier to it doing so.

Charts. First, a short-term chart, covering the same period we’ve been tracking since the decline began on May 9.

[S&P 500 E-mini futures at 3:30 p.m., 90-minute bars, with volume]

… and then a long-term chart showing the entirety of the expanding triangle so far.

[S&P 500 index at 10:03 a.m., 2-day bars]

What does Elliott wave theory say? Wave 3 of Minor degree is still under way, a year and three months, plus a few weeks, after its inception. Within Minor 3, the correction, wave 4 of possibly Subminuette degree, ended on May 19, and the subsequent wave 5 of the same degree is still in an early stage, which I’ve labeled as wave 1 of Bitsy degree.

Learning and other resources. See the menu page Analytical Methods for a rundown on where to go for information on Elliott wave analysis.

By Tim Bovee, Portland, Oregon, June 10, 2021

Disclaimer

Tim Bovee, Private Trader tracks the analysis and trades of a private trader for his own accounts. Nothing in this blog constitutes a recommendation to buy or sell stocks, options or any other financial instrument. The only purpose of this blog is to provide education and entertainment.

No trader is ever 100 percent successful in his or her trades. Trading in the stock and option markets is risky and uncertain. Each trader must make trading decisions for his or her own account, and take responsibility for the consequences.

License
Creative Commons License

All content on Tim Bovee, Private Trader by Timothy K. Bovee is licensed under a Creative Commons Attribution-ShareAlike 4.0 International License.

Based on a work at www.timbovee.com.
SP500 Analysis

3:30 p.m. New York time

Half an hour before the closing bell. The S&P 500 continued to trade below yesterday’s high. No change in the analysis. Price updated.

9:40 a.m. New York time

What’s happening now? The S&P 500 E-mini futures slid sideways in overnight trading, remaining below yesterday’s high of 4236.75.

What does it mean? As long as the price remains below the May 9 high of 4238.25, then my principle analysis is that the correction that began on that date is still underway.

What’s the alternative? A move above 4238.25 triggers the alternative count, that the uptrend that began on February 23, 2020 is still underway.

Why is the price going nowhere? An old mentor of mine described it this way: When a price stalls, it’s because people wanting to buy and those wanting to sell have reached an equilibrium. The price will rise further only when people have a greater desire to buy compared to people wanting to sell, and the reverse to trigger a price decline.

People holding S&P 500 positions saw the value of their holdings decline by 4.9% between May 9 and May 13.The present price is a 5.1% rise from May 13 and stands just below the breakeven point. It seems reasonable that some people, spooked by the decline, want to get out before a bigger decline begins. Others, encouraged by the rise, want to hold their positions in the expectation of a break back into profitability. Eventually, one group or the other will gain sufficient numbers to move the price. The present Elliott wave analysis suggests that the decline group will win, but Elliott provides context, not prophecy.

[S&P 500 E-mini futures at 3:30 p.m., 85-minute bars, with volume]

What does Elliott wave theory say? Under my principle analysis, the rise from May 13 is wave 2 of Subbitsy degree, and internally it is nearing the end of a wave C. From that point, it will either decline in separator wave and then add a third corrective pattern to the compound correction. Or it will decline to below 4029.25, confirming that the downtrend is underway.

Under the alternative analysis, the price will move above 4238.25 in a continuation of wave 5 of Subminuette degree.

Learning and other resources. See the menu page Analytical Methods for a rundown on where to go for information on Elliott wave analysis.

By Tim Bovee, Portland, Oregon, June 9, 2021

Disclaimer

Tim Bovee, Private Trader tracks the analysis and trades of a private trader for his own accounts. Nothing in this blog constitutes a recommendation to buy or sell stocks, options or any other financial instrument. The only purpose of this blog is to provide education and entertainment.

No trader is ever 100 percent successful in his or her trades. Trading in the stock and option markets is risky and uncertain. Each trader must make trading decisions for his or her own account, and take responsibility for the consequences.

License
Creative Commons License

All content on Tim Bovee, Private Trader by Timothy K. Bovee is licensed under a Creative Commons Attribution-ShareAlike 4.0 International License.

Based on a work at www.timbovee.com.
SP500 Analysis

3:30 p.m. New York time

Half an hour before the closing bell. The S&P 500 spent the day barely budging as it remained below the overnight high. of 4236.75. I have no change to my analysis. I’ve updated the chart.

10:20 a.m. New York time

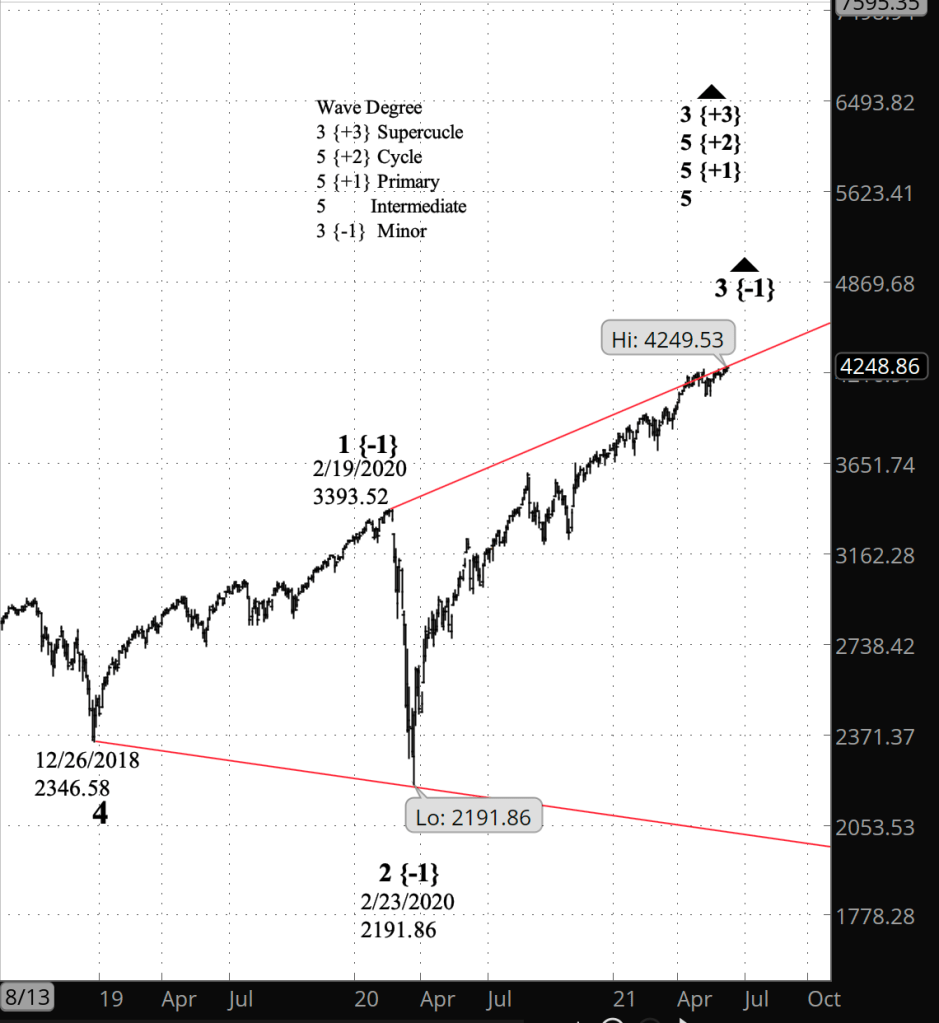
What’s happening now? The S&P 500 E-mini futures rose further still in overnight trading, reaching 4236.75 before pulling back slightly. That overnight high is within a point and a half of the starting point of the downtrend that began on May 9 from 4238.25. The dotted red line on the chart shows the 4238.25 level.

What does it mean? As long as the price doesn’t exceed 4238.25, then my principle analysis stands: The decline from May 9 is the beginning of a new downtrend that will eventually carry the price down to the low 2000s or below. The rise that began on May 13 is a correction within that larger downtrend.

What’s the alternative? If the price moves above 4238.25, then the decline from May 9 marked the start of a correction within an ongoing uptrend that began on February 23, 2020. That correction has ended and the uptrend has resumed.

A complication. The S&P 500 futures, which trade continually except for a break on weekends, are a derivative of the S&P 500 index, which trades only during normal market hours in New York. So while the futures are within a hair’s breadth of the May 9 high, the index price isn’t as close. The May 9 high on the index was 4238.04, and the subsequent high was 4234.12 on June 1, a distance of 3.92 points.

So what to do if the futures reach a new all-time high but the index does not? Although the futures are derived from the index, they are separate products, and I shall analyze them separately.

[S&P 500 E-mini futures at 3:30 p.m., 80-minute bars, with volume]

What does Elliott wave theory say? The May 9 peak ended wave 5 of Subminuette degree, which on the futures began from 3525.50 on October 30, 2020 and a series of 5th waves of higher degree up to wave 3 of Minor degree, which began on February 23, 2020 from 2191.96 on the index.

Under my principle analysis, the present rise wave C within wave 2 of Subbitsy degree with declining wave 1 of Bitsy degree, all within wave 4 of Minor degree.

If the futures exceed 4238.25, then the present rise will be a 1st wave rise of low degree within a continuing wave 5 of Subminuette degree — maybe. I’m not entirely sure how the count will run if that level is exceeded.

Learning and other resources. See the menu page Analytical Methods for a rundown on where to go for information on Elliott wave analysis.

By Tim Bovee, Portland, Oregon, June 8, 2021

Disclaimer

Tim Bovee, Private Trader tracks the analysis and trades of a private trader for his own accounts. Nothing in this blog constitutes a recommendation to buy or sell stocks, options or any other financial instrument. The only purpose of this blog is to provide education and entertainment.

No trader is ever 100 percent successful in his or her trades. Trading in the stock and option markets is risky and uncertain. Each trader must make trading decisions for his or her own account, and take responsibility for the consequences.

License
Creative Commons License

All content on Tim Bovee, Private Trader by Timothy K. Bovee is licensed under a Creative Commons Attribution-ShareAlike 4.0 International License.

Based on a work at www.timbovee.com.
SP500 Analysis

3:30 p.m. New York time

Half an hour before the closing bell. The S&P 500 throughout the day traded a few points below its early morning high of 4232.50. No change in the analysis. Chart updated.

10:05 a.m. New York time

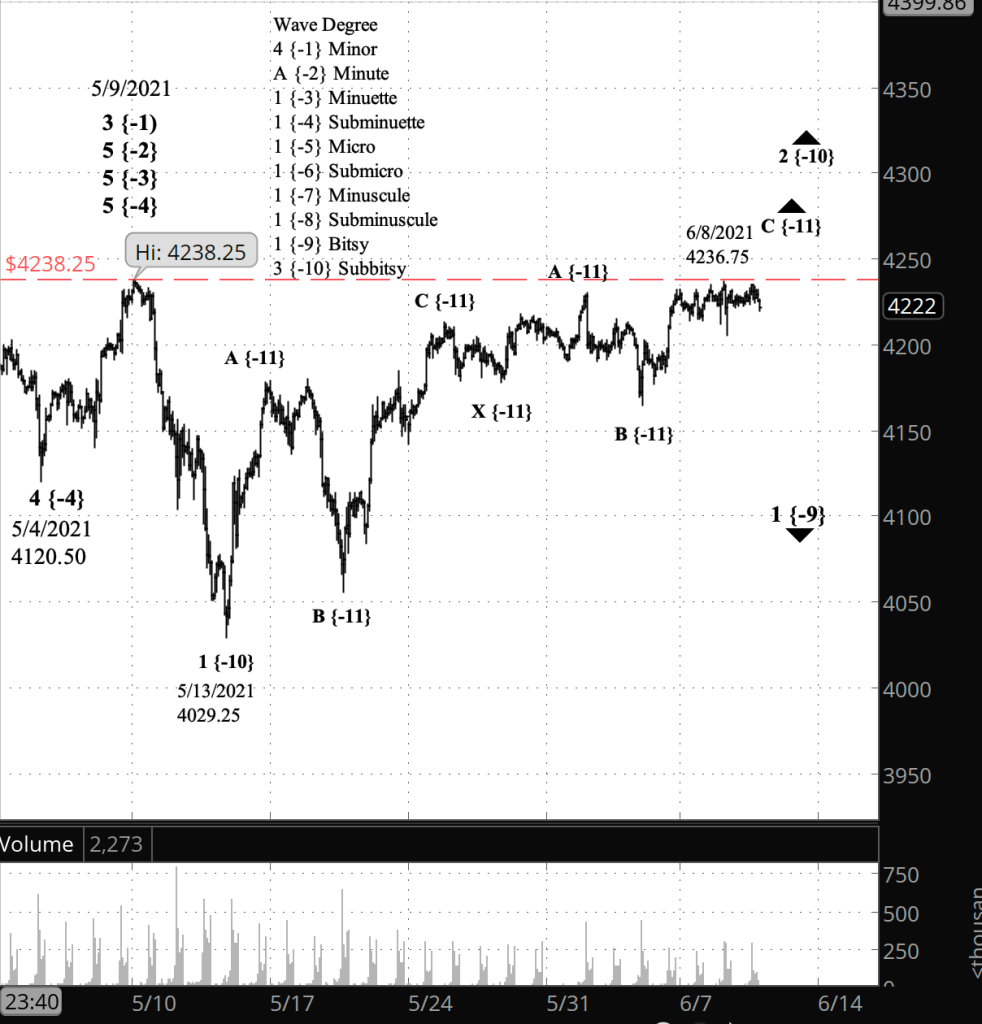
What’s happening now? The S&P 500 E-mini futures twice hit 4232.50 before the opening bell, once on Sunday again on Monday. The peaks are less than six points below the May 9 high of 4238.25

What does it mean? The new highs exceeded the June 1 high of 4230, meaning that the upward correction that began on May 13 is still underway. Under my principle analysis, that correction is occurring within a larger downtrend.

What’s the alternative? If the price moves above 4238.25, then the uptrend that began on February 23, 2020 is still underway.

[S&P 500 E-mini futures at 3:30 p.m., 80-minute bars, with volume]

What does Elliott wave theory say? The higher highs required a repositioning of waves A, B and C within the Subbitsy wave 2 upward correction.

Under my principle analysis, the present wave is wave C within Subbitsy 2 within downtrending Bitsy wave 1, the early stage of what will become a significant downtrend. The downtrend follows the end of wave 5 of Subminuette degreeon May 9.

If the price exceeds exceeds 4238.25, then wave 5 of Subminuette degree is still underway.

Learning and other resources. See the menu page Analytical Methods for a rundown on where to go for information on Elliott wave analysis.

By Tim Bovee, Portland, Oregon, June 7, 2021

Disclaimer

Tim Bovee, Private Trader tracks the analysis and trades of a private trader for his own accounts. Nothing in this blog constitutes a recommendation to buy or sell stocks, options or any other financial instrument. The only purpose of this blog is to provide education and entertainment.

No trader is ever 100 percent successful in his or her trades. Trading in the stock and option markets is risky and uncertain. Each trader must make trading decisions for his or her own account, and take responsibility for the consequences.

License
Creative Commons License

All content on Tim Bovee, Private Trader by Timothy K. Bovee is licensed under a Creative Commons Attribution-ShareAlike 4.0 International License.

Based on a work at www.timbovee.com.
SP500 Analysis

3:30 p.m. New York time

Half an hour before the closing bell. The S&P 500E-mini futures rose to within a dollar of the June 1 peak of 4230. If it rises above that level, then the upward correction that began on May 13 is still underway and Elliott wave analysis will label today’s peak as wave C within wave 2 of Subbitsy degree. and the June 1 peak will be an A wave within wave C within Subbitsy wave 2. I’ve kept this morning’s analysis as my principle, and will continue to do so until the 4230 level is beached.

9:40 a.m. New York time

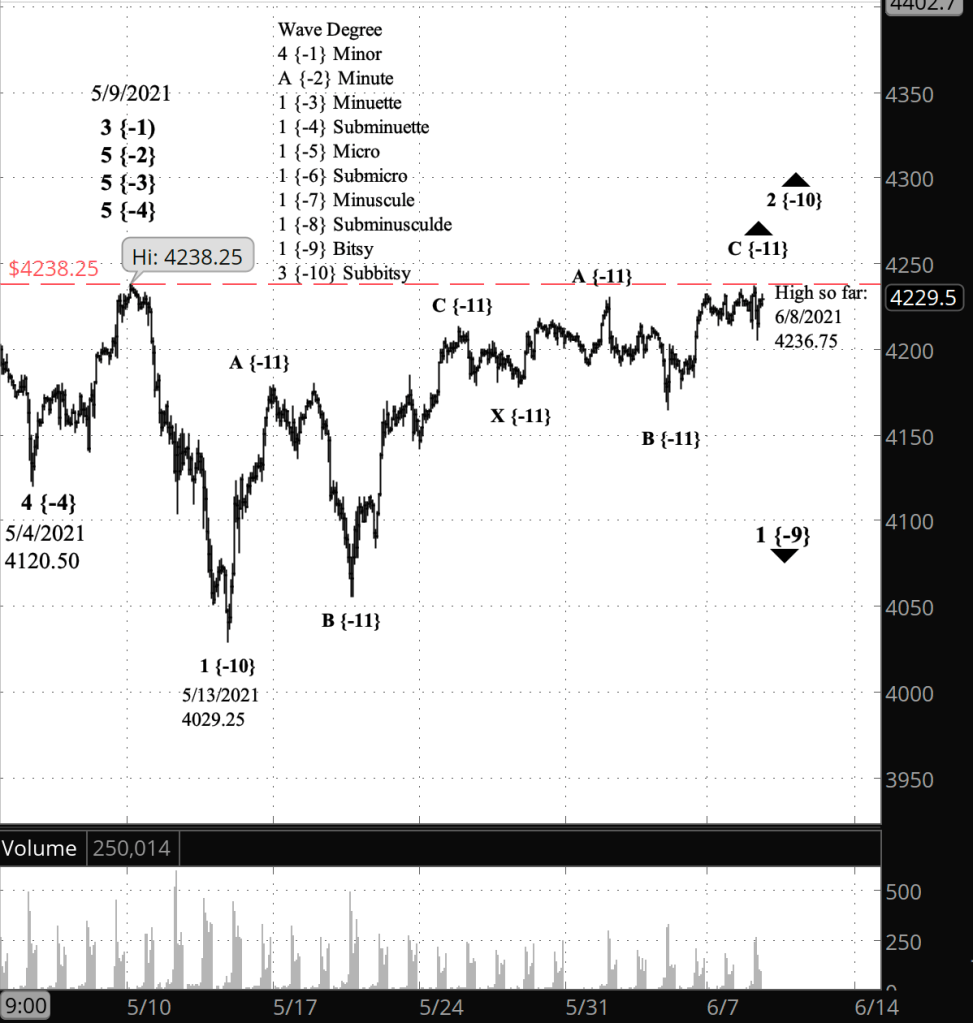
What’s happening now? The S&P 500 E-mini futures rose sharply in early trading, reaching a high (so far) of 4214.75, less than 20 points below the June 1 high of 4230.

What does it mean? My principle analysis places that June 1 high as the end of an upward correction within a downtrend that began May 13, and as long as the price remains below 4230, that analysis stands.

What are the alternatives? 1) A rise above the June 1 high would mean that the correction is still underway. 2) A price above the May 9 high, the peak of a larger rise that began last year, would mean that the correction was within an ongoing uptrend rather than a downtrend.

[S&P 500 E-mini futures at 3:30 p.m., 80-minute bars, with volume]

What does Elliott wave theory say? Wave 5 of Subminuette degree and of higher degrees peaked on May 9, ending a long-running uptrend. The subsequent decline is the first wave of a new downtrend, which is still in its first baby steps, wave 1 of Bitsy degree. Within that 1st wave, wave 2 of Subbitsy degree ended on June 1, and the chart is now in the early stages of Subbitsy wave 3.

In the first alternative analysis, a rise above the end of Subbitsy wave 2 would mean that the 2nd wave correction is still underway. In the second analysis, a rise above the end of wave 5 of Subminuette degree would mean that the long-running uptrend is still underway.

Learning and other resources. See the menu page Analytical Methods for a rundown on where to go for information on Elliott wave analysis.

By Tim Bovee, Portland, Oregon, June 4, 2021

Disclaimer

Tim Bovee, Private Trader tracks the analysis and trades of a private trader for his own accounts. Nothing in this blog constitutes a recommendation to buy or sell stocks, options or any other financial instrument. The only purpose of this blog is to provide education and entertainment.

No trader is ever 100 percent successful in his or her trades. Trading in the stock and option markets is risky and uncertain. Each trader must make trading decisions for his or her own account, and take responsibility for the consequences.

License
Creative Commons License

All content on Tim Bovee, Private Trader by Timothy K. Bovee is licensed under a Creative Commons Attribution-ShareAlike 4.0 International License.

Based on a work at www.timbovee.com.
SP500 Analysis

3:30 p.m. New York time

Half an hour before the closing bell. The S&P 500 recovered much of its overnight decline, reaching 4202.50 on the futures. The price remained below the overnight high. I have no change to the analysis and have updated the chart.

9:35 a.m. New York time

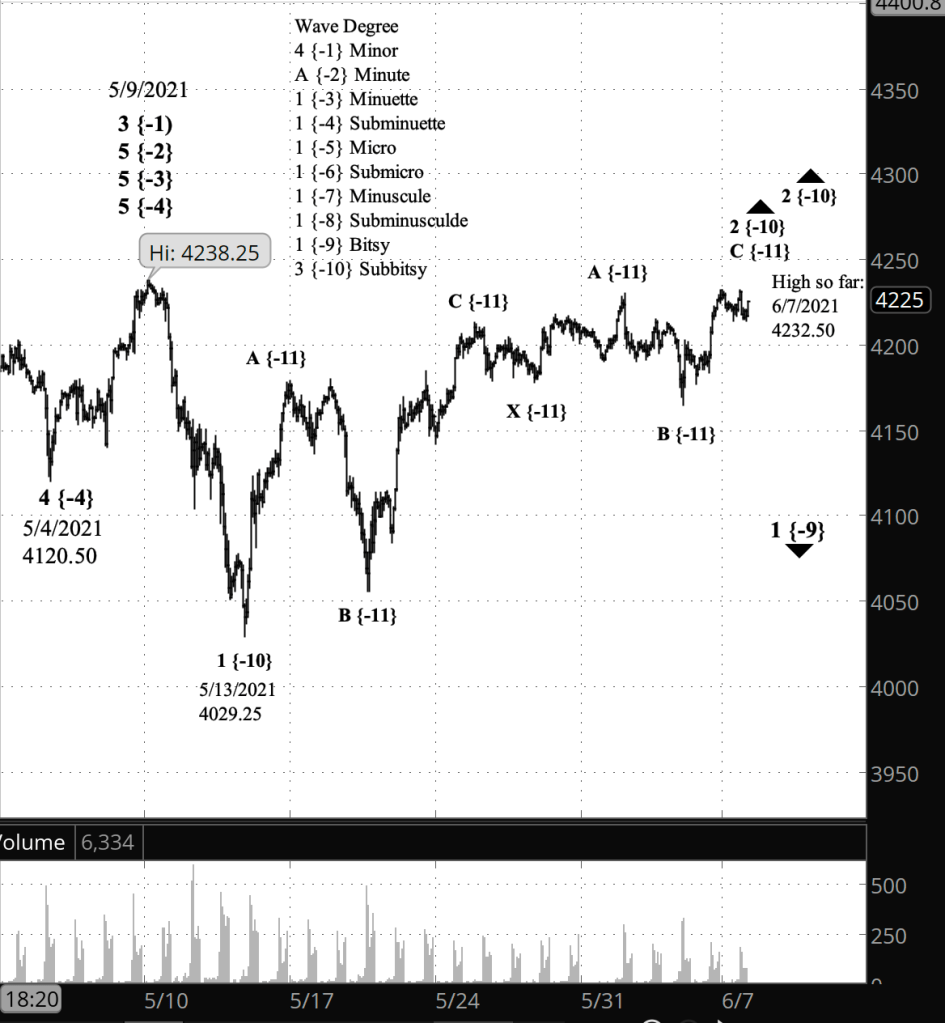
What’s happening now? The S&P 500 E-mini futures declined sharply in overnight trading, down to a low of 4169.50 before the opening bell.

What does it mean? The further the decline, the greater the confirmation of yesterday’s principle analysis: The June 1 peak of 4230 marked the end of the upward correction that began on May 13 from 4029.25, and the downtrend that began on May 9 from 4238.25 has resumed.

What’s the alternative? It is possible that the correction is still underway. Given the overnight decline, I consider this to be the less likely analysis. A rise above the June 1 high of 4230 would confirm this alternate analysis.

[S&P 500 E-mini futures at 3:30 p.m., 75-minute bars, with volume]

What does Elliott wave theory say? Under my principle analysis, wave 2 of Subbitsy degree ended on June 1 and Subbitsy wave 3 began. Third waves tend to have a lot energy — the sort of thing that makes market analysts perk up and start talking about the end of a bull market — and this wave 3 will carry the price below 4029.25, the end of the preceding 1st wave, perhaps significantly below.

This is all happening within wave 1 of Bitsy degree, a small step in the large-degree downtrend that began on May 9. The May 9 peak was the end of wave 5 of Minute degree, which began on October 30, 2020 from 3225. The Minute degree is eight degrees larger than Subbitsy degree, so it’s a big deal. Under this analysis I expect the price to work its way down to the 3200s and below. But never in a straight line. The market always is fractal in its nature, showing trends and corrections within larger trends and corrections, from the largest to the smallest moves.

Under the alternative analysis, the Subbitsy wave 2 correction is still underway, and the price can be expected to reverse, returning to the 4200s as the correction continues on its course. However, there is a limit: If the price moves above the start of the preceding 1st wave, 4238.25, then the entire analysis is tossed out as invalid, and the large-degree uptrend that has been going on for more than a year is still underway.

Learning and other resources. See the menu page Analytical Methods for a rundown on where to go for information on Elliott wave analysis.

By Tim Bovee, Portland, Oregon, June 2, 2021

Disclaimer

Tim Bovee, Private Trader tracks the analysis and trades of a private trader for his own accounts. Nothing in this blog constitutes a recommendation to buy or sell stocks, options or any other financial instrument. The only purpose of this blog is to provide education and entertainment.

No trader is ever 100 percent successful in his or her trades. Trading in the stock and option markets is risky and uncertain. Each trader must make trading decisions for his or her own account, and take responsibility for the consequences.

License
Creative Commons License

All content on Tim Bovee, Private Trader by Timothy K. Bovee is licensed under a Creative Commons Attribution-ShareAlike 4.0 International License.

Based on a work at www.timbovee.com.