11:25 a.m. New York time
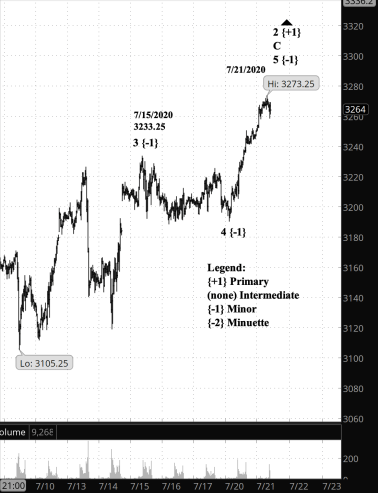
What’s happening now? The S&P 500 E-mini futures pulled back from yesterday’s peak of 3273.25, although by only 34 points or so.
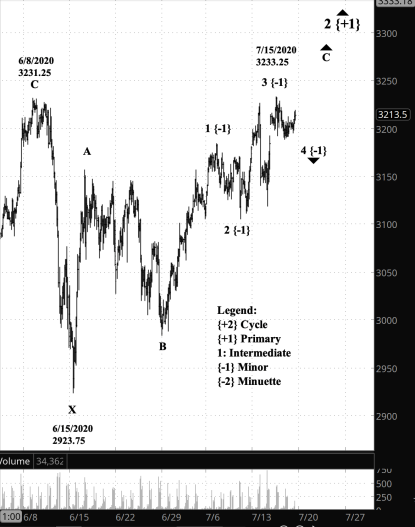
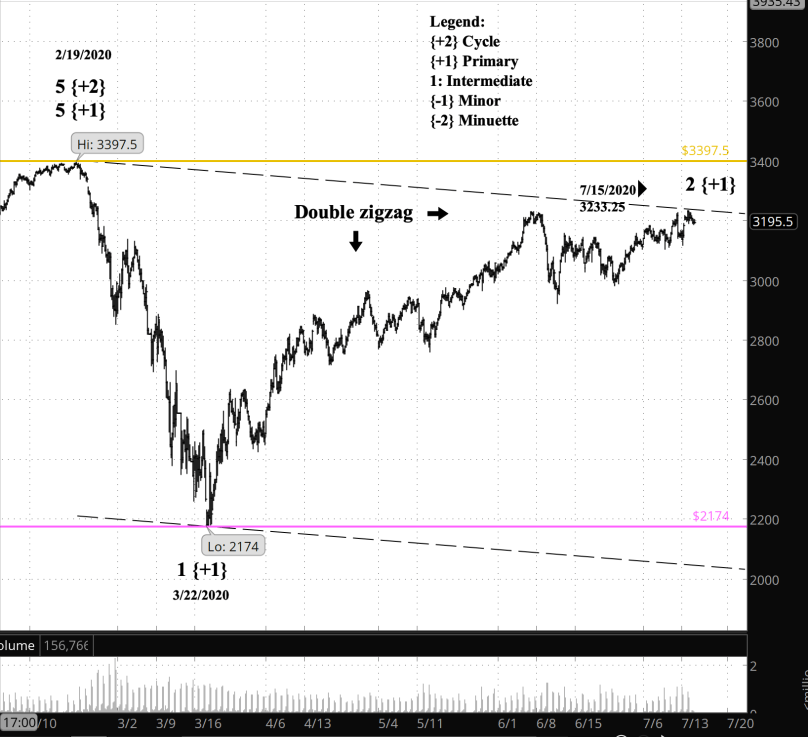
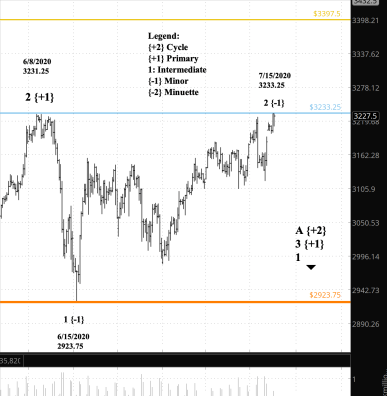
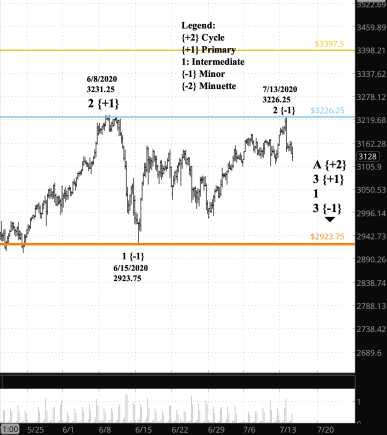
What does it mean? The correction that began March 22 may have ended on July 21, or perhaps not. At this point my analysis is stuck in a swamp of ambiguity. A drop below the start of the present near-term push upward, beginning June 26 from 2983.50, would suggest that the correction had ended. A drop below 2174 (the purple line) would confirm it.
What is the alternative? If the price moves above 3397.50 (the tan line), then the rise that began in December 1974 is still underway, and what we’ve seen since the February crash has been a correction within an ongoing uptrend.
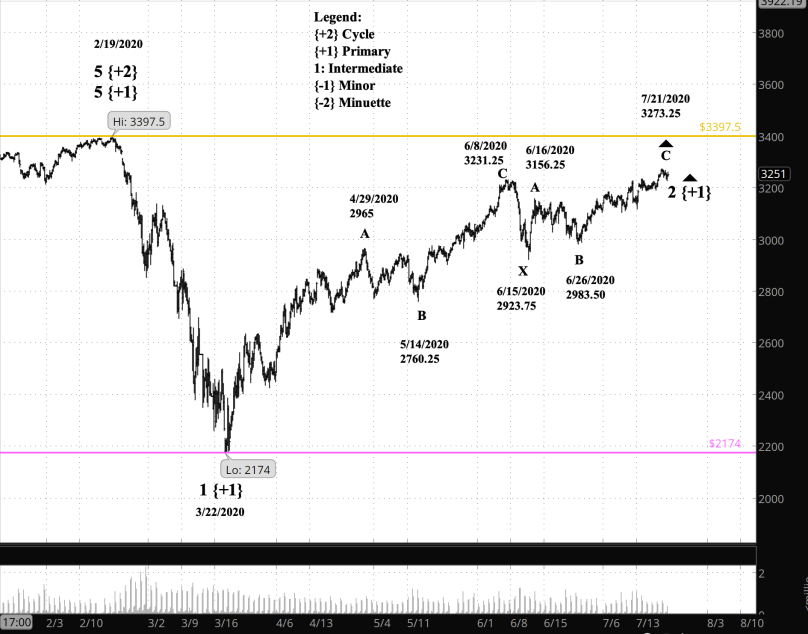
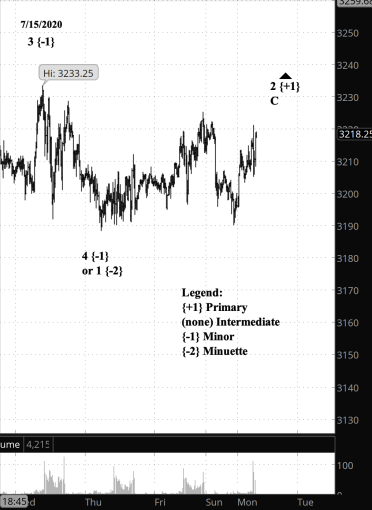
What does Elliott wave theory say? The recent push up is Intermediate wave C in the second part of a double Zigzag pattern taken by the Primary degree 2nd wave correction that began March 22. Multi-Zigzag patterns are separated by an X wave in my nomenclature, so the decline following the completion of Intermediate C will be an X wave if the correction turns out to be a triple Zigzag. If not, then the correction is over, and the initial decline will be Intermediate wave 1 of Primary wave 3.
So how do we know which it is? That’s the great frustration of Elliott wave analysis, because we can’t know for sure until the price breaks one of the rules of Elliott. Until a rule is broken, then it’s all a matter of probabilities.
The rule governing the present chart is that a 2nd wave (such as our present Primary wave 2) cannot move below the start of the preceding 1st wave of the same degree. Primary wave 1 began on March 22 at 2174, and so if the price drops below that level then and only then can we say for certain that Primary wave 3 has begun. That’s a long drop before the uncertainty is resolved.
However, the further down the price goes, even if it is above the start of wave 1, the greater the likelihood that Primary wave 3 has indeed begun.
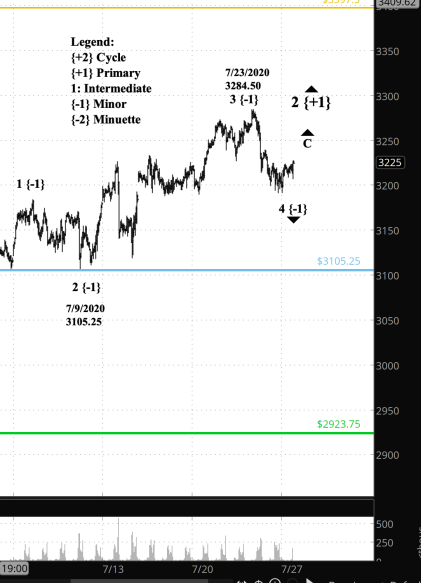
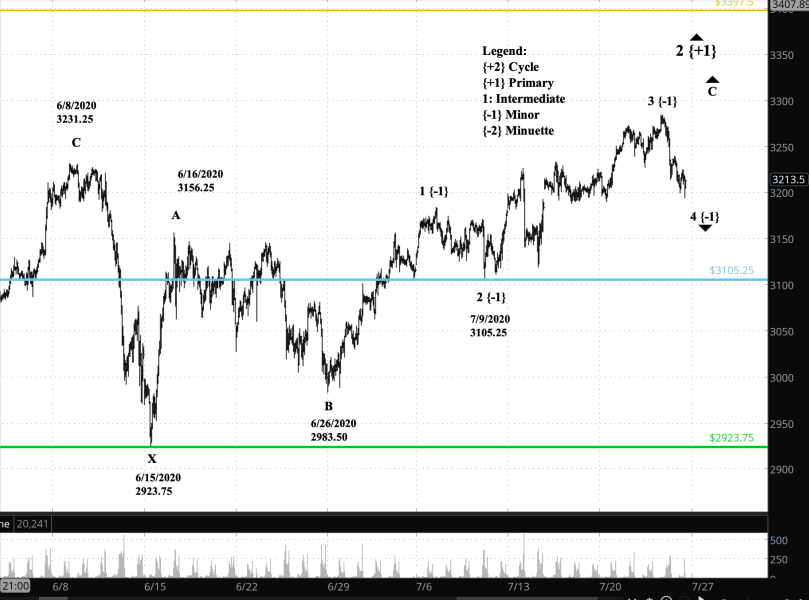
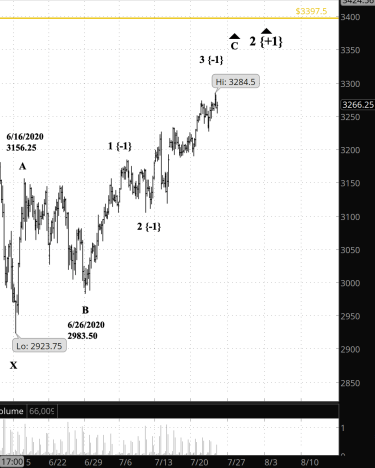
Another technique is to count the waves that are internal to the downward movement — the waves of Minor degree in this case. If the correction is not over, it will be an Intermediate X wave, which has three subwaves Minor degree. So if the price traces three waves to the downside, Minor A, B and C, and then reverses upward with conviction, the odds are higher that the Primary 2 correction is still underway.
If the correction is over, then the downward move will be Intermediate wave 1, which has five subwaves of Minor degree, numbered 1 through 5. If the 3rd wave down shows a great deal of energy and the following upward movement, wave 4, lacks conviction, then our certainty that Primary 3 is underway will increase.
All of which shows, yet again, that Elliott wave analysis is decidedly not a forecasting technique. It instead plants a “You Are Here” sign on the chart and provides us with concepts to understand the implications of that sign’s placement.
What about my trades? I’m awaiting Primary wave 3 before entering new positions.
Read More »


You must be logged in to post a comment.