JNJ Analysis

Johnson & Johnson (JNJ)

Update 11/7/2018: I have exited JNJ for a debit of $847 per contract, a loss of $287 per contract, with shares at $144.18 each up $9.32 from entry.

Shares rose by 6.9% over 23 days, or a +110% annual rate. The optoins position produced a 33.9% loss for a -538% annual rate.


I have entered a short iron fly spread on JNJ, using options that trade for the last time 32 days hence, on Nov 16. The premium is a $5.60 credit and the stock at the time of entry was priced at $134.86.

I made the decision to enter the trade in my account to coincides with an earnings announcement on Tuesday, Oct. 16, before the opening bell.

The profit zone for this position is between $140.50 on the upside and $130.80 on the downside.

Read More »

Live: Monday, Oct. 15, 2018

11:10 a.m. New York time

I have entered a short iron fly position on JNJ.

I’ve decided to pass on UNH, reserving funds for later in the earnings season.


Today’s Book

Big Debt Crisis by Ray Dalio

I first encountered hedge fund manager Ray Dalio at the outset of the Great Recession a decade ago, in the form of his 30-minute YouTube video How the Economic Machine WorksIn it, Dalio presents an Economics 101 course in how economic downturns happen, the small ones of the business cycle and the big ones of an excess of debt.

It’s a marvelous piece of work, and upon watching it, as our world crumbled about us, I christened him to myself as “The Great Simplifier”, a tribute to his easy to understand style of presentation.

Dalio has returned to his economics tutoring, this time in book form. Big Debt Crisis elaborates on the theories he illustrated so long ago in the video. I’m reading the book now, and find it to be a masterwork of great clarity. From Dalio, of course, I would expect no less. I recommend the book to all traders. Like smart fish, we need to understand the water in which we swim. Dalio provides us with a map.

More about the book


10 a.m. New York time

I have  selection of five potential earnings plays on my desk as I greet the dawn, and have selected two as my best prospects: JNJ for pharmaceuticals and UNH for health insurance and other services.

I’m going with JNJ, since it has the higher implied volatility rank, 67. UNH is also acceptable, and I’ll consider adding it but have not yet made a decision.

The remaining three possibilities are all financials, BLK, GS and MS, which I am passing on without further analysis, having already added financials to my risks this earnings season.

Here’s how my options positions are doing this morning:

sym option debit share price curr % max profit net prft/shr $ option days left
C 3.26 70.35 5.5 0.19 32
EWZ 0.85 38.31 1.2 0.01 32
LEN 3.58 41.22 (10.8) (0.35) 32
SPY 3.67 275.74 15.8 0.69 32
STZ 9.93 223.54 (18.2) (1.53) 32
WBA 3.45 74.20 3.1 0.11 32

And of my shares positions:

sym share price net result % net profit $ days held
AAPL 220.12 -1.7% (3.84) 31
CHK 4.48 12.0% 0.48 31
FXI 35.54 -13.8% (5.67) 31
SPXU 37.37 -7.9% (3.19) 153
TSLA 261.12 -14.4% (43.87) 14
VNQI 52.84 -7.0% (3.97) 32

By Tim Bovee, Portland, Oregon, Oct. 15, 2018

Read More »

The Week Ahead: Industry, retail and housing

This week gets back to the basics, what we make, what we buy and where we’re living as we engage in those fundamental activities of life.

The industrial production  report will be published Tuesday at 10 a.m. New York time, preceded by retail sales on Monday at 8:30 a.m.


Today’s Book

The Psychology of Investing

by John R. Nofsinger

What is the secret of successful trading? Lots of money? The best business data? The right technical trading indicators and techniques? As someone who has spent 36 years actively trading the stock and options markets, my answer would be, “None of the above”. 

All of those external tools, in my opinion, are irrelevant to successful trading. Rather, the secret of successful trading lies within. It is the mindset, the psychology, that makes the difference between success and failure in the markets. (Plus, I’d be remiss not to add, on occasion pure dumb luck.)

For insight, Nofsinger turns to the tools of experimental finance. His study of what happens in the brain as we trade can’t do much for the luck part of the equation, but he has much to say about the credits and debits that our built-in human ways of thinking bring to our trading results.

More about the book


Housing rounds out the triplicity with three reports of its own, housing starts, a leading indicator, on Wednesday at 8:30 a.m. New York time, existing home sales — the larger part of the market — on Friday at 10 a.m., and the less-watched National Association of Homebuilders housing market index on Tuesday at 1 a.m.

The Federal Open Market Committee minutes for the Sept. 26 meeting will be published on Wednesday at 2 p.m. The committee at that meeting raised the federal funds rate by 25 basis points to a target range of 2% to 2-1/4%, and also released members’ economic forecasts.

Read More »

Live: Friday, Oct. 12, 2018

3:45 p.m. New York time

That’s a wrap for the week. On Saturday look for my discussion of economic reports and the Fed, The Week Ahead,

1:20 p.m. New York time

I have updated my JBL analysis with full results.

stock immediately, instead reserve my funds for sector diversification.


Today’s Book

The Power and Independence of the Federal Reserve

by Peter Conti-Brown

A book ripped from today’s headlines!

Since taking office President Trump has regularly praised the rising stock market as a winning outcome of his policies. History, of course, shows that a rising market can rapidly turn into a falling disaster — remember Black Monday in 1987? — and as a smart politician, the president has moved quickly to distance himself from the decline that began on Sept. 20, saying that  the Federal Reserve’s interest rate increases, designed to control inflation, show the central bank has “gone crazy” and is “going loco”.

The Federal Reserve is considered by most to be independent of political branches, such as the White House. But what does that really mean?  Peter Conti-Brown, a professor of legal studies at the University of Pennsylvania, studied that independence, its origins and its workings, in this 2016 book.

More about the book


12:30 p.m. New York time

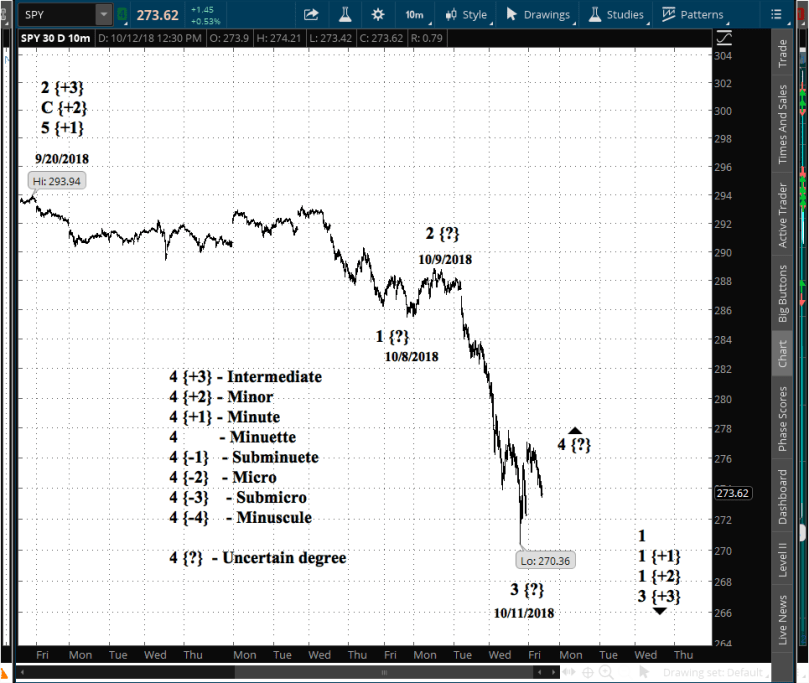
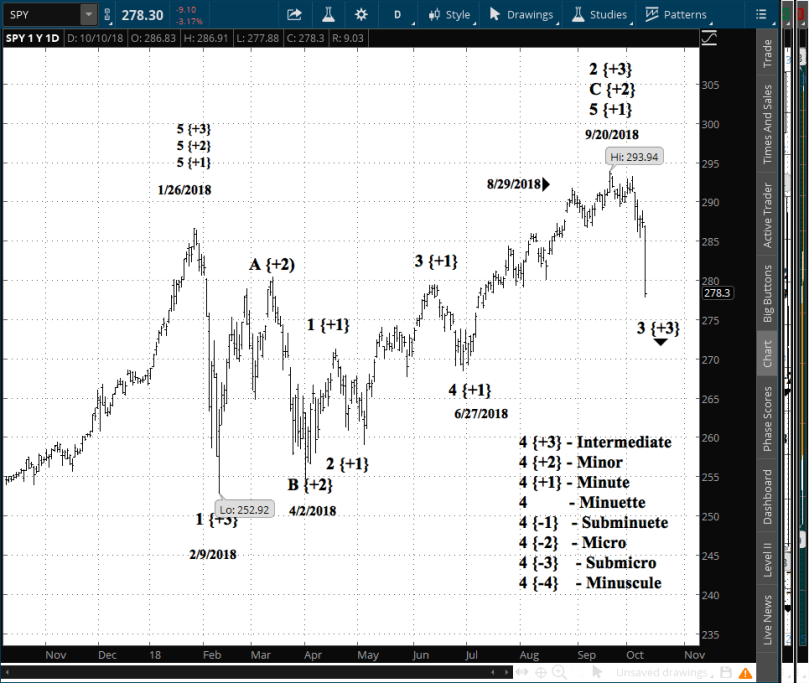
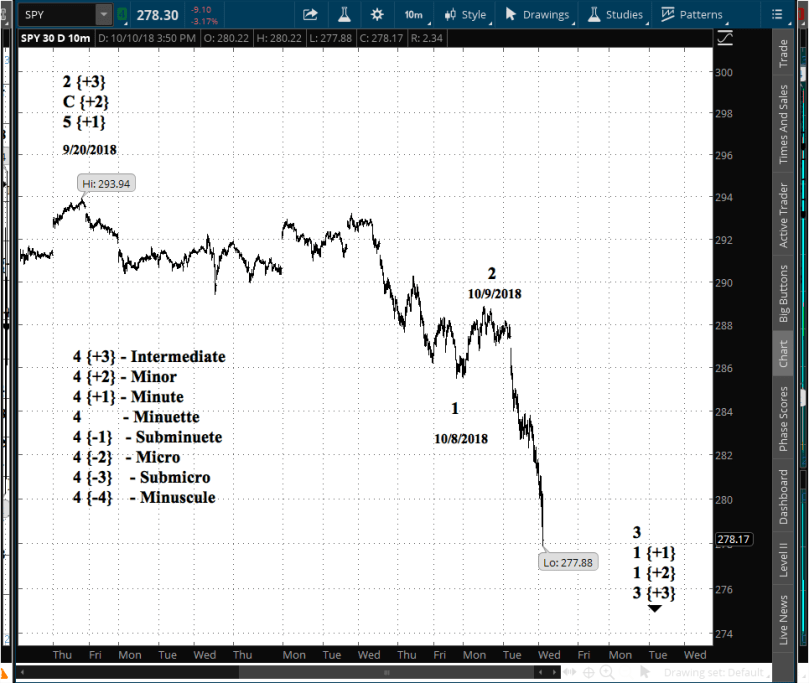
Here’s my latest near-term Elliott wave count on SPY, which tracks the S&P 500.

We’re early in the 3rd wave down of the Intermediate degree {+3}. The chart shows 30 days with 10-minute bars, and at that close-up level, I’m uncertain of the degree of the waves I’m tracking, and so have marked them with a {?}. At that degree, whatever it may be, we are in a upward 4th wave correction that will, if it is typical,

sp20181012A

I’m not finding any other broad-market Elliott wave trades that I’m comfortable taking, outside of the various equities markets.

1:40 a.m. New York time

I have exited JBL for a loss.

11:20 a.m.. New York time

Today’s Job #1 will be to make an exit decision on my JBL position, whose options expire at the end of next week. My normal practice is to exit the Friday or Money prior to expiration.

The one earnings play on my list today is BAC, and I’m passing on it without further analysis. I entered a position on C yesterday, and don’t want to add another financial I also plan to use the day to explore other broad-markets trades based on Elliott wave analysis, looking at areas such as gold, silver, oil, interest rates and the U.S. dollar.

Here is the status of my options positions.

sym option debit share price curr % max profit net prft/shr $ option days left
C 3.24 60.65 6.1 0.21 35
EWZ 0.88 38.36 (2.3) (0.02) 35
JBL 2.00 23.65 (46.0) (0.63) 7
LEN 3.55 41.36 (9.9) (0.32) 35
SPY 3.81 276.04 12.6 0.55 35
STZ 10.53 25.74 (25.4) (2.13) 35
WBA 3.32 72.44 6.7 0.24 35

And of my shares positions.

sym share price net result % net profit $ days held
AAPL 220.54 -1.5% (3.42) 28
CHK 4.44 11.0% 0.44 28
FXI 39.92 -3.1% (1.29) 28
SPXU 37.25 -8.2% (3.31) 150
TSLA 256.61 -15.9% (48.38) 11
VNQI 52.90 -6.9% (3.91) 29

By Tim Bovee, Portland, Oregon, Oct. 12, 2018

Read More »

C Analysis

Citigroup Inc. (C)

Update 11/1/2018I’ve exited C the day before the stock went ex-dividend, with the goal of avoiding potential assignment.

The cost of exiting was a $3.65 debit, producing a loss of $20 per contract, with shares at $65.65, down $3.45 from entry.

Shares declined by 5.0% over 21 days, or a -87% annual rate. The options position produced a -5.5% loss for a -95% annual rate.


I have entered a short iron fly position on C, using options that trade for the last time 37 days hence, on Nov. 16. The premium is a $3.45 credit per contract/share and the stock at the time of entry was priced at $69.10.

I made the decision to enter the trade in my account to coincide with a publication of earnings on Friday, Nov. 12, before the opening bell.

The profit zone for this position is between $73.45 on the upside and $68.45 on the downside. Read More »

SPY Analysis

SPDR S&P 500 ETF (SPY)

Update 10/23/2018: I have exited SPY for a $1.76 per contract/share with the share price at $270.95. Overall the position produced a profit of $260 per contract, which is 61.7% of maximum potential profit.

I had entered the position in the midst of a 3rd wave down in Elliott wave analysis. That wave ended and moved into a 4th wave to the upside, moving the position out of the profit zone, 

Shares declined by 2.5% over the 12-day holding period, or a -75% annual rate. The options position produced a 147.7% return for a +4,493% annual rate.


I have entered a short vertical spread on SPY, using options that trade for the last time 36 days hence, on Nov. 16. The premium is a $4.36 credit per contract/share and the stock at the time of entry was priced at $277.28.

I made the decision to enter the trade in my account based on Elliott wave analysis showing a major downtrend began on Sept. 20. 

The profit zone for this position is $274.84 and lower.

Read More »

Live: Thursday, Oct. 11, 2018

11:20 a.m. New York time

I have entered a short iron fly position on C.

10:45 a.m. New York time

I have entered a short bear call spread position on SPY.

10:10 a.m.. New York time

In an update to Wednesday’s Live feed, I posted an analysis of the S&P 500 last night, in the wake of a sharp one-day decline in the markets. I concluded that my prior analysis was spot on, and the markets indeed entered a major decline beginning with the Sept. 20 peak.

Based on that analysis, I shall be re-entering a bear position on SPY today.


Today’s Book

Elliott Wave Principle: A Key to Market Behavior

by A.J. Frost and Robert Prechter

The morning after is always a time for questions. This morning’s question: What happened with te markets and their sudden sharp decline on Wednesday, Market news reports, as always, were unsatisfactory. Trader panic over rising interest rates, they said, despite the fact that interest rates have been rising for quite some time now. When assessing the market decline, I turned immediately to Elliott wave analysis and to Frost and Prechter’s textbook on the subject, which has guided my trading since I first began in the early 1980s. I highly recommend it. 

More about the book


I shall also be looking at an earnings play. Five banking companies will have earnings announcements up for trading today and on Friday. I shall pick one of them only for the two days, since I want to keep cash in reserve for trading other sectors as the earnings season progresses.

The five are C, JPM, PNC, WFC and BAC. The top picks, based on high implied volatility ranks, are C, JPM and WFC. Of those, C has the largest market cap, and so is my top pick for a full analysis.

Here is how my options positions stand this morning.

sym option debit share price curr % max profit net prft/shr $ option days left
EWZ 1.02 38.27 (18.6) (0.16) 36
JBL 2.08 23.70 (51.8) (0.71) 8
LEN 3.45 43.58 (6.8) (0.22) 36
STZ 8.80 220.28 (4.8) (0.40) 36
WBA 3.13 71.82 12.1 0.43 36

And this is how things stand with my share positions

sym share price net result % net profit $ days held
AAPL 215.01 -4.0% (8.95) 27
CHK 4.37 9.3% 0.37 27
FXI 39.41 -4.4% (1.80) 27
SPXU 36.97 -8.9% (3.59) 149
TSLA 256.20 -16.0% (48.79) 10
VNQI 53.15 -6.4% (3.66) 28

By Tim Bovee, Portland, Oregon, Oct. 11, 2018

Read More »

WBA Analysis

Walgreens Boots Alliance Inc. (WBA)

Update 11/7/2018: I have exited WBA for a debit of $503 per contract, $147 greater than the credit at entry, with shares at $890.65, $6.96 higher than at entry.

Shares rose by 9.4% over 28 days, or a +123% annual rate. Tye options position produced a 29.2% loss for a -381% annual rate.


I have entered a short iron fly options spread on !S, using options that trade for the last time 37 days hence, on Nov. 16. The premium is a $3.56 credit per contract/share and the stock at the time of entry was priced at $73.60.

I made the decision to enter the trade in my account to coincide with an earnings announcement, on Thursday, Oct. 11, before the opening bell. 

The profit zone for this position is between $78.06 on the upside and $71.06 on the downside.

Read More »

Live: Wednesday, Oct. 10, 2018

7:20 p.m. New York time

After the Fall

Given the magnitude of today’s events, I’m taking an analytical look at the S&P 500 now, freeing up my time for trading on Thursday.

The markets took a dramatic fall today, and the market news reports are filled with all sorts of reasons why. Which I ignore entirely. I focus on the charts and the options, and leave the news — always a trailing indicator — to others.

All of the major indexes took a tumble, although in the general scheme of things, it wasn’t The End of the World As We Know It — 3% plus change.


Today’s Book

Talking to My Daughter About the Economy: or How Capitalism Works — and How It Fails

by Yanis Varoufakis

World renowned economist, Greek parliamentarian, Minister of Finance of Greece — Yanis Varoufakis steps down from his Renaissance person resumé to the role of father, as he teaches his 13-year-old daughter about the core questions of our age: How the economy works, how things fall apart. Fundamentally, his topic is, How the World works. My first contact with Varoufakis in his economist role was The Global Minotaur, his 2015 discussion of the Great Recession, and what came before and after. I found it to be one of clearest and most insightful explanations I had read. Much has happened since. Such a lucky daughter! And lucky us, to have a chance to eavesdrop on their father-daughter conversation.

More about the book


I’m going to show two charts. Both are Elliott wave analysis — big picture first and then up close second. The Elliott wave charts are for active traders, like me.

The first chart is a one-year chart of SPY, the S&P 500 exchange-traded fund, with a bar for each trading day.

spy20181010B

I’m happy to say that my analysis has stood up to the actual course of prices. This chart is unchanged from the last time I posted it, on Oct. 4. By this analysis, the decline from the peak on Sept. 20 is the beginning of a major downturn that will last a long time and cover a lot of distance, with the usual upward corrections to keep things interesting.

This is a 3rd wave of the Intermediate degree {+3}, which means it will typically be a very active wave that will cover lots of territory. The 2nd wave of the Intermediate last seven months, which shows the order of magnitude were looking at. The actually can vary significantly from that, especially if the 3rd wave shows an extended pattern.

The second chart, also of SPY and covering 30 days with 10-minute bars, shows the detail of what has happened since the Sept. 20 peak.

spy20181010

The chart shows that SPY has moved into a 3rd wave of a lower degree. I’ve labelled it as the Minuette degree, but it could be lower still. Time will tell.

The small degree 3rd wave could be almost complete, but it could also go lower still. Hard to tell this early in the game.

Read More »

Live: Tuesday, Oct. 9, 2018

12:45 p.m. New York time

I’ve spent the morning prepping for the earnings season.Here’s a look ahead at the rest of this week.

I have two potentials I’m looking at for Wednesday, DAL and WBA. Both have implied volatility ranks above 50.

For Thursday, I’m looking at two with IVRs of 50 or higher, C and WFC. Three other symbols are on the list but with lower IVRs: JPM, PNC and BAC. I’ll consider them if their IVRs rise to 50 or higher.

Next week, the earnings season floodgates open, and we can start to have fun.

10:20 a.m.. New York time

I have no trades in sight today, neither exits nor new positions.


Today’s Book

Factfulness:

Ten Reasons We’re Wrong About the World — and Why Things Are Better Than You Think

by Hans Rosling et al.

Bill Gates, someone whose opinions I take very seriously, said of this book, “One of the most important books I’ve ever read — an indispensable guide to thinking clearly about the world.” 

I don’t know about you, but every morning when I fire up my iPhone X, I’m greeted with a hammering chorus of doom. Things are awful. They can only get worse. And there’s nothing we can do about it. Factfulness rationally challenges that neo-apocalyptic world view that has become like the toxic air we breathe. In an age of increasing confusion and uncertainty, the clarity of Factfulness must surely be the most valuable of goods we can seek.

More about the book


As I noted on Monday’s Live feed, things will get more interesting later in the week. Meanwhile, here’s where my options positions stand now.

sym option debit share price curr % max profit net prft/shr $ option days left
EWZ 1.25 39.10 (45.3) (0.39) 38
JBL 1.98 24.84 (44.5) (0.61) 10
LEN 3.06 45.59 5.3 0.17 38
SPY 2.31 287.81 24.8 0.76 38
STZ 10.53 225.85 (25.4) (2.13) 38

Here’s where my shares positions stand.

sym share price net result % net profit $ days held
AAPL 224.13 0.1% 0.17 25
CHK 4.77 19.3% 0.77 25
FXI 40.42 -1.9% (0.79) 25
SPXU 33.15 -18.3% (7.41) 147
TSLA 259.74 -14.8% (45.25) 8
VNQI 54.13 -4.7% (2.68) 26

By Tim Bovee, Portland, Oregon, Oct. 9, 2018

Read More »