Live: Tuesday, Aug. 7, 2018

10:35 a.m. New York time

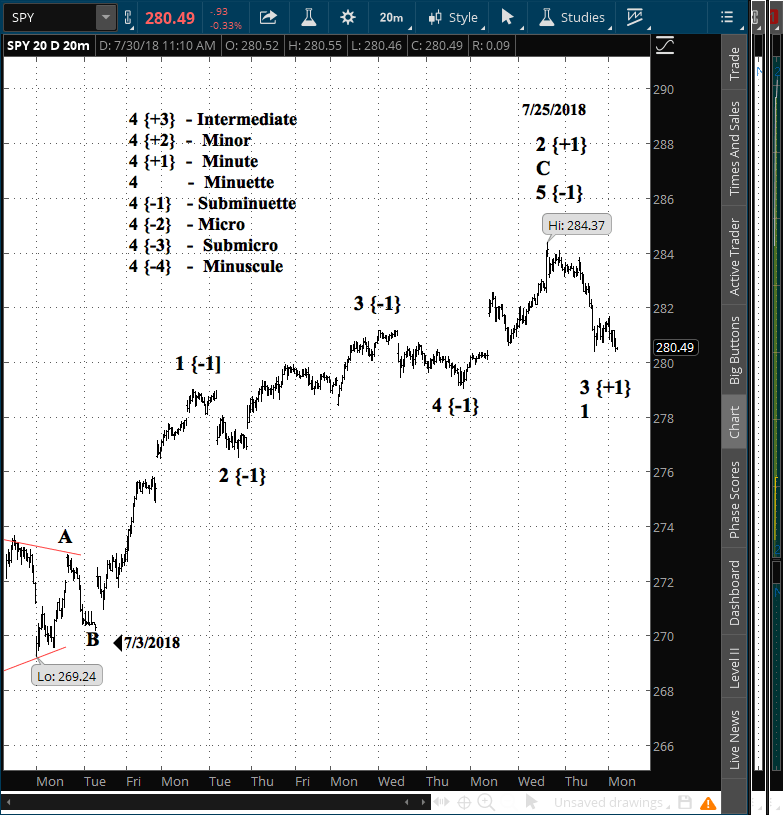
By my  Elliott wave count, we’re at a turning point in the counter-trend rise that began April 2.

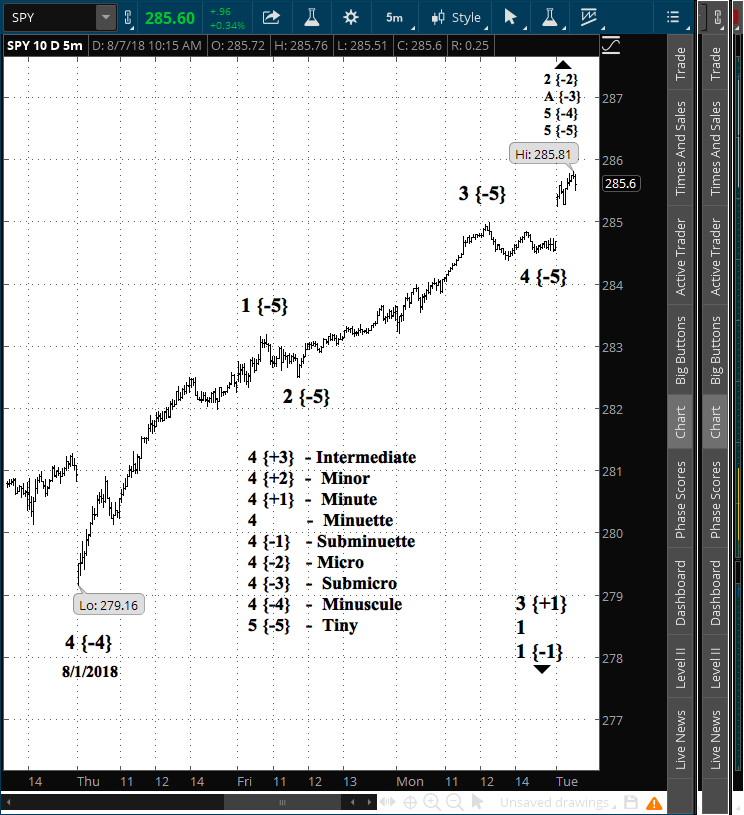
In the chart below, I focus on the final wave, a 5th wave of the Minuscule degree {-4}, and it’s internal waves, at a level so small it lacks a name. Let’s agree to call it the “Tiny”. By my count, SPY is in the 5th wave of the Tiny degree {-5}.

The chart covers Aug. 1 to the present, with 5-minute bars.

spy20180807

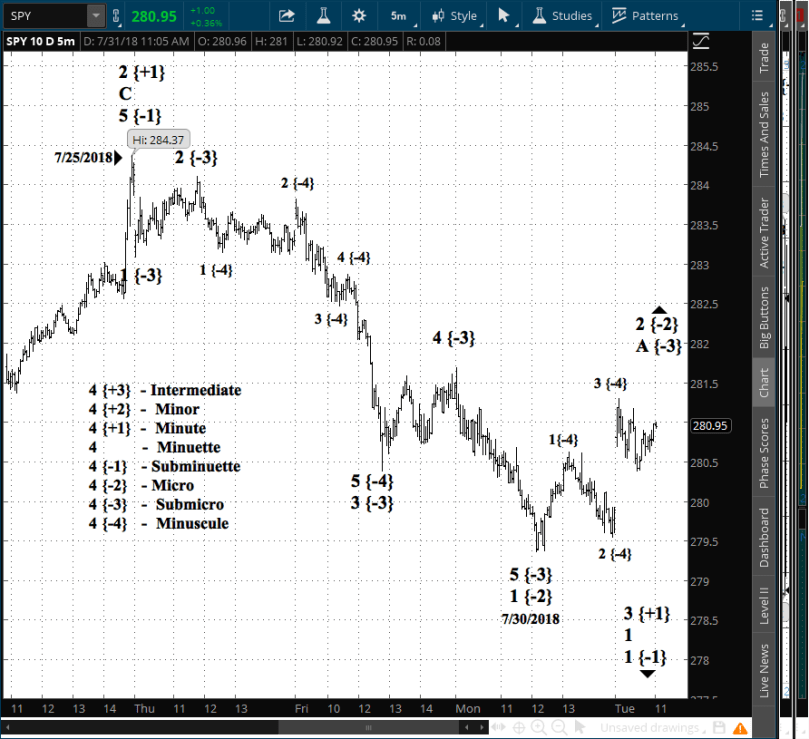
By “turning point” I mean that the first leg of the counter trend correction, the A wave of Submicro degree {-3} is nearing completion, to be followed by a downward B wave, which often has three waves internally, and then a C wave to the upside that will complete the 2nd wave of Micro degree.

The proper identification of degrees is always a matter of ambiguity in Elliott. But for my purposes what counts is the relationship among the waves — how far along as the price movement progressed. In that latter respect Elliott wave analysis can be made with great confidence.

My present position expires Aug. 17. It is loss-making at this point. Given how far advanced the A wave is, the rational choice is to delay until the last possible moment before getting out.

Or as the Earth-child raised by Martians, Valentine Michael Smith, put it in Robert A. Heinlein’s 1961 masterwork Stranger in a Strange Land, “Waiting is.”

By Tim Bovee, Portland, Oregon, Aug. 7, 2018

Read More »

Live: Monday, Aug. 6, 2018

9:50 a.m. New York time

SPY is trading within yesterday’s range. I have no changes to my analysis, and anticipate no trades today. My options positions on SPY expire on Aug. 17, eleven days hence, so I need to be picking an exit point.

By Tim Bovee, Portland, Oregon, Aug. 6, 2018

Read More »

Live: Thursday, Aug. 2, 2018

11:20 a.m. New York time

SPY declined in early trading to a new low in its downward march since July 25, and then rose back into the prior day’s range. My Elliott wave analysis shown in the most recent chart continues to be valid.

Long-time readers will have noticed that my pace of trading has slowed considerably this year. Blame the bear market that began Jan. 26.

Most of my trading before this year was in the form of earnings plays: Selling options positions before the earnings announcement, at high implied volatility, and then buying them back after the announcement, when volatility had fallen.

That works if I can have a theory of how the price will respond to the announcement. In an optimistic time, during a full bull market, or during a pessimistic time, during a full bear market, that assessment is fairly easy to make. There’s a lot of clarity.

But half a year into this bear market, public mood is still in the transition phase. It is deteriorating in many areas — the political mood is as dark as any I’ve seen since the 1970s — but the hopefulness of the post recession bull market continues to hold a degree of sway.

Under such circumstances, reactions to an earnings announcement can be outsized and shocking large.

The FB chart covers 10 days with 5-minute bars.

fb20180802

FB and TWTR’s similar fall confirmed my earlier assessment that earnings plays weren’t a smart move at this point in the market.

So my trading has dropped off, and I have uninvested funds. What do I do with those?

Uninvested funds present three problems: They aren’t earnings trading profits, they’re eroded constantly by inflation, and they present a temptation for spending on consumer goods.

To avoid those problems, I turn to the U.S. Treasury, and in particular, the TreasuryDirect website, which is agency’s vehicle that allows people and businesses to buy government bonds.

It has two advantages: There are no transactions fees or commissions, and it is granular with wide limits, allowing purchases at auctions of as little as $100 or as large as $5 million per auction.

My chosen vehicle is 13-week Treasury bills, which are paying 2.2% annualized. That beats the inflation measure used by the Federal Open Market Committee in its analysis, the Personal Consumer Expenditures (PCE) deflator, which stands at 1.9%, and also the expectation of future inflation implied by the 10-year Treasury bond rates, which is 2.13%

As many do, I’ve structured my holdings as a tree, with a portion of the bills maturing each week, for withdrawal or reinvestment.

It’s not as profitable or exciting as earnings plays, to be sure, but it’s a calm port for shelter during our early bear market storm.

By Tim Bovee, Portland, Oregon, Aug. 2, 2018

Read More »

Live: Tuesday, July 31, 2018

11:15 a.m. New York time

Since my very-short-term chart last week, Elliott wave analysis shows that SPY has completed wave 2 to upside of the Minute degree {+1} and is working its way through the early portion of a 3rd wave down at the same level.

It is at this microscopic level that the important waves are happening, for they determine in detail when I should add a bear positions to my options holdings in SPY.

The chart covers from July 25 to the present using 5-minute bars.

spy20180731

The count shows completion of a 1st wave to the downside at the Micro degree {-2}. A 2nd wave correction at that degree has begun, working its way through a A wave of the Submicro degree {-3} which is in a 4th wave correction at the Minuscule degree {-4}.

The next steps, once the Minuscule 4th wave is complete, will be for a 5th wave push to the upside that will complete the Submicro A wave, ushering in a B wave to the downside.

Is that the signal to enter a new SPY position? I think not. A typical 2nd wave is a zig-zag, and the C wave can be expected normally to retrace a significant amount of the preceding impulse wave, the 1st wave.

For my account, I judge the proper moment of entry to be around the end of the C wave of Submicro degree, which will in a typical zig-zag, also end the 2nd wave of Micro degree. The ensuing 3rd wave can be expected to carry well below the July 30 low, giving a position a roaring start toward profit.

By Tim Bovee, Portland, Oregon, July 31, 2018

Read More »

Live: Monday, July 30, 2018

11:15 a.m. New York time

The week opens with SPY continuing its downward course, which my Elliott wave analysis counts as wave 1 of the Minuette degree within wave 3 of the larger Minute degree {+1}

The SPY chart covers 20 days with 20-minute bars.

spy20180830

My SPY options position expires Aug. 17, which would give me an exit on Friday, Aug. 10, or perhaps Monday, Aug. 13.

With the Minute degree 3rd wave having begun, it’s also time to consider opening new positions with a later expiration.

By Tim Bovee, Portland, Oregon, July 30, 2018

Read More »

The Week Ahead: Jobs, interest rates, income, spending, global trade

cargo

It’s a two-scoop sundae week in economic reporting, with the first scoop flavored as a two-day Federal Open Market Committee meeting, ending with an announcement of changes to the Fed funds interest rate on Wednesday at 2 p.m. New York time.

The second scoop comes in the form of the monthly look at jobs, the employment situation report on Friday at 8:30 a.m. A sneak preview, the private-sector ADP employment report, will be published on Wednesday at 8:15 a.m.

Other major reports sprinkling the sundae are personal income and outlays on Tuesday and international trade on Friday, each at 8:30 a.m.

Read More »

Live: Friday, July 27, 2018

11:35 a.m. New York time

SPY continues to come down from its high of July 25. In the terminology of Elliott wave analysis,

I place the present movement as a 4th wave correction of the Micro degree {-2}, which will be followed by a final push upward, completing the C wave of  the Minuette degree that has been underway since July 3.

The next move after that completion will be a significant decline at the Minuette degree, and possibly at the Minute {+}, one degree higher.

I shall post The Week Ahead on Saturday.

By Tim Bovee, Portland, Oregon, July 27, 2018

Read More »