10:35 a.m. New York time
SPY is continuing within its range of the three prior days. I have no change in my assessment of the chart and anticipate no trades today.
By Tim Bovee, Portland, Oregon, Aug. 24, 2018
10:35 a.m. New York time
SPY is continuing within its range of the three prior days. I have no change in my assessment of the chart and anticipate no trades today.
By Tim Bovee, Portland, Oregon, Aug. 24, 2018

11:05 a.m. New York time
Chart analysis is much like the old-time serial films they used to show in movie theaters, where each episode ended with a cliff-hanger, and the kids had to shell out their nickels again to see what happened.
Having revised my longer-term Elliott Wave analysis of the SPY chart from the Jan. 26 beginning of the bear market, I took a deeper dive into components of the uptrending 4th wave of Minute degree {+1}, which began June 27.
The SPY chart covers 90 days with hourly bars.
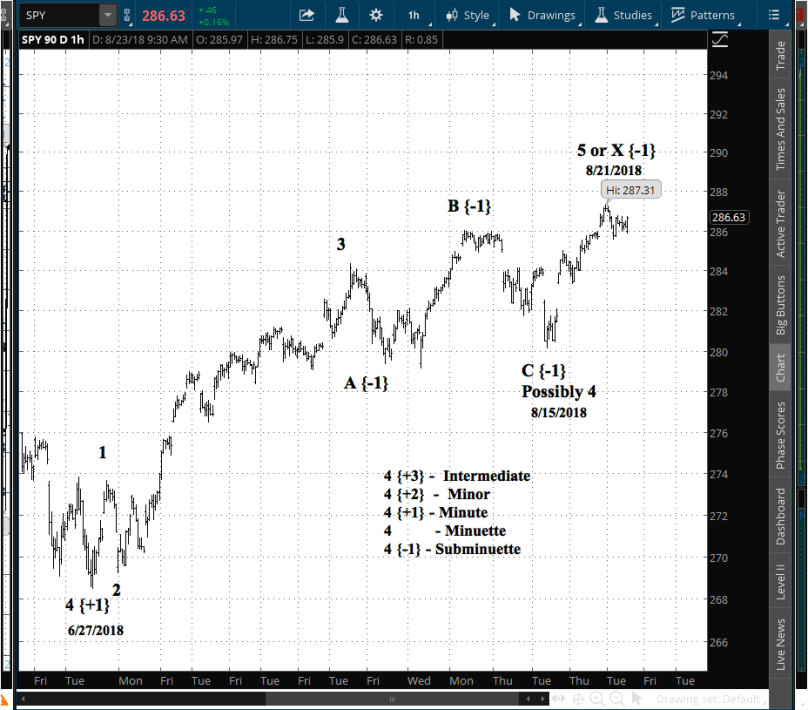
The interesting part is the leg up beginning Aug. 15, a movement that has much ambiguity. A straightforward count shows the C wave down of the Subminuette degree {-1} ended on Aug. 15.
If that wraps up the countertrend correction then that is also the end of the 4th wave and we are now pushing upward on the 5th and final wave of the C wave of Minute degree that began in April. (See the chart posted yesterday.)
However, the subsequent upward move could also prove to be the separating wave of a complex correction, with several zig-zags or flats or other corrective patterns linked to together. In Elliott, the separating waves are labeled X, and in this case it would be an X wave of Subminuette degree.
If the upward move from Aug. 15 is a 5th wave, then it will mean continued upward movement to a greater or lesser extent, followed by a significant down move, wave 3 of the Intermediate degree {+3}.
If the upward move is an X wave, then it has likely completed most its rise, and what follows will be a downward move, but not a major one, with a lower boundary on SPY in the $270s or so.
Bottom line: We don’t know which it will be. It’s a cliffhanger. We’ll need to pony up our nickels to see the next episode.
By Tim Bovee, Portland, Oregon, Aug. 23, 2018
11::10 a.m. New York time
I have re-worked my Elliott Wave analysis of the SPY chart to take of the issue that arose a couple of days ago, as described in the Live post of Aug. 21.
The SPY chart below covers one year with daily bars.
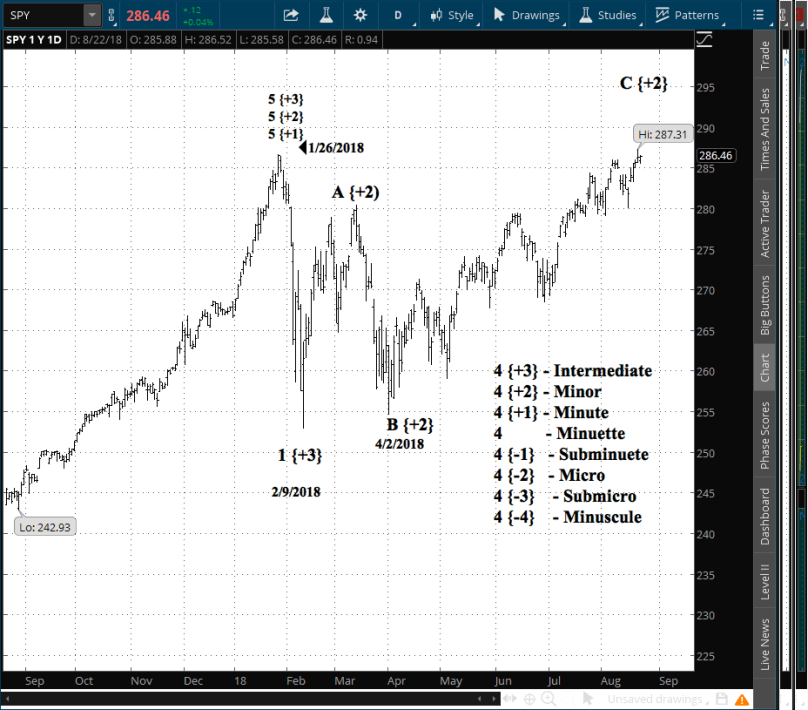
The difficulty came because I had counted the corrected since the bear market began on Jan. 26 as being a Zig-Zag — a directional correction with a 5-wave, 3-wave, 5-wave pattern. As it turns out out, the correction now analyzes as a Flat — a sieways correction — with a 3-wave, 3-wave, 5-wave pattern.
In my experience 2nd wave corrections, like this one, tend to be Zig-Zags. But it’s not a rule, and this one is marching to the beat of its own drummer.
Even so, my conclusion that the C wave is near an end remains intact. Also, my decision to exit yesterday is supported by the new wave count; the C wave may be nearing an end, but it could still have a good distance to go.
Or not. There’s no way to say.
I anticipate no trades today.
By Tim Bovee, Portland, Oregon, Aug. 22, 2018
11:25 a.m. New York time
I have updated SPY with results.
10::10 a.m. New York time
SPY rose this morning, moving higher than the Aug. 7 high, which was the starting point of wave 1. Under the rules of Elliott Wave analysis, a 2nd wave cannot move beyond the base of the 1st wave of identical degree.
The SPY chart covers 15 days with 10-minute bars.
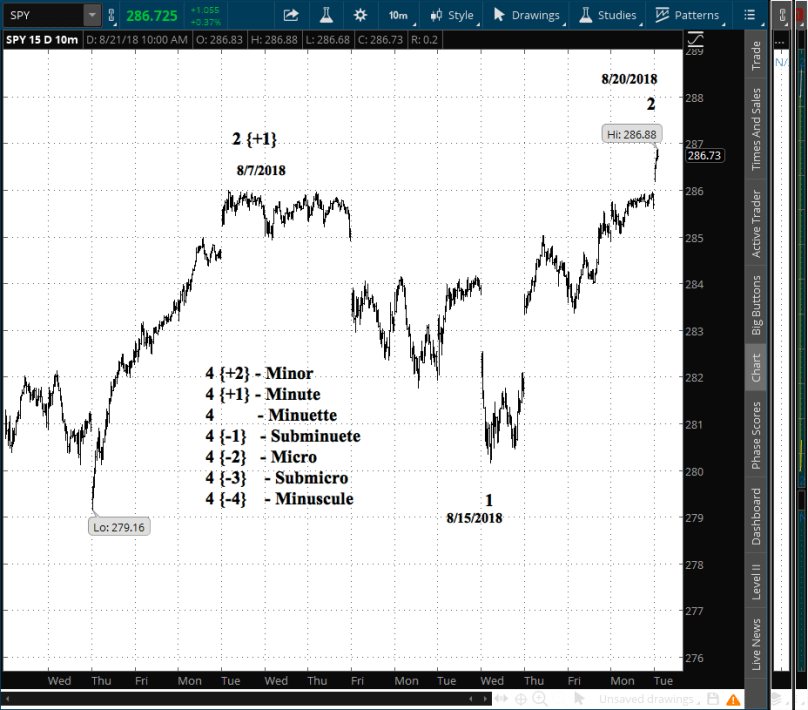
I have exited my position, since the rationale for entry no longer hold, and shall rework the analysis with an eye to determining a new re-entry..
By Tim Bovee, Portland, Oregon, Aug. 21, 2018
Update 8/21/2018: I exited my SPY position a day after entering. The price moved up, my position was based on the hypothesis that the price would move down, and there was no longer any justification for holding.
In the process of rising, SPY on my chart violated a firm rule in Elliott wave analysis: A 2nd wave can’t move beyond the start of the preceding 1st wave of the same degree. The move carried SPY above the Aug. 7 high, which is where wave 1 began.
The SPY chart covers 15 days with 10-minute bars. I’ve marked the Aug. 7 high with a red line.
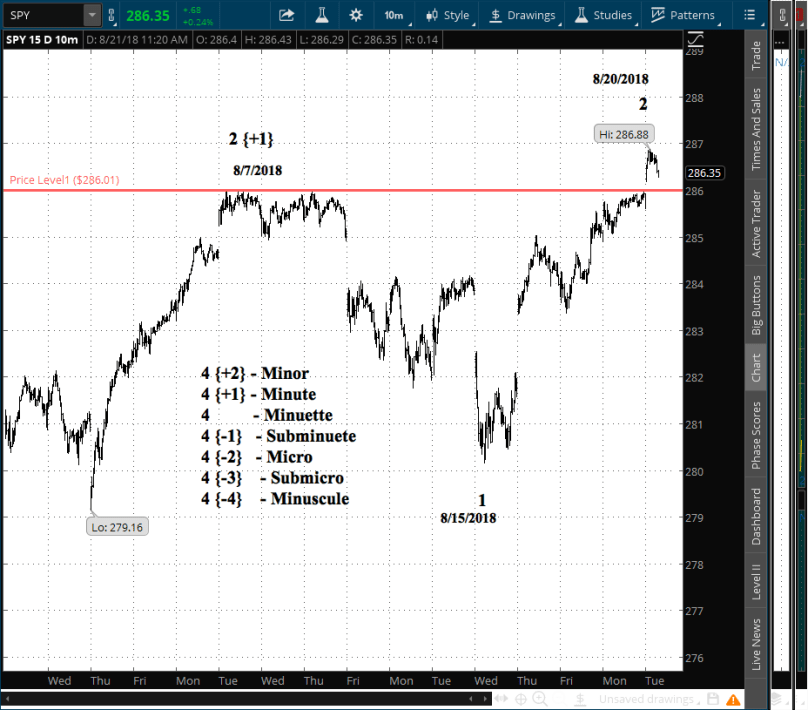
Elliott wave analysis operates like the scientific method: Conclusions are valid for the information available at that time, but new data can invalidate the analysis. That’s what happened here.
That characteristic is one reason I use Elliott in my trading. Unlike other other methods, which provide absolute answers, Elliott explicitly recognizes the limits of what we know and sends us back to form new hypotheses to account for new information.
I exited for a $4.54 debit, a 30-cent loss excluding fees, with shares at $286.78, up 99 cents from entry.
Shares rose by 0.4% over one day for a +126% annual rate. The options position produced a 6.6% loss for a -2,412% annual rate.
I have entered a short vertical spread on SPY, using options that trade for the last time 88 days hence, on Nov. 16. The premium is a $4.24 credit and the stock at the time of entry was priced at $285.79.
I made the decision to enter the trade in my account based on my Elliott wave analysis of the chart. I show SPY completing a corrective wave to the upside, with two possibilities going forward: Resumption of the downward trend or a downwave within the upward countertrend corrective wave.
2:10 p.m. New York time
I entered a bear call spread position on SPY.
11:55 a.m. New York time
This morning’s SPY chart, covering five days with 5-minute bars.
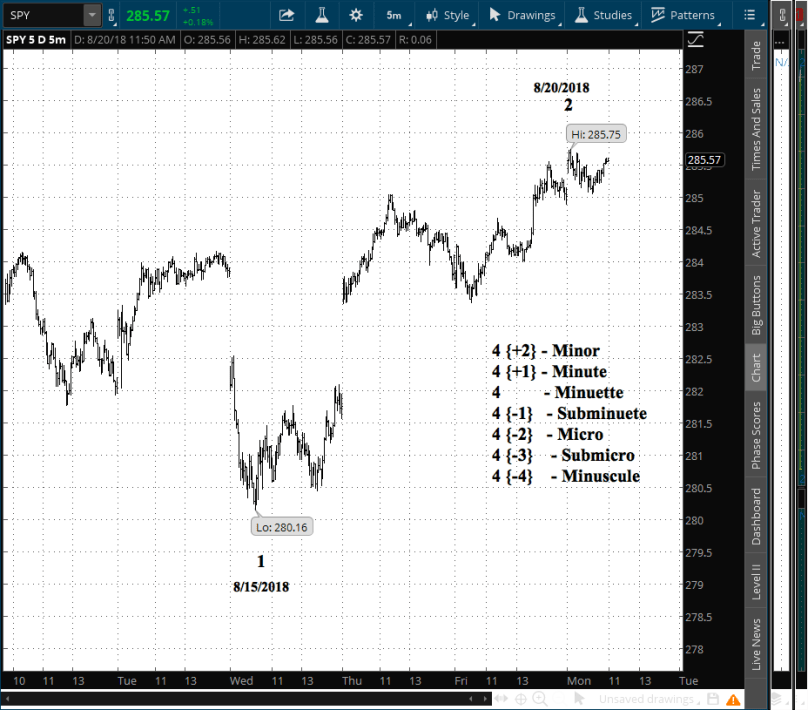
I’ve moved the degrees up a bit, making the Aug. 15 low the end of the 1st wave of Minuette degree. For this chart I’ve counted the Aug. 20 high as the end of the 2nd wave of Minuette degree. It could also be seen as the end of the A wave of the Subminuette.
In either case, the next wave is down, and I plan to re-enter SPY today or tomorrow, with a bear position.
By Tim Bovee, Portland, Oregon, Aug. 20, 2018
 Economically significant? Sometimes. Often of interest? Sure. Who doesn’t take notice when the powerful gather to celebrate their power. And to exchange ideas. And maybe, to learn. Or to mislearn.
The Federal Reserve Bank of Kansas City, as it has since 1978, hosts the annual Economic Policy Symposium, and as has been the case since 1982, the location will be Jackson Hole, Wyoming, which has better mountains than the bank’s home base.
The symposium’s theme this year: “Changing Market Structure and Implications for Monetary Policy”. In a time when the Fed continues to tighten the Fed Funds rate, and seven months after the S&P 500 hit a peak that has not been equalled since, it’s a topic that ought to make the heart of every trader’s heart beat just a little bit faster.
The full agenda can be found here. The most closely watched speech will likely be that of Fed Chairman Jerome Powell, who takes to the podium on Friday at 10 a.m. New York time to discuss monetary policy.
There are also major economic reports to be followed during the week: Durable goods orders — how confident are buyers that it’s a good time to take-on significant capital purchases — on Friday at 8:30 a.m., and two real-estate reports, existing home sales on Wednesday at 10:30 a.m., and new home sales on Thursday at 10 a.m.
The Fed outside of Jackson Hole will also get a moment in the sun with the release on Wednesday at 2 p.m. of Federal Open Market Committee minutes from the July 31-Aug. 1 meeting, at which members voted to raise the Fed Funds rate by 25 basis points.
3:10 p.m. New York time
SPY is continuing to work its way up, and I shall wait until next week at the earliest before re-establishing a bear position.
11:25 a.m. New York time
SPY reached at peak at the very small degree I’ve been tracking, the Tiny degree {-5). See my discussion yesterday and my chart talk the day before.
This chart of SPY is a 20-day chart with hourly bars. It clearly shows three waves to the upside, ending in a 4th wave downward correction at the Tiny degree, and I now anticipate a 5th wave to the upside, completing the Minuscule {-4} degree rise.

Bottom line: I should consider re-establishing my position either today or Monday. I’ll be keeping an eye on it and make a decision later today.
By Tim Bovee, Portland, Oregon, Aug. 17, 2018
11:55 a.m. New York time
My chart analysis of SPY, posted yesterday, proved to be accurate. SPY has reversed to the upside in the 2nd wave of the Minuscule degree {-4}. I anticipate no trades today as I wait for that 2nd wave to work its way through.
By Tim Bovee, Portland, Oregon, Aug. 16, 2018
10:20 a.m. New York time
Having exited my former SPY position on Tuesday, the next task is to figure out when to re-establish a position with a later expiration date.
This early in the decline from the Aug. 7 peak, I’m somewhat arbitrarily declaring the degree of my count to be one so low that it doesn’t have an “official” name. I’ve elected to call it the Tiny degree {-5}, one degree smaller than the officially named Minuscule degree {-4}. As the pattern develops, I may decide to change that degree to a higher one. Or not. There’s no way to tell yet.
The SPY chart covers 15 days using 5-minute bars.
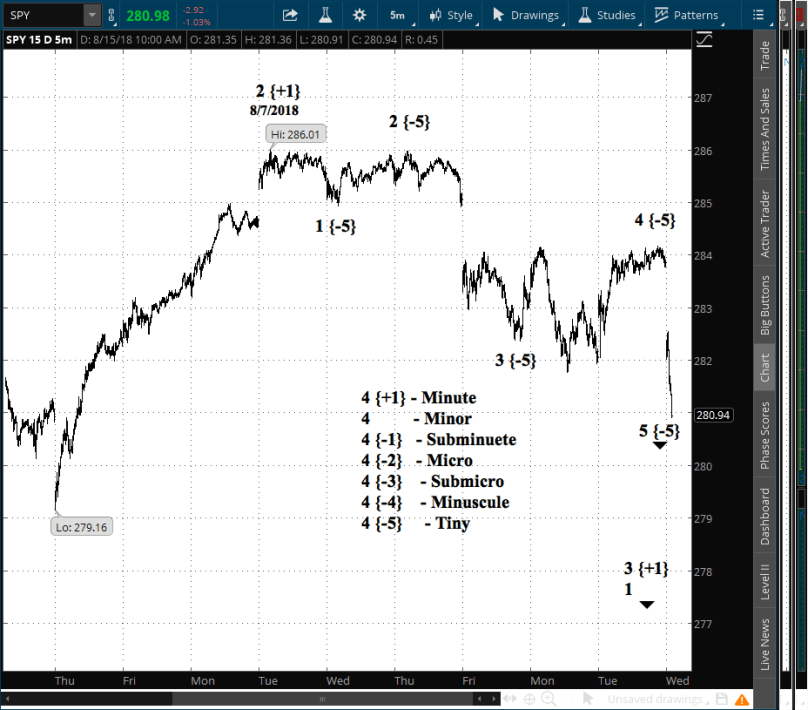
By my count we are in the 5th wave down of the tiny within the 1st wave of the Minuscule degree. I’m waiting for that 5th wave to end, and intend to enter a new position on SPY during the 2nd wave Minuscule, an uptrending counter-trend correction.
We’re not there yet. I don’t anticipate trades today. Waiting is.
By Tim Bovee, Portland, Oregon, Aug. 15, 2018


You must be logged in to post a comment.