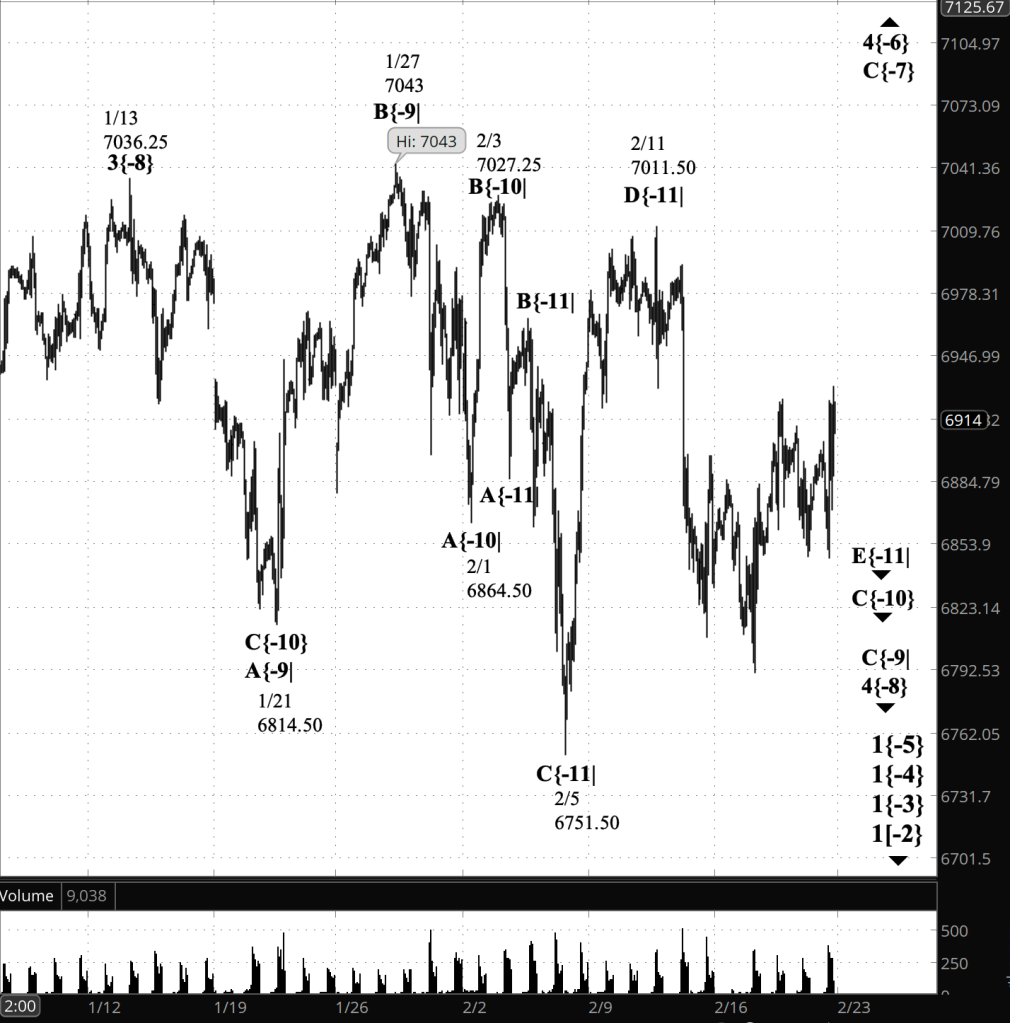
3:30 p.m. New York time
Half an hour before the closing bell. The S&P 500 futures rose into the 6880s after the session began and then fell back into the 6850s as the closing bell approached. Trading has remained choppy and overlapping throughout the afternoon.
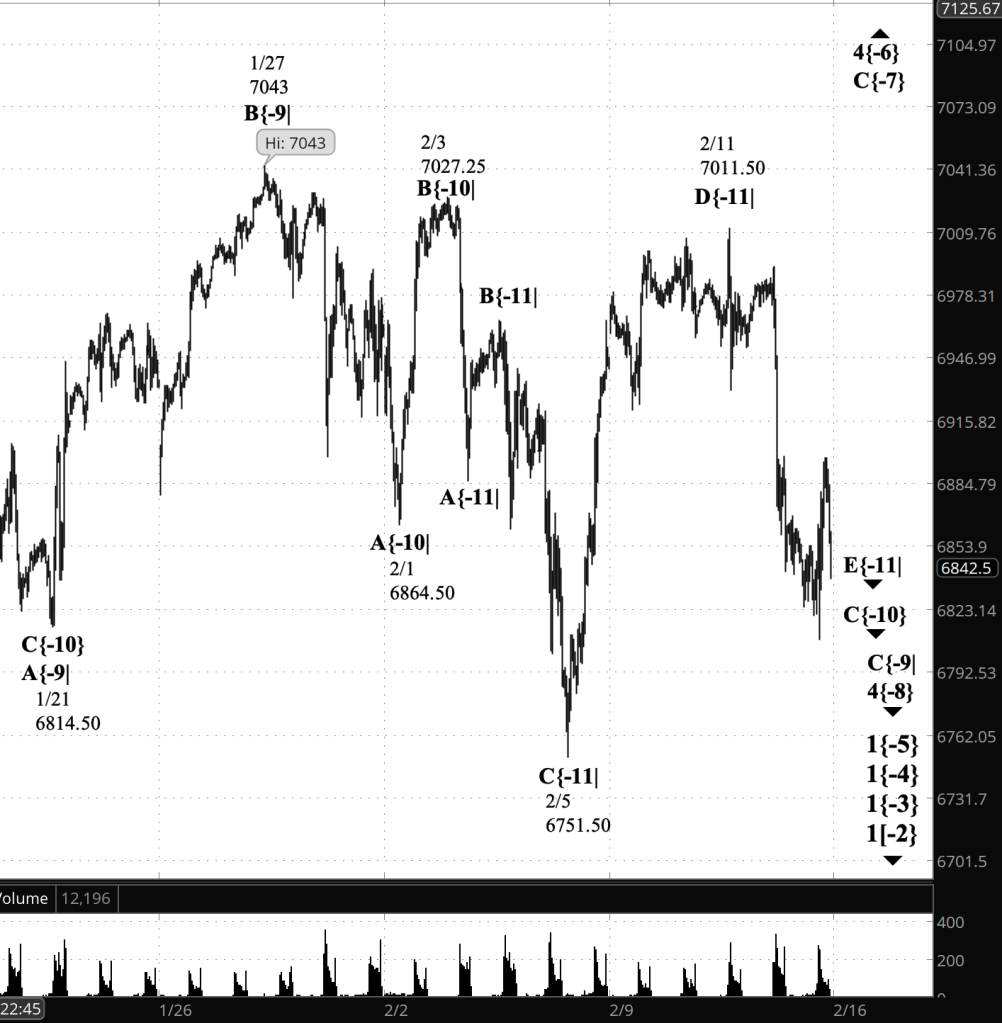
Elliott Wave Theory. Uptrending wave 5{-8} continues and appears to be working through a downward corrective subwave. The absence of sustained directional follow-through supports the view that the decline remains corrective rather than impulsive.
9:35 a.m. New York time.
What’s happening now. The S&P 500 E-mini futures reached an overnight peak of 6915.50 and then declined, so far reaching into the 6850s. Following the release of the January Producer Price Index an hour before the opening bell, price rebounded modestly into the 6860s. The session has so far been defined by an initial selloff, a reaction to the data, and continued overlapping movement.
What does it mean? From an Elliott Wave Theory perspective, the decline appears corrective in nature. The preferred interpretation is that it represents a 4th subwave within uptrending wave 5{-8}, which began on February 17 from 6791.
The open question is the degree of that corrective wave. On the chart it is labeled as wave 4{-9}, one degree below wave 5{-8}. However, it could alternatively be unfolding two degrees lower, as wave 4{-10} within wave 1{-9}, or possibly at an additional lower degree. At this stage, price structure does not allow a confident determination of which degree is correct. What is visible is overlapping, choppy movement typical of a 4th-wave interruption rather than the start of a new impulsive decline.
Decision points. As long as price holds above the February 17 low at 6791, the working assumption remains that wave 5{-8} is in progress and that the present decline is corrective. A sustained move below 6791 would invalidate that interpretation and strongly suggest that the rise since February 17 was itself a subwave within a larger downward correction, likely wave 4{-8}. On the upside, a decisive move above 6915.50 would strengthen the case that the 4th wave has ended and that the next advancing subwave within wave 5{-8} is underway.
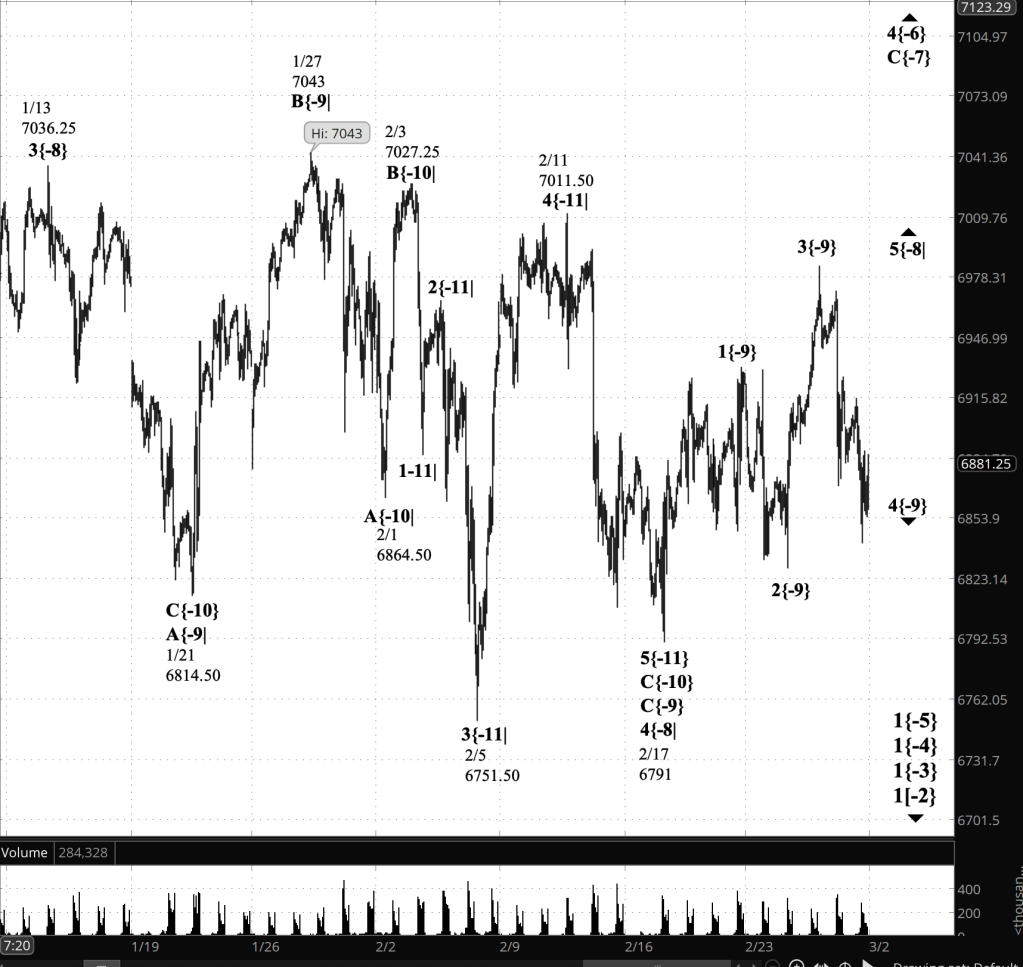
[S&P 500 E-mini futures at 3:30 p.m., 70-minute bars, with volume]
Waves Now Underway
These are the waves currently in progress under my principal analysis. Each line on the list shows the wave number, with the subscript in curly brackets, the traditional degree name, the starting date, the starting price of the S&P 500 E-mini futures, and the direction of the wave.
Most of the waves began not long ago, on October 8, 2025. See my essay posted on October 12, 2025, “The End of the Rise from 1932? Elliott Wave Theory Says ‘Yes’”, for a discussion of how that happened.
The difficult problem of estimating when a wave change should be accept as real rather than a headfake is addressed by the essay titled, “Is This Reversal Real?: How to Tell Without Being Whipsawed”.
- 1{+4} Supermillennium, (unknown start date or start price) {down}
- A hypothetical wave one degree higher than Supercyle, needed to make the wave analysis complete.
- S&P 500 Index:
- 1{+3} Supercycle, 10/8/2025, 6812.25 (down}
- 1{+2} Cycle, 10/8/2025, 6812.25 (down}
- 1{+1} Primary, 10/8/2025, 6812.25 (down}
- 1{0} Intermediate, 10/8/2025, 6812.25 (down}
- 1{-1} Minor, 10/8/2025, 6812.25 (down}
- 1{-2} Minute, 10/8/2025, 6812.25 (down}
- S&P 500 Futures
- 1{-3} Minuette 10/8/2025, 6812.25 (down}
- 1{-4} Subminutte 10/8/2025, 6812.25 (down}
- 1{-5} Micro, 10/8/2025, 6812.25 (down}
- 4{-6} Submicro, 10/10/2025, 6540.25 (up)
- C{-7} Minuscule, 11/21/2025, 6525 (up)
- 5{-8} (none), 2/17/2026, 6791 (up)
- 1{-9} (none), 2/17/2026, 6791 (up)
Reading the chart. Price movements — waves – – in Elliott Wave Theory analysis are labeled with numbers within trending waves and letters with corrective waves. The subscripts — numbers in curly brackets — designate the wave’s degree, which, in Elliott Wave analysis, means the relative position of a wave within the larger and smaller structures that make up the chart. R.N. Elliott, who in the 1930s developed the form of analysis that bears his name, viewed the chart as a complex structure of smaller waves nested within larger waves, which in turn are nested within still larger waves. In mathematics it’s called a fractal structure, where at every scale the pattern is similar to the others.
Learning and other resources. Elliott Wave analysis provides context, not prophecy. As the 20th century semanticist Alfred Korzybski put it in his book Science and Sanity (1933), “The map is not the territory … The only usefulness of a map depends on similarity of structure between the empirical world and the map.” And I would add, in the ever-changing markets, we can judge that similarity of structure only after the fact.
See the menu page Analytical Methods for a rundown on where to go for information on Elliott Wave analysis.
By Tim Bovee, Portland, Oregon, February 27, 2026
Disclaimer
Tim Bovee, Private Trader tracks the analysis and trades of a private trader for his own accounts. Nothing in this blog constitutes a recommendation to buy or sell stocks, options or any other financial instrument. The only purpose of this blog is to provide education and entertainment.
No trader is ever 100 percent successful in his or her trades. Trading in the stock and option markets is risky and uncertain. Each trader must make trading decisions for his or her own account, and take responsibility for the consequences.
All content on Tim Bovee, Private Trader by Timothy K. Bovee is licensed under a Creative Commons Attribution-ShareAlike 4.0 International License.
Based on work at www.timbovee.com


You must be logged in to post a comment.